

RNA Sequencing of Arabidopsis thaliana Seedlings after Non-Thermal Plasma-Seed Treatment Reveals Upregulation in Plant Stress and Defense Pathways
- PMID: 35328494
- PMCID: PMC8955755
- DOI: 10.3390/ijms23063070
RNA Sequencing of Arabidopsis thaliana Seedlings after Non-Thermal Plasma-Seed Treatment Reveals Upregulation in Plant Stress and Defense Pathways
Abstract
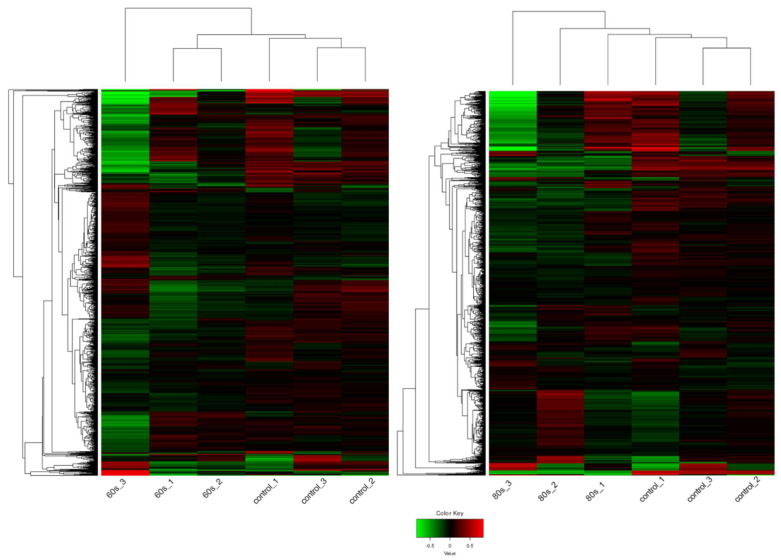
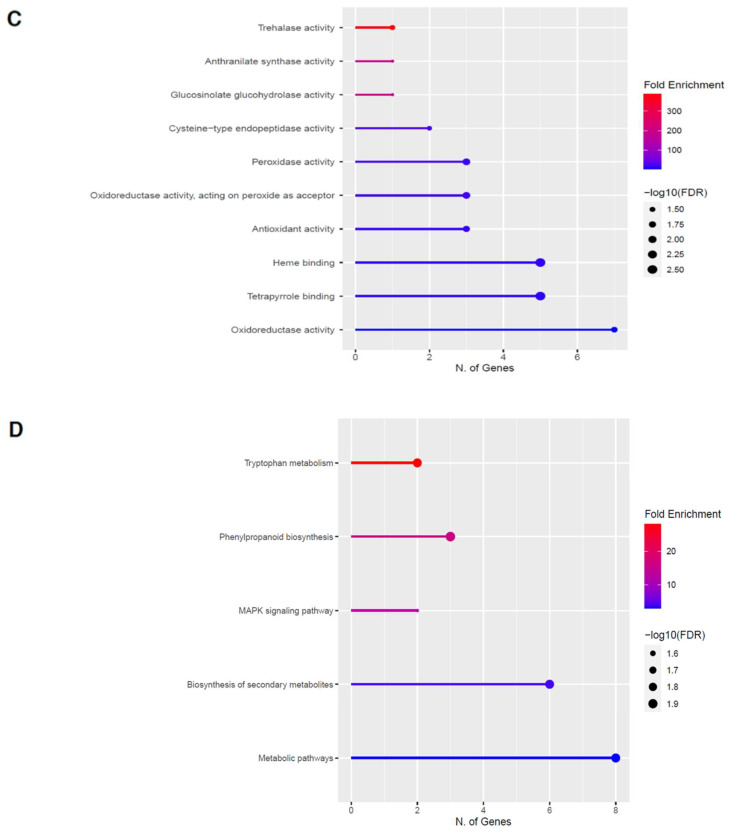
Not all agricultural practices are sustainable; however, non-thermal plasma treatment of seeds may be an eco-friendly alternative to improve macroscopic plant growth parameters. Despite the numerous successful results of plasma-seed treatments reported in the literature, there is a large gap in our understanding of how non-thermal plasma treatments affect seeds, especially due to the plethora of physical, chemical, and biological variables. This study uses RNA sequencing to characterize the changes in gene transcription in Arabidopsis thaliana (L.) Heynh. seeds 6 days after exposure to surface dielectric barrier discharge plasma treatment. Here, we provide an overview of all pathways that are differentially expressed where few genes are upregulated and many genes are downregulated. Our results reveal that plasma treatment time is a parameter that can activate different pathways in plant defense. An 80 s treatment upregulates the glucosinolate pathway, a defense response to insects and herbivores to deter feeding, whereas a shorter treatment of 60 s upregulates the phenylpropanoid pathway, which reinforces the cell wall with lignin and produces antimicrobial compounds, a defense response to bacterial or fungal plant pathogens. It seems that plasma elicits a wounding response from the seed in addition to redox changes. This suggests that plasma treatment can be potentially applied in agriculture to protect plants against abiotic and biotic stresses without discharging residues into the environment.
Keywords: Arabidopsis thaliana; RNA sequencing; glucosinolates; non-thermal plasma; oxidation-reduction; phenylpropanoids; plant defense; secondary metabolism; wounding.
Conflict of interest statement
The authors declare no conflict of interest. The funders had no role in the design of the study, in the collection, analyses, or interpretation of data, in the writing of the manuscript, or in the decision to publish the results.
Figures


Similar articles
-
Catabolism of Glucosinolates into Nitriles Revealed by RNA Sequencing of Arabidopsis thaliana Seedlings after Non-Thermal Plasma-Seed Treatment.Life (Basel). 2022 Nov 8;12(11):1822. doi: 10.3390/life12111822. Life (Basel). 2022. PMID: 36362977 Free PMC article.
-
Indole Glucosinolate Biosynthesis Limits Phenylpropanoid Accumulation in Arabidopsis thaliana.Plant Cell. 2015 May;27(5):1529-46. doi: 10.1105/tpc.15.00127. Epub 2015 May 5. Plant Cell. 2015. PMID: 25944103 Free PMC article.
-
Modulation of CYP79 genes and glucosinolate profiles in Arabidopsis by defense signaling pathways.Plant Physiol. 2003 Jan;131(1):298-308. doi: 10.1104/pp.011015. Plant Physiol. 2003. PMID: 12529537 Free PMC article.
-
How does a plant orchestrate defense in time and space? Using glucosinolates in Arabidopsis as case study.Curr Opin Plant Biol. 2017 Aug;38:142-147. doi: 10.1016/j.pbi.2017.04.009. Epub 2017 May 30. Curr Opin Plant Biol. 2017. PMID: 28575680 Review.
-
A Comprehensive Gene Inventory for Glucosinolate Biosynthetic Pathway in Arabidopsis thaliana.J Agric Food Chem. 2020 Jul 15;68(28):7281-7297. doi: 10.1021/acs.jafc.0c01916. Epub 2020 Jul 1. J Agric Food Chem. 2020. PMID: 32551569 Review.
Cited by
-
Catabolism of Glucosinolates into Nitriles Revealed by RNA Sequencing of Arabidopsis thaliana Seedlings after Non-Thermal Plasma-Seed Treatment.Life (Basel). 2022 Nov 8;12(11):1822. doi: 10.3390/life12111822. Life (Basel). 2022. PMID: 36362977 Free PMC article.
-
Plasma Bioscience and Medicine Molecular Research.Int J Mol Sci. 2023 May 24;24(11):9174. doi: 10.3390/ijms24119174. Int J Mol Sci. 2023. PMID: 37298125 Free PMC article.
-
Cold atmospheric plasma drives USP49/HDAC3 axis mediated ferroptosis as a novel therapeutic strategy in endometrial cancer via reinforcing lactylation dependent p53 expression.J Transl Med. 2025 Apr 15;23(1):442. doi: 10.1186/s12967-025-06449-8. J Transl Med. 2025. PMID: 40234906 Free PMC article.
-
Non-thermal atmospheric plasma treatments enhance the growth, photosynthesis, metabolite accumulation, and nutritional value of geranium (Pelargonium graveolens L'Herit) leaves.BMC Plant Biol. 2025 Jan 25;25(1):109. doi: 10.1186/s12870-025-06118-4. BMC Plant Biol. 2025. PMID: 39863856 Free PMC article.
-
Current Advancements in the Molecular Mechanism of Plasma Treatment for Seed Germination and Plant Growth.Int J Mol Sci. 2022 Apr 21;23(9):4609. doi: 10.3390/ijms23094609. Int J Mol Sci. 2022. PMID: 35562997 Free PMC article. Review.
References
-
- Waskow A., Howling A.A., Furno I. Mechanisms of plasma-seed treatments as a potential seed processing technology. Front. Phys. 2021;9:174. doi: 10.3389/fphy.2021.617345. - DOI
-
- FAO News Article: Pollutants from Agriculture a Serious Threat to World’s Water. [(accessed on 10 January 2022)]. Available online: https://www.fao.org/news/story/en/item/1141534/icode/
-
- IPCC Land Is a Critical Resource, IPCC Report Says. [(accessed on 10 January 2022)]. Available online: https://www.ipcc.ch/2019/08/08/land-is-a-critical-resource_srccl/
-
- Guragain R.P., Baniya H.B., Dhungana S., Chhetri G.K., Sedhai B., Basnet N., Shakya A., Pandey B.P., Pradhan S.P., Joshi U.M., et al. Effect of plasma treatment on the seed germination and seedling growth of radish (Raphanus sativus) Plasma Sci. Technol. 2021;24:015502. doi: 10.1088/2058-6272/ac3476. - DOI
Publication types
MeSH terms
Substances
Grants and funding
LinkOut - more resources
Full Text Sources
Miscellaneous
