

Long Non-Coding RNAs Might Regulate Phenotypic Switch of Vascular Smooth Muscle Cells Acting as ceRNA: Implications for In-Stent Restenosis
- PMID: 35328496
- PMCID: PMC8952224
- DOI: 10.3390/ijms23063074
Long Non-Coding RNAs Might Regulate Phenotypic Switch of Vascular Smooth Muscle Cells Acting as ceRNA: Implications for In-Stent Restenosis
Abstract
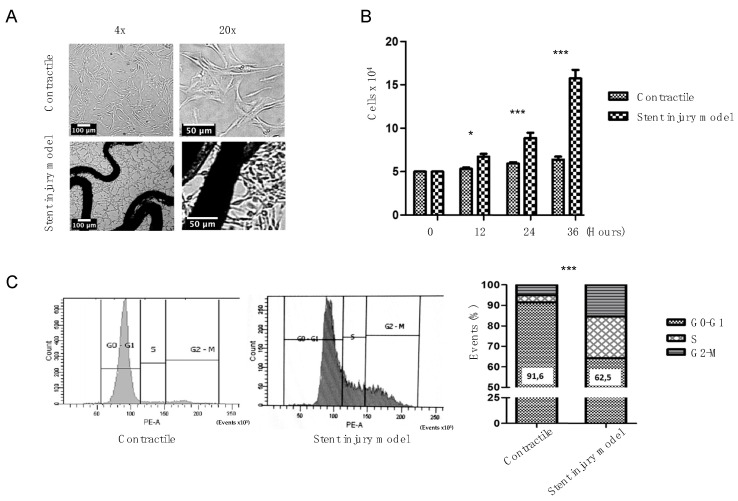
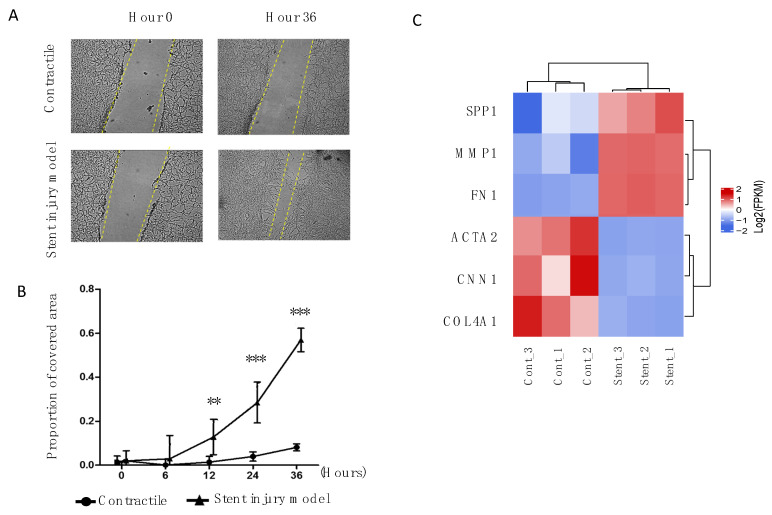
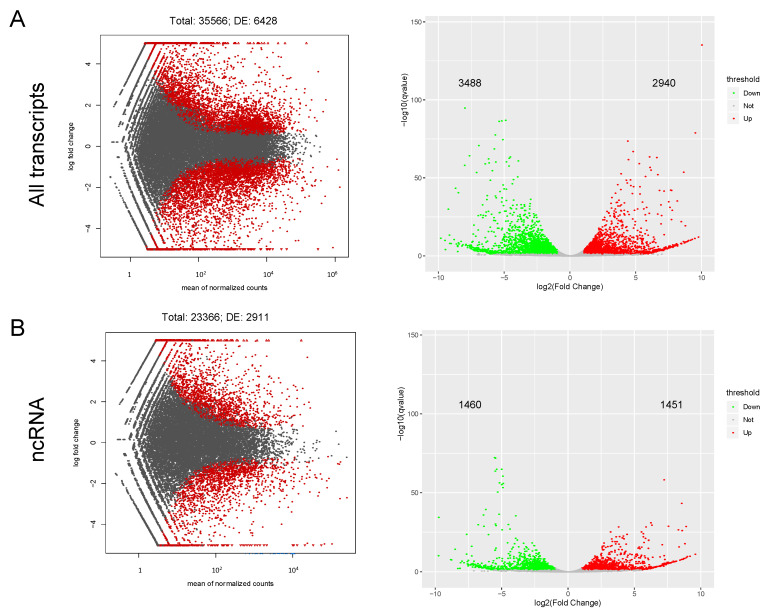
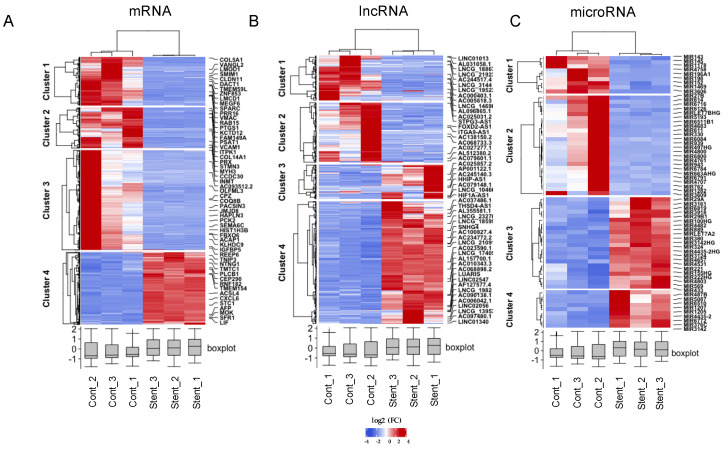
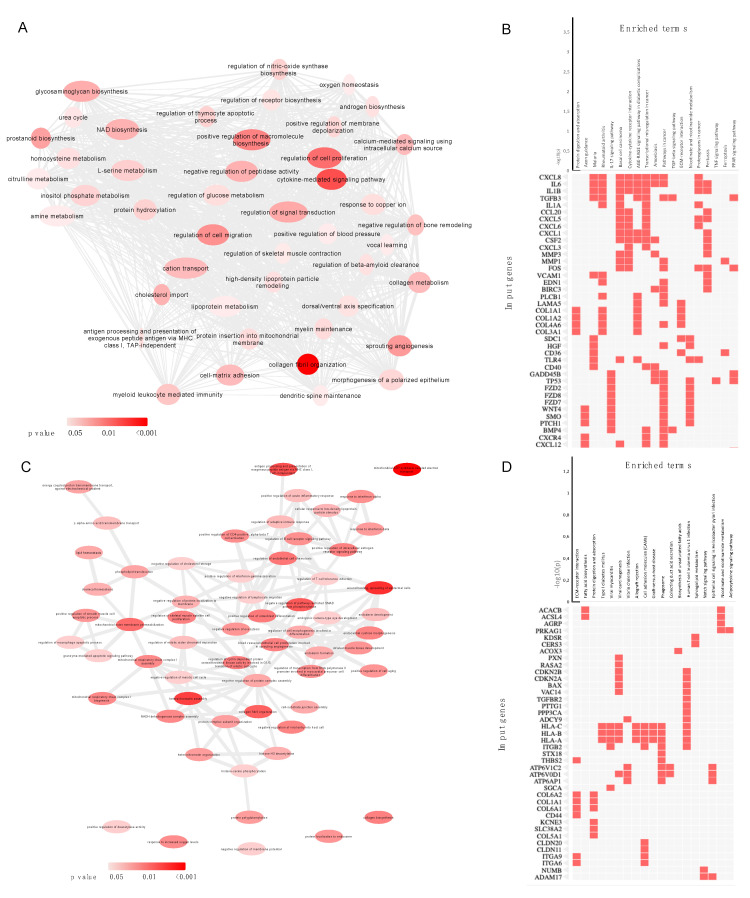
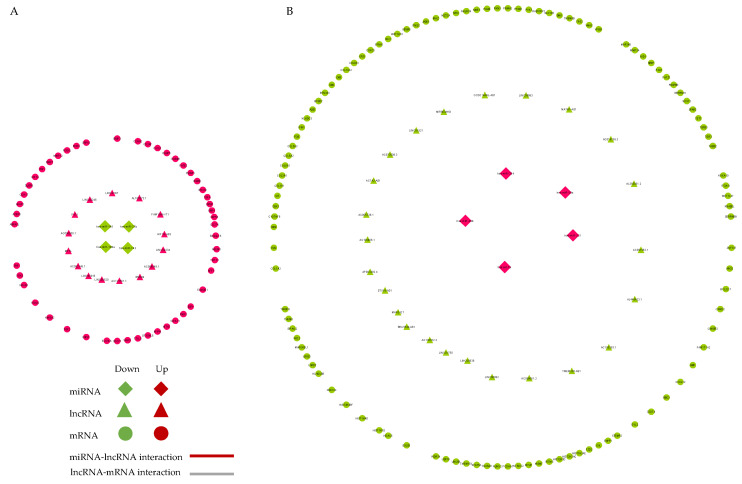
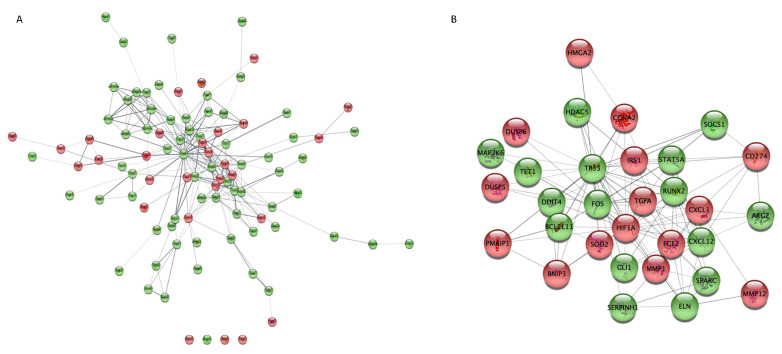
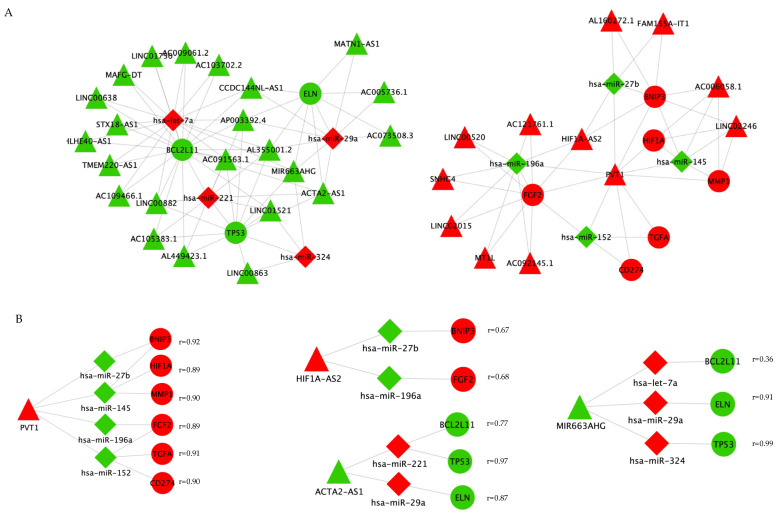
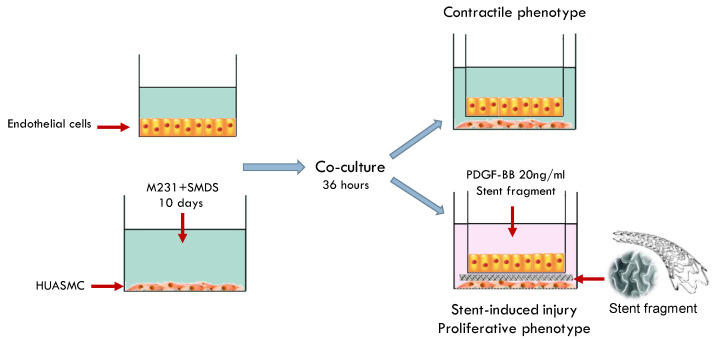
Coronary in-stent restenosis is a late complication of angioplasty. It is a multifactorial process that involves vascular smooth muscle cells (VSMCs), endothelial cells, and inflammatory and genetic factors. In this study, the transcriptomic landscape of VSMCs' phenotypic switch process was assessed under stimuli resembling stent injury. Co-cultured contractile VSMCs and endothelial cells were exposed to a bare metal stent and platelet-derived growth factor (PDGF-BB) 20 ng/mL. Migratory capacity (wound healing assay), proliferative capacity, and cell cycle analysis of the VSMCs were performed. RNAseq analysis of contractile vs. proliferative VSMCs was performed. Gene differential expression (DE), identification of new long non-coding RNA candidates (lncRNAs), gene ontology (GO), and pathway enrichment (KEGG) were analyzed. A competing endogenous RNA network was constructed, and significant lncRNA-miRNA-mRNA axes were selected. VSMCs exposed to "stent injury" conditions showed morphologic changes, with proliferative and migratory capacities progressing from G0-G1 cell cycle phase to S and G2-M. RNAseq analysis showed DE of 1099, 509 and 64 differentially expressed mRNAs, lncRNAs, and miRNAs, respectively. GO analysis of DE genes showed significant enrichment in collagen and extracellular matrix organization, regulation of smooth muscle cell proliferation, and collagen biosynthetic process. The main upregulated nodes in the lncRNA-mediated ceRNA network were PVT1 and HIF1-AS2, with downregulation of ACTA2-AS1 and MIR663AHG. The PVT1 ceRNA axis appears to be an attractive target for in-stent restenosis diagnosis and treatment.
Keywords: competing endogenous RNA; epigenetics; in vitro cellular model; in-stent restenosis; long non-coding RNA; post transcriptional regulation; transcriptomics.
Conflict of interest statement
The authors declare no conflict of interest.
Figures
Similar articles
-
Construction of competitive endogenous RNA network and identification of potential regulatory axis in vascular calcification.FASEB J. 2024 Oct 31;38(20):e70114. doi: 10.1096/fj.202400973RR. FASEB J. 2024. PMID: 39432302
-
Comprehensive Analysis of lncRNA Expression Pattern and lncRNA-miRNA-mRNA Network in a Rat Model With Cavernous Nerve Injury Erectile Dysfunction.J Sex Med. 2020 Sep;17(9):1603-1617. doi: 10.1016/j.jsxm.2020.05.008. Epub 2020 Jul 13. J Sex Med. 2020. PMID: 32675050
-
Excavating novel diagnostic and prognostic long non-coding RNAs (lncRNAs) for head and neck squamous cell carcinoma: an integrated bioinformatics analysis of competing endogenous RNAs (ceRNAs) and gene co-expression networks.Bioengineered. 2021 Dec;12(2):12821-12838. doi: 10.1080/21655979.2021.2003925. Bioengineered. 2021. PMID: 34898376 Free PMC article.
-
Non-coding RNAs in vascular remodeling and restenosis.Vascul Pharmacol. 2019 Mar;114:49-63. doi: 10.1016/j.vph.2018.10.006. Epub 2018 Oct 24. Vascul Pharmacol. 2019. PMID: 30368024 Review.
-
Long non-coding RNAs at the crossroad of vascular smooth muscle cell phenotypic modulation in atherosclerosis and neointimal formation.Atherosclerosis. 2023 Jun;374:34-43. doi: 10.1016/j.atherosclerosis.2022.11.021. Epub 2022 Dec 6. Atherosclerosis. 2023. PMID: 36513554 Review.
Cited by
-
Global trends and Frontier topics about vascular smooth muscle cells phenotype switch: A bibliometric analysis from 1999 to 2021.Front Pharmacol. 2022 Nov 14;13:1004525. doi: 10.3389/fphar.2022.1004525. eCollection 2022. Front Pharmacol. 2022. PMID: 36452231 Free PMC article.
-
Transcriptomics analysis of long non-coding RNAs in smooth muscle cells from patients with peripheral artery disease and diabetes mellitus.Sci Rep. 2024 Apr 14;14(1):8615. doi: 10.1038/s41598-024-59164-7. Sci Rep. 2024. PMID: 38616192 Free PMC article.
-
The synergistic effect of CDKN2B-AS1 and SPC25 on triple-negative breast cancer.Ann Transl Med. 2022 Jul;10(14):783. doi: 10.21037/atm-22-2900. Ann Transl Med. 2022. PMID: 35965791 Free PMC article.
References
MeSH terms
Substances
Grants and funding
LinkOut - more resources
Full Text Sources
Miscellaneous
