. 2022 Mar 12;23(6):3081.
doi: 10.3390/ijms23063081.

Blood Transcriptome Profiling Links Immunity to Disease Severity in Myotonic Dystrophy Type 1 (DM1)

Affiliations

Blood Transcriptome Profiling Links Immunity to Disease Severity in Myotonic Dystrophy Type 1 (DM1)

Sylvia Nieuwenhuis et al. Int J Mol Sci. .

Abstract

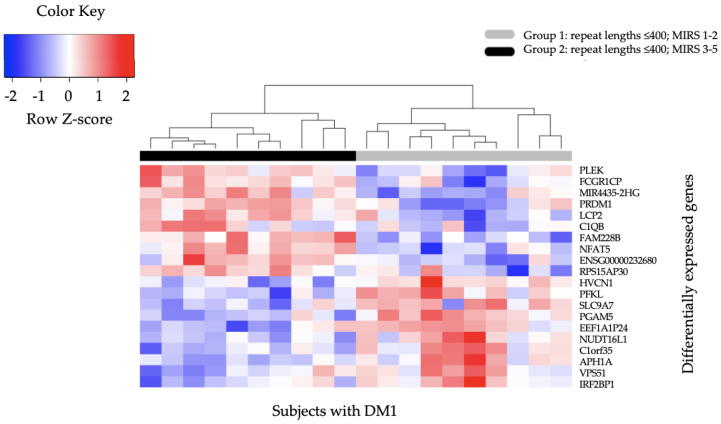
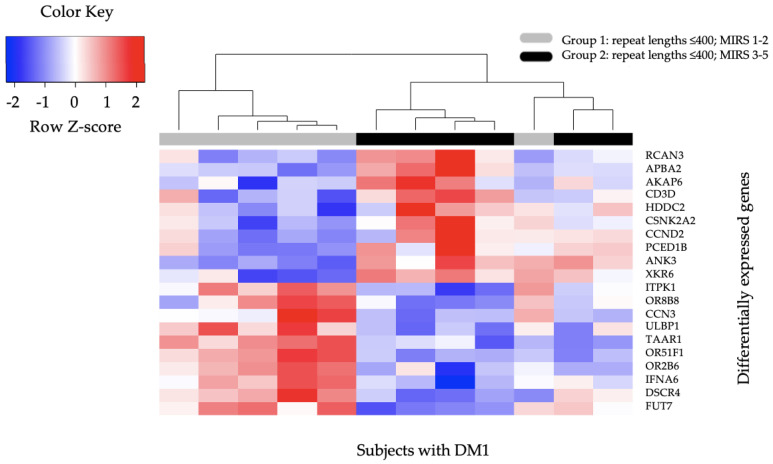
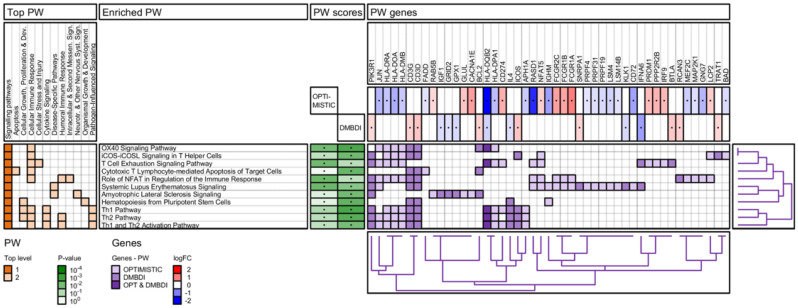
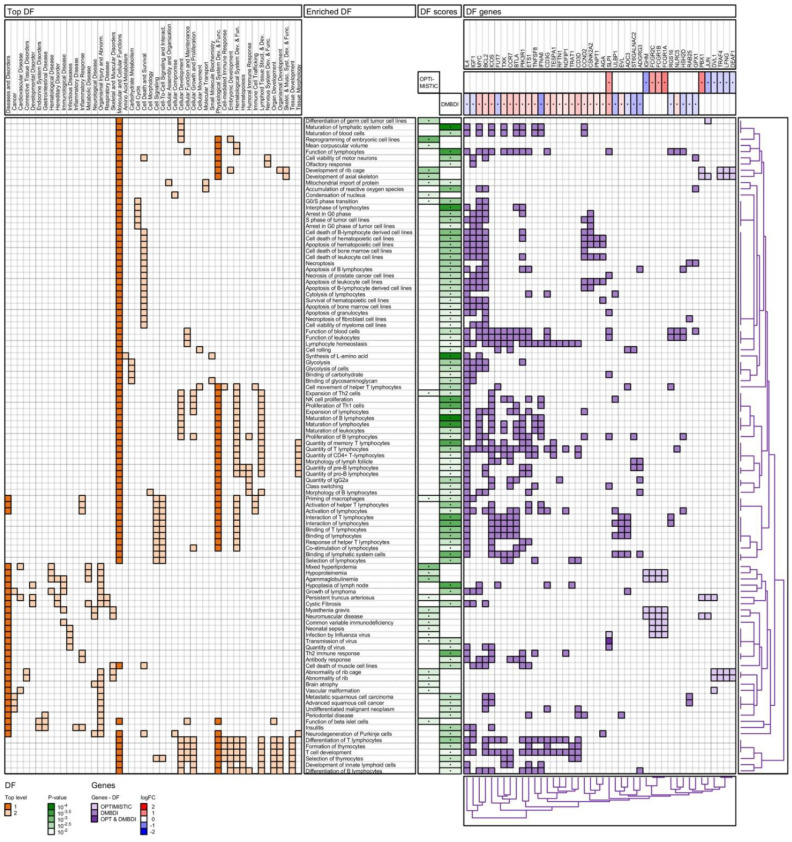
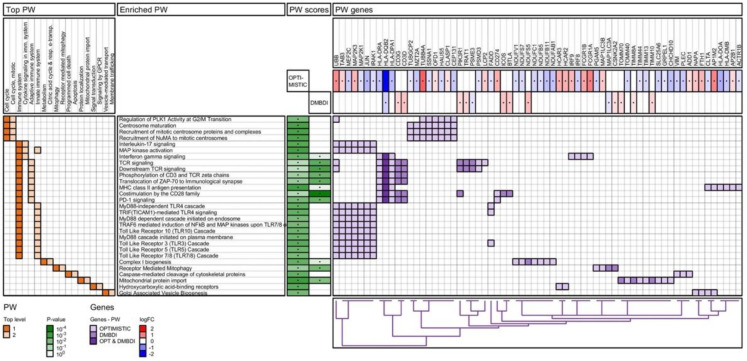
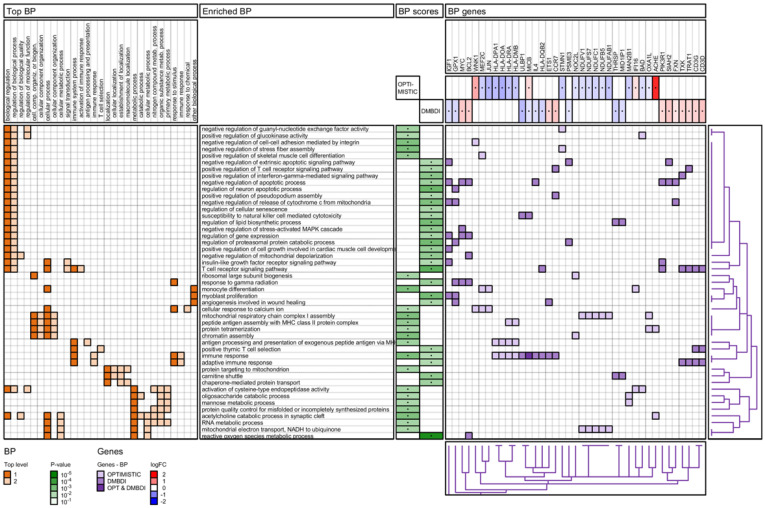
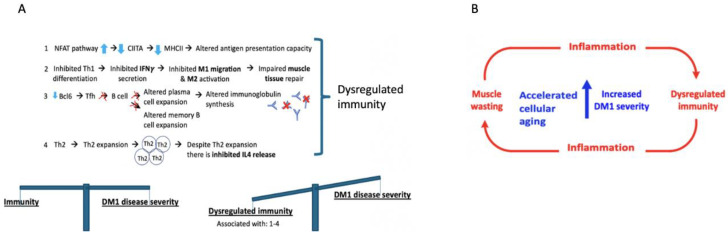
The blood transcriptome was examined in relation to disease severity in type I myotonic dystrophy (DM1) patients who participated in the Observational Prolonged Trial In DM1 to Improve QoL- Standards (OPTIMISTIC) study. This sought to (a) ascertain if transcriptome changes were associated with increasing disease severity, as measured by the muscle impairment rating scale (MIRS), and (b) establish if these changes in mRNA expression and associated biological pathways were also observed in the Dystrophia Myotonica Biomarker Discovery Initiative (DMBDI) microarray dataset in blood (with equivalent MIRS/DMPK repeat length). The changes in gene expression were compared using a number of complementary pathways, gene ontology and upstream regulator analyses, which suggested that symptom severity in DM1 was linked to transcriptomic alterations in innate and adaptive immunity associated with muscle-wasting. Future studies should explore the role of immunity in DM1 in more detail to assess its relevance to DM1.

Keywords: DM1 disease severity; RNA sequencing; blood; immunity; muscle impairment rating scale (MIRS); myotonic dystrophy type 1 (DM1); pathway analysis.


Conflict of interest statement

The authors declare that they have no conflict of interest except van Engelen. van Engelen reports grants from FP7 European Union grant OPTIMISTIC, grants from Marigold Canada, grants from Spieren voor Spieren, grants from the Prinses Beatrix Spierfonds, grants from the Dutch FSHD foundation, grants from the Netherlands Organisation for Scientific Research (NWO), grants from the Netherlands Organisation for Health Research and Development (ZonMw), grants from Association Francaise contre les Myopathies, and grants and personal fees from Fulcrum and Facio, outside the submitted work.

Figures

Figure 1
Figure 1
Hierarchical Clustering Heatmap of top 20 differentially expressed genes in DM1 OPTIMISTIC Group 1 and Group 2 patients. The heatmap presents the top 20 significant differentially expressed genes in subjects with DM1 from Group 2 (CTG repeat length ≤ 400, MIRS score 3–5) compared to Group 1 (CTG repeat length ≤ 400, MIRS score 1–2). Columns represent subjects with DM1, while rows represent specific genes of interest. The Z-score presents a measure of distance, in standard deviations, away from the mean. The color indicates the differentially expressed genes, with red indicating 10 higher expressed genes in Group 2 compared to Group 1 and with blue 10 lower expressed genes.
Figure 2
Figure 2
Hierarchical Clustering Heatmap of top 20 differentially expressed genes in DM1 DMBDI Group 1 and Group 2 patients. The heatmap presents the top 20 significant differentially expressed genes in subjects with DM1 from Group 2 (CTG repeat length ≤ 400, MIRS score 3–5) compared to Group 1 (CTG repeat length ≤ 400, MIRS score 1–2). Columns represent subjects with DM1, while rows represent specific genes of interest. The Z-score presents a measure of distance, in standard deviations, away from the mean. The color indicates the differentially expressed genes, with red indicating 10 higher expressed genes in Group 2 compared to Group 1 and with blue 10 lower expressed genes.
Figure 3
Figure 3
IPA pathway (PW) enrichment analysis of OPTIMISTIC and DMBDI genes. For explanation see Section 2.4.
Figure 4
Figure 4
IPA diseases and functions (DF) enrichment analysis of OPTIMISTIC and DMBDI genes. For explanation see Section 2.4.
Figure 5
Figure 5
Reactome pathway (PW) enrichment analysis of OPTIMISTIC and DMBDI genes. For explanation see Section 2.4.
Figure 6
Figure 6
GO biological process (BP) enrichment analysis of OPTIMISTIC and DMBDI genes. For explanation see Section 2.4.
Figure 7
Figure 7
Causal Network analysis of interacting master upstream regulators based on differentially expressed genes in the OPTIMISTIC and DMBDI datasets. Causal networks of “significant” master regulators and their target genes are shown for (A) OPTIMISTIC and (B) DMBDI datasets.
Figure 8
Figure 8
(A) A hypothetical framework (based on pilot data presented here) highlights four key immune processes which are possibly dysregulated. 1; higher expression of the NFAT pathway results in impaired antigen presentation capacity, through lowered CIITA and MHCII gene expression. 2; impaired Th1 differentiation which may lead to diminished IFNγ release, which normally controls macrophage subtype 1 (M1) migration and M2 activation which guide muscle tissue repair [37]. 3; diminished follicular helper T (Tfh) cell differentiation resulting in altered B memory cell expansion and altered plasma B cell expansion which may result in less antibody synthesis [38]. 4; Th2 expansion coupled with lowered IL4 expression with increased DM1 severity. Together these affected pathways may result in dysregulated immunity resulting in a more severe DM1 phenotype. (B) Schematic representation of the concept that increased DM1 severity is associated with accelerated cellular aging, muscle-wasting, and dysregulation of immunity.

References

    1. Kornblum C., Lutterbey G., Bogdanow M., Kesper K., Schild H., Schroder R., Wattjes M.P. Distinct neuromuscular phenotypes in myotonic dystrophy types 1 and 2: A whole body highfield MRI study. J. Neurol. 2006;253:753–761. doi: 10.1007/s00415-006-0111-5. - DOI - PubMed
    1. Bhakta D., Shen C., Kron J., Epstein A.E., Pascuzzi R.M., Groh W.J. Pacemaker and implantable cardioverter-defibrillator use in a US myotonic dystrophy type 1 population. J. Cardiovasc. Electrophysiol. 2011;22:1369–1375. doi: 10.1111/j.1540-8167.2011.02200.x. - DOI - PubMed
    1. Bellini M., Biagi S., Stasi C., Costa F., Mumolo M.G., Ricchiuti A., Marchi S. Gastrointestinal manifestations in myotonic muscular dystrophy. World J. Gastroenterol. 2006;12:1821–1828. doi: 10.3748/wjg.v12.i12.1821. - DOI - PMC - PubMed
    1. Bird T.D. Myotonic Dystrophy Type 1. In: Pagon R.A., Adam M.P., Ardinger H.H., Wallace S.E., Amemiya A., Bean L.J.H., Bird T.D., Ledbetter N., Mefford H.C., Smith R.J.H., et al., editors. GeneReviews(R) University of Washington; Seattle, WA, USA: 1993. - PubMed
    1. Meola G., Cardani R. Myotonic dystrophies: An update on clinical aspects, genetic, pathology, and molecular pathomechanisms. Biochim. Biophys. Acta. 2015;1852:594–606. doi: 10.1016/j.bbadis.2014.05.019. - DOI - PubMed

LinkOut - more resources