. 2022 Mar 13;23(6):3091.
doi: 10.3390/ijms23063091.

Helicobacter pylori Urease: Potential Contributions to Alzheimer's Disease

Affiliations

Helicobacter pylori Urease: Potential Contributions to Alzheimer's Disease

Augusto F Uberti et al. Int J Mol Sci. .

Abstract

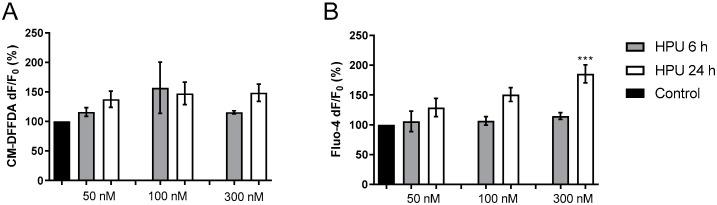
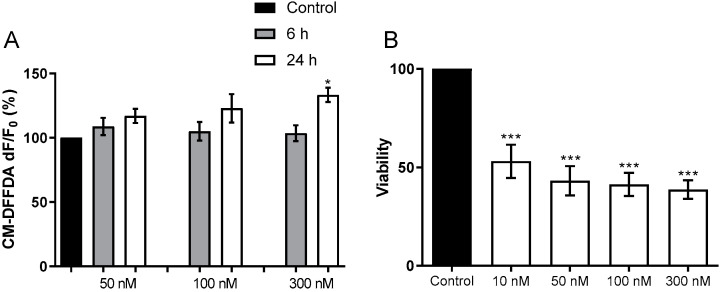
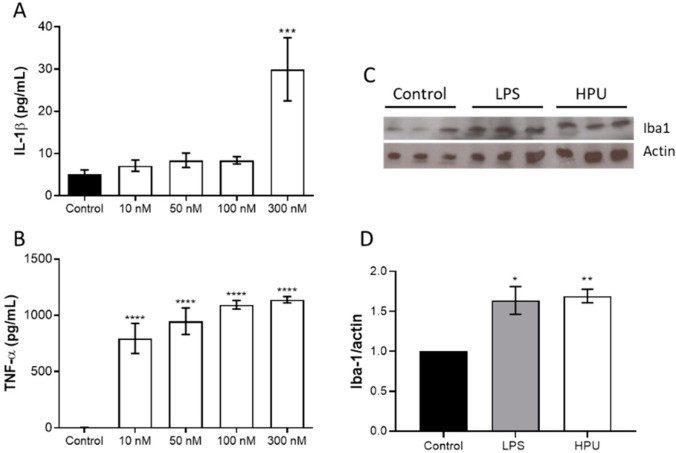
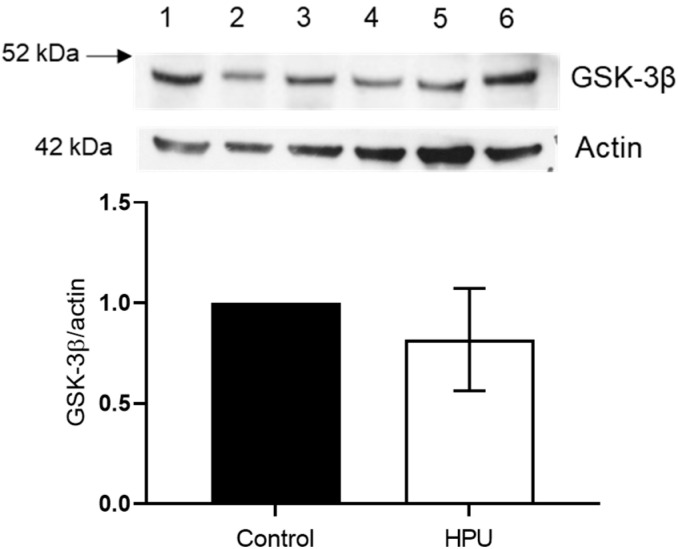
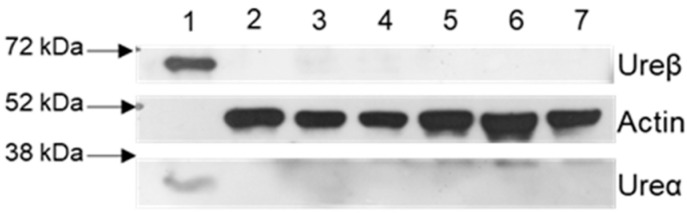
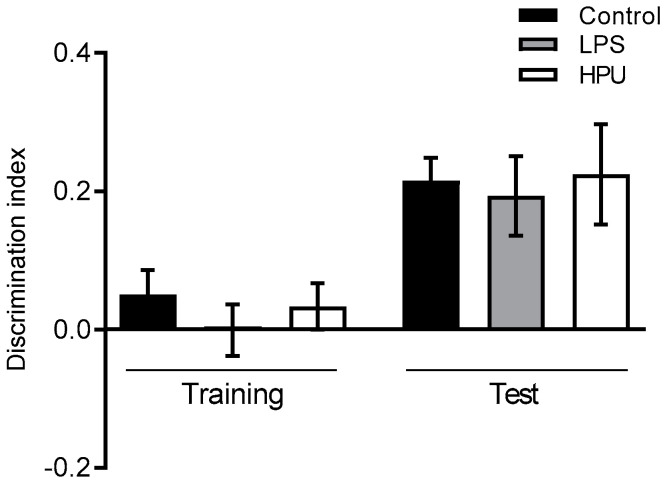
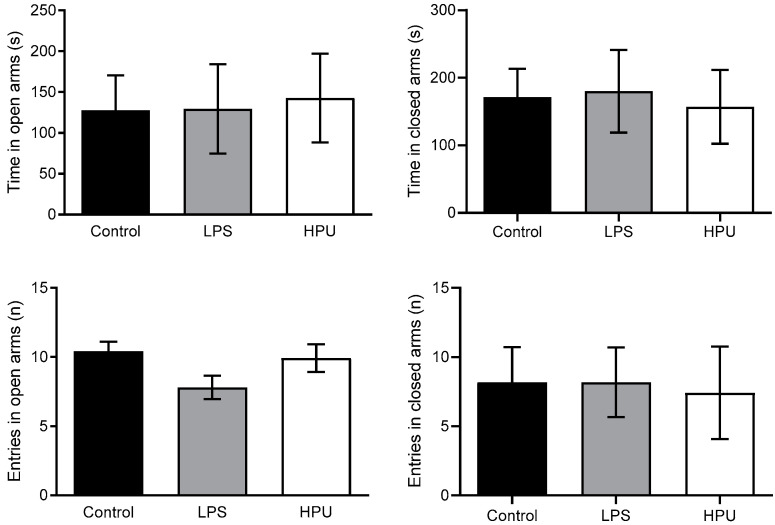
Alzheimer's disease (AD) causes dementia and memory loss in the elderly. Deposits of beta-amyloid peptide and hyperphosphorylated tau protein are present in a brain with AD. A filtrate of Helicobacter pylori's culture was previously found to induce hyperphosphorylation of tau in vivo, suggesting that bacterial exotoxins could permeate the blood-brain barrier and directly induce tau's phosphorylation. H. pylori, which infects ~60% of the world population and causes gastritis and gastric cancer, produces a pro-inflammatory urease (HPU). Here, the neurotoxic potential of HPU was investigated in cultured cells and in rats. SH-SY5Y neuroblastoma cells exposed to HPU (50-300 nM) produced reactive oxygen species (ROS) and had an increased [Ca2+]i. HPU-treated BV-2 microglial cells produced ROS, cytokines IL-1β and TNF-α, and showed reduced viability. Rats received daily i.p., HPU (5 µg) for 7 days. Hyperphosphorylation of tau at Ser199, Thr205 and Ser396 sites, with no alterations in total tau or GSK-3β levels, and overexpression of Iba1, a marker of microglial activation, were seen in hippocampal homogenates. HPU was not detected in the brain homogenates. Behavioral tests were performed to assess cognitive impairments. Our findings support previous data suggesting an association between infection by H. pylori and tauopathies such as AD, possibly mediated by its urease.

Keywords: BV-2 microglia; Helicobacter pylori; SH-SY5Y neuroblastoma cells; elevated plus maze; neuroinflammation; object recognition test; pro-inflammatory cytokines; tau hyperphosphorylation; urease.


Conflict of interest statement

The authors declare no conflict of interest.

Figures

Figure 1
Figure 1
Toxicity of HPU to SH-SY5Y cells. (A). Undifferentiated SH-SY5Y cells were incubated with a CM-DFFDA (2 mM) probe for 30 min, 37 °C, in the dark. Cells were treated for 6 h (gray columns) and 24 h (white columns) with 20 mM NaPB (control) or 50, 100 or 300 nM HPU. Fluorescence was measured at λex 495 nm/λem 527 nm. The results are expressed as a percentage of the control ± SEM and compared by one-way ANOVA followed by the Tukey test. (B). For calcium measurement, undifferentiated SH-SY5Y cells were incubated with a Fluo-4AM probe (5 μM, in 20 mM NaPB) for 45 min, 37 °C, in the dark. The treatment with 50, 100 or 300 nM HPU lasted for 6 h (gray columns) or 24 h (white columns). Controls with 20 mM NaPB (6 and 24 h) were considered 100%. Fluorescence was measured at λex 488 nm/λem 530 nm. The results were expressed as a percentage of the control ± SEM and compared by one-way ANOVA followed by the Tukey test. *** p < 0.001 vs. control.
Figure 2
Figure 2
Toxicity of HPU to BV-2 cells (A) For ROS detection, BV-2 cells were incubated CM-DFFDA (2 mM) probe for 30 min, 37 °C, in the dark. After washing, BV-2 cells were incubated with 20 mM NaPB (control), or 50, 100 or 300 nM HPU for 6 h (gray columns) or 24 h (white columns). Fluorescence was measured at λex495 nm/λem527 nm. The results were expressed as a percentage of the control ± SEM and compared by one-way ANOVA followed by the Tukey test. * p < 0.05 vs. controls. (B) BV-2 viability was analyzed by the MTT test after 24 h of exposure to HPU. The cultures’ supernatants were removed after the treatments and cells were incubated with MTT (5 mg/mL) for 4 h at 37 °C, then suspended in 100 µL DMSO. Absorbances were read at 570 nm. Mean ± SEM. *** p < 0.001 vs. control.
Figure 3
Figure 3
Microglial activation by HPU. For detection of cytokine expression, BV-2 cells were incubated for 6 h with HPU, and cultures’ supernatants were collected for detection of IL-1β panel (A) and TNF-α panel (B) by ELISA. The data (mean ± SEM) were analyzed by one-way parametric ANOVA with a Dunnett post-test. *** p < 0.001, **** p < 0.0001 vs. control. Panels (C,D): Iba1 levels in brain homogenates of HPU-treated rats were analyzed by Western blots (C), and quantified by densitometry (D). The data (mean ± SEM) were analyzed by one-way ANOVA followed by Bonferroni post hoc test. * p < 0.05, ** p < 0.01 vs. controls. All data were normalized against the endogenous actin content.
Figure 4
Figure 4
Quantification of total and phosphorylated tau protein in hippocampal homogenates of HPU-treated rats. Male 30-day-old Wistar rats received i.p. injections of HPU (5 µg/rat/day), LPS (1 mg/kg/rat/day), or sterile PBS for 7 days. Western blot assays were performed with hippocampal homogenates of animals from three independent experiments, each composed of groups with 4 animals each. Tissue brain homogenates were analyzed for total, panel (A) and phosphorylated tau at sites Ser199, panel (B), Thr205, panel (C) and Ser396, panel (D). The levels of tau protein were normalized by that of actin. The figure depicts representative blots and their densitometric analysis. Data are expressed as mean ± SD and analyzed by one-way ANOVA followed by Bonferroni post hoc test. * p < 0.05, ** p < 0.01, **** p < 0.0001 vs. controls.
Figure 5
Figure 5
Quantification of GSK-3β kinase levels. Male Wistar rats received i.p. injections of HPU for 7 days (5 µg/rat/day), and the same volume of sterile saline was administered to the control group. Western blotting assays were performed with hippocampal homogenates of animals from three independent experiments (G1, G2, G3), each composed of a treated group and a control group (n = 4). Controls (lanes 1, 3 and 5) and HPU-treated (lanes 2, 4 and 6) homogenates were analyzed for GSK-3β and actin protein levels. The figure shows a representative blot and its densitometric analysis. Data are expressed as mean ± SD and analyzed by one-way ANOVA followed by Bonferroni post hoc test.
Figure 6
Figure 6
Blood–brain barrier integrity of rats treated with HPU. Male Wistar rats received i.p. injections of HPU for 7 days (5 µg/rat/day), and the same volume of sterile saline was administered to the control groups. Hippocampal homogenates from three independent experiments (G1, G2, G3), each composed of a treated group and a control group (N = 4), were analyzed by Western blot assays using antibodies against HPU subunit B (ureβ) and subunit A (urea) (60 kDa and 30 kDa, respectively). The figure illustrates a typical blot, with controls in lanes 2, 4 and 6, and HPU-treated groups shown in lanes 3, 5 and 7. Purified HPU protein (25 µg) is seen in lane 1.
Figure 7
Figure 7
Effect of HPU on memory consolidation. Male Wistar rats received i.p., injections of HPU (5 µg/rat/day), LPS (1 mg/kg/rat/day, positive control) or saline (negative control) for 7 days. Discrimination indexes in the test phase were analyzed by one-way ANOVA followed by Bonferroni’s multiple comparison test. Data expressed as median ± SEM. n = 10 rats/group.
Figure 8
Figure 8
Elevated plus maze performance of HPU-treated rats. Male Wistar rats received i.p., injections of HPU (5 µg/rat/day), LPS (1 mg/kg/rat/day, positive control) or saline (negative control) for 7 days. Entries to open and closed arms of the elevated maze and time spent in each arm were measured. Data were analyzed by one-way ANOVA followed by Bonferroni’s multiple comparison test. Data expressed as median ± SEM. n = 10 rats/group.

References

    1. Doulberis M., Kotronis G., Thomann R., Polyzos S., Boziki M., Gialamprinou D., Deretzi G., Katsinelos P., Kountouras J. Review: Impact of Helicobacter pylori on Alzheimer’s disease: What do we know so far? Helicobacter. 2018;23:e12454. doi: 10.1111/hel.12454. - DOI - PubMed
    1. Hooi J.K., Lai W.Y., Ng W.K., Suen M.M., Underwood F.E., Tanyingoh D., Malfertheiner P., Graham D.Y., Wong V.W., Wu J.C., et al. Global Prevalence of Helicobacter pylori Infection: Systematic Review and Meta-Analysis. Gastroenterology. 2017;153:420–429. doi: 10.1053/j.gastro.2017.04.022. - DOI - PubMed
    1. Wang A.Y., Peura D.A. The prevalence and incidence of Helicobacter pylori-associated peptic ulcer disease and upper gastrointestinal bleeding throughout the world. Gastrointest. Endosc. Clin. 2011;21:613–635. doi: 10.1016/j.giec.2011.07.011. - DOI - PubMed
    1. Ernst P.B., Gold B.D. The disease spectrum of Helicobacter pylori: The immunopathogenesis of gastroduodenal ulcer and gastric cancer. Annu. Rev. Microbiol. 2000;54:615–640. doi: 10.1146/annurev.micro.54.1.615. - DOI - PubMed
    1. Franceschi F., Covino M., Roubaud Baudron C. Review: Helicobacter pylori and extragastric diseases. Helicobacter. 2019;24((Suppl. S1)):e12636. doi: 10.1111/hel.12636. - DOI - PubMed