. 2022 Mar 14;23(6):3109.
doi: 10.3390/ijms23063109.

Structural Consequence of Non-Synonymous Single-Nucleotide Variants in the N-Terminal Domain of LIS1

Affiliations

Structural Consequence of Non-Synonymous Single-Nucleotide Variants in the N-Terminal Domain of LIS1

Ho Jin Choi et al. Int J Mol Sci. .

Abstract

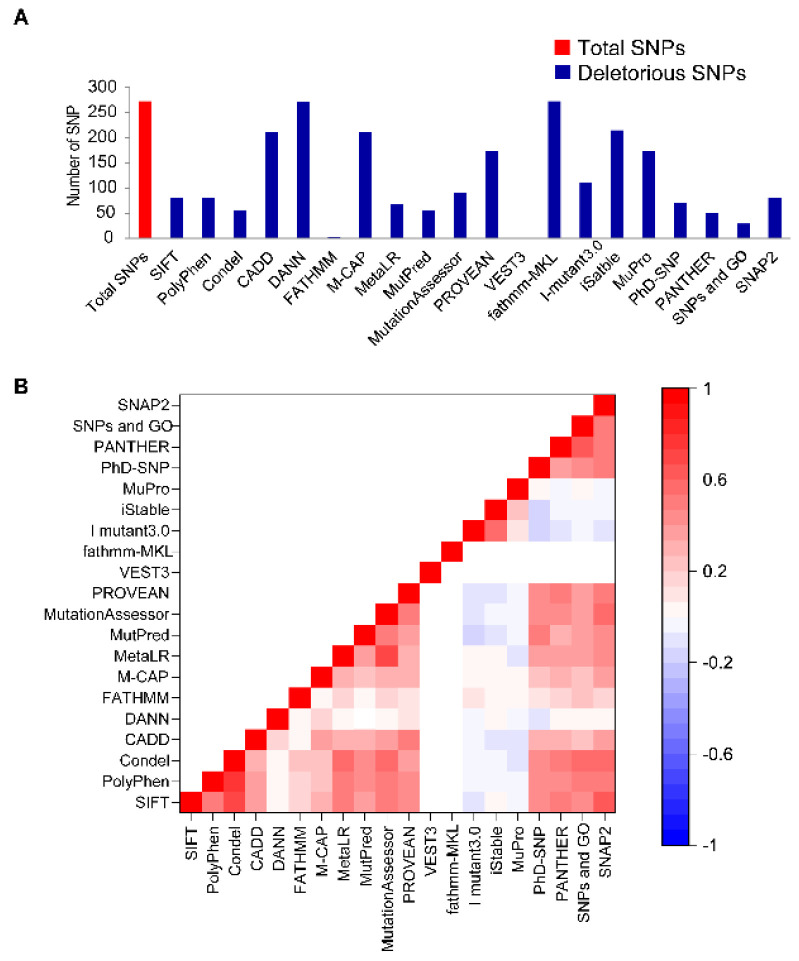
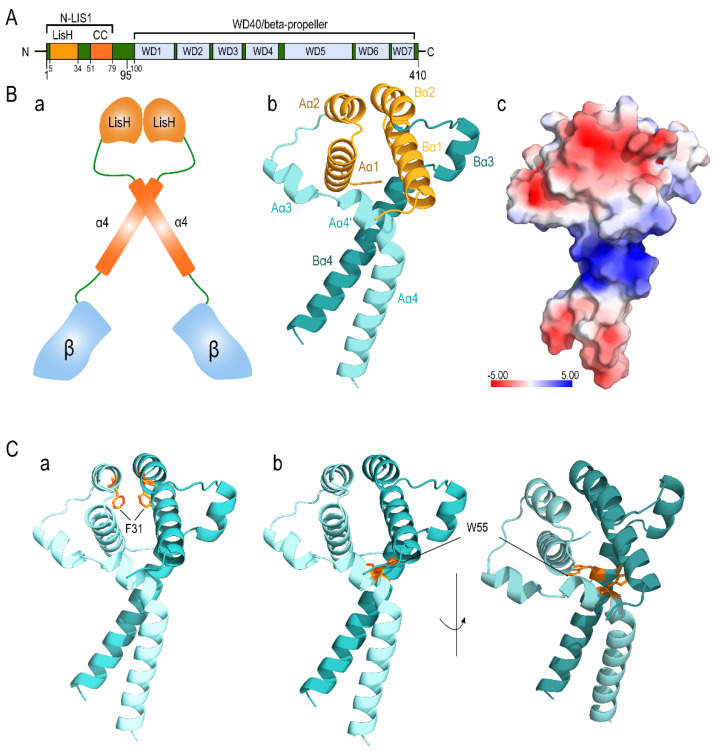
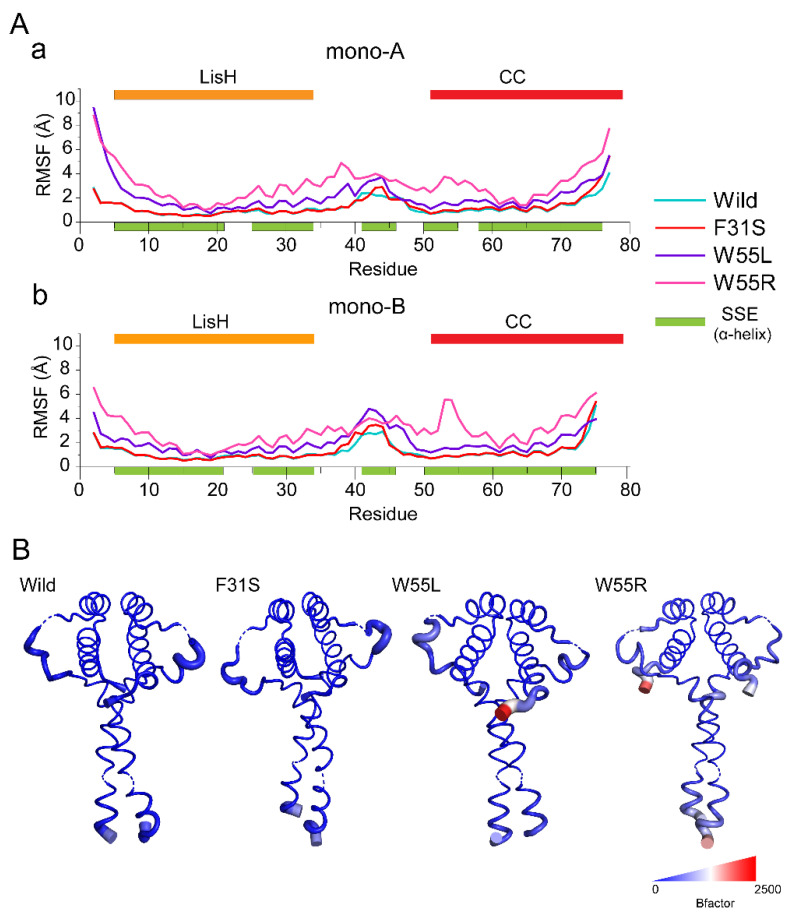
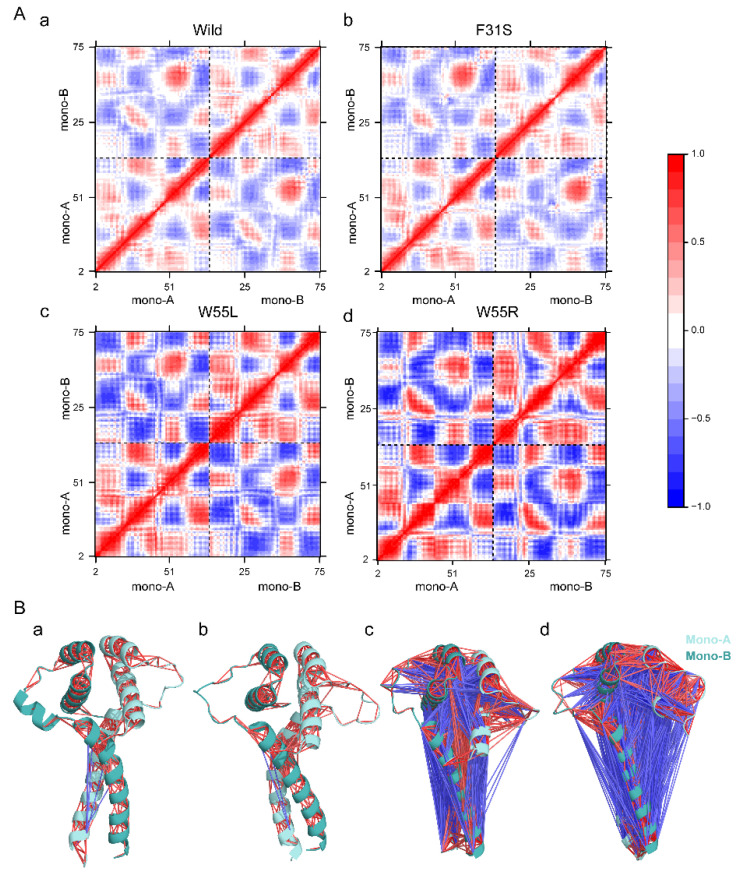
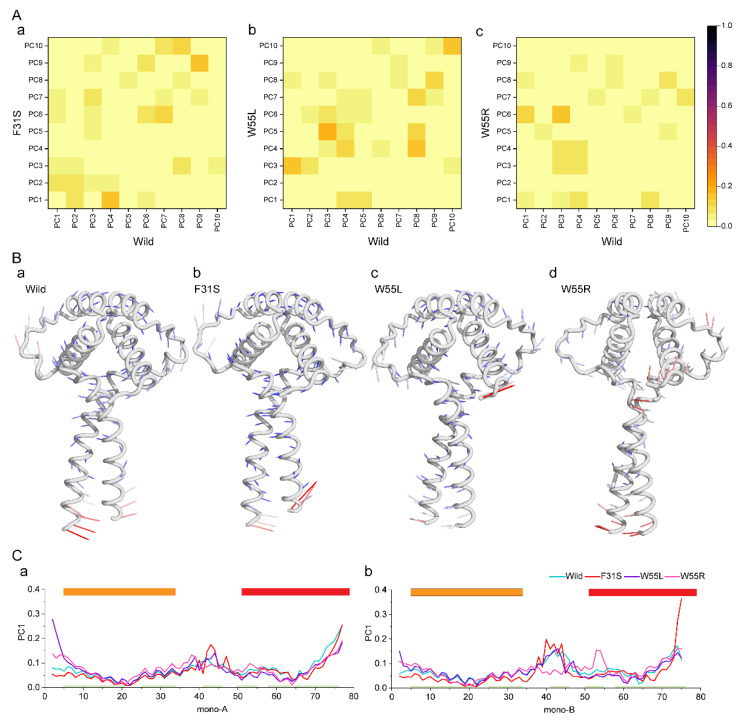
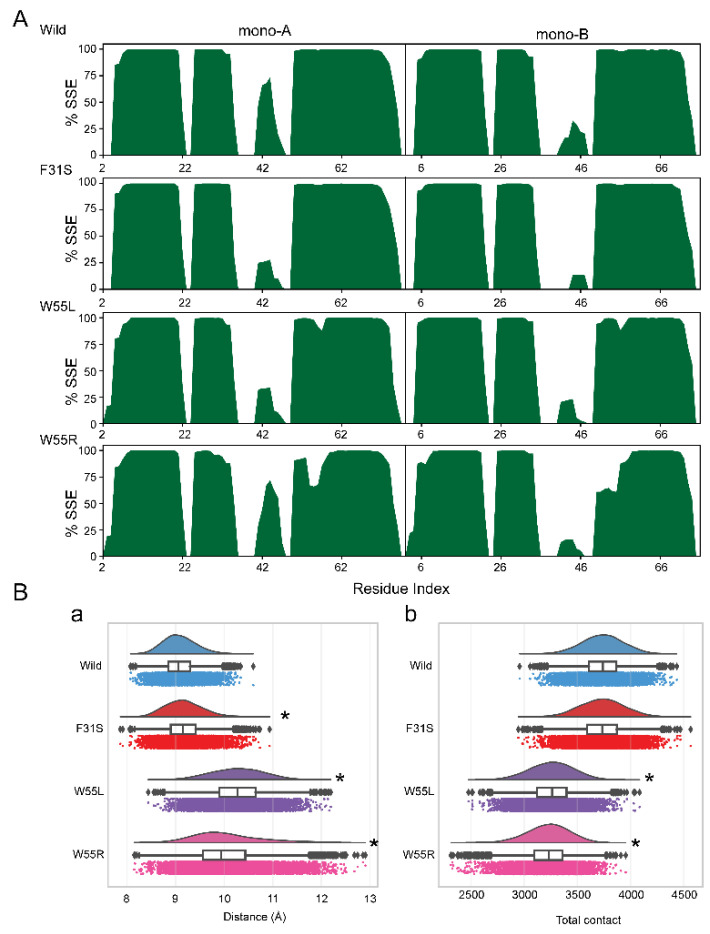
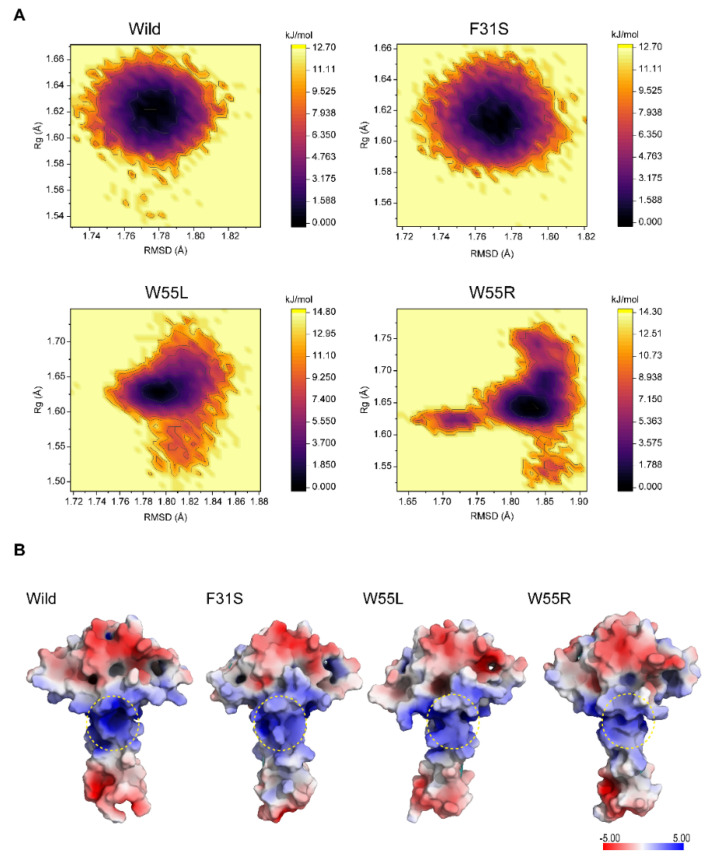
Disruptive neuronal migration during early brain development causes severe brain malformation. Characterized by mislocalization of cortical neurons, this condition is a result of the loss of function of migration regulating genes. One known neuronal migration disorder is lissencephaly (LIS), which is caused by deletions or mutations of the LIS1 (PAFAH1B1) gene that has been implicated in regulating the microtubule motor protein cytoplasmic dynein. Although this class of diseases has recently received considerable attention, the roles of non-synonymous polymorphisms (nsSNPs) in LIS1 on lissencephaly progression remain elusive. Therefore, the present study employed combined bioinformatics and molecular modeling approach to identify potential damaging nsSNPs in the LIS1 gene and provide atomic insight into their roles in LIS1 loss of function. Using this approach, we identified three high-risk nsSNPs, including rs121434486 (F31S), rs587784254 (W55R), and rs757993270 (W55L) in the LIS1 gene, which are located on the N-terminal domain of LIS1. Molecular dynamics simulation highlighted that all variants decreased helical conformation, increased the intermonomeric distance, and thus disrupted intermonomeric contacts in the LIS1 dimer. Furthermore, the presence of variants also caused a loss of positive electrostatic potential and reduced dimer binding potential. Since self-dimerization is an essential aspect of LIS1 to recruit interacting partners, thus these variants are associated with the loss of LIS1 functions. As a corollary, these findings may further provide critical insights on the roles of LIS1 variants in brain malformation.

Keywords: LIS1; lissencephaly; molecular dynamics simulation; single nucleotide polymorphisms; variant.


Conflict of interest statement

The authors declare no conflict of interest.

Figures

Figure 1
Figure 1
Different computational tools screen and predict deleterious non-synonymous SNPs (nsSNPs) in the LIS1 gene. (A) The bar plot represented a total number of damaging nsSNPs and (B) the pairwise correlation expressed by Heatmap illustration color-coded map (red, white, and blue stand for positive, neutral, and negative correlation, respectively) in the LIS1 gene by various state-of-the-art algorithms.
Figure 2
Figure 2
Domain mapping and the position of SNPs in the molecular structure of LIS1. (A) Domain mapping highlights the structural feature of LIS1. (B) Schematic depiction of LIS1 structure with domains color-coded according to panel A (a). Three-dimensional model of the LIS1 N-terminal region highlighting the LisH domain in orange (b). The electrostatic surface potential of the LIS1 N-terminal structure was obtained by using the APBS plugin of Pymol 2.5.2. The color scale is represented in kT/e (c). (C) The detected SNPs in the three-dimensional structure of wild-type LIS1 N-terminal domain are shown by the orange stick for F31 (a) and W55 (b), respectively.
Figure 3
Figure 3
Variant containing structure shows different residual flexibilities during simulation. (A) Differences in residual flexibilities are represented by Cα-root mean square fluctuation (RMSF) plot for both monomer A (a) and B (b). The color bar that is highlighted by specific color reflects helix propensity and domain arrangement as in Figure 2. (B) Structural comparison showing the variations as B-factor coloration and thickness, which were calculated from RMSF. The coloring was created using a blue-white-red spectrum with values ranging from 0 to 2500. The thickness of the tube also determines fluctuation, where a more major fluctuation corresponds to a thick tube.
Figure 4
Figure 4
Variants containing LIS1 structures reflect changes in correlated motion. (A) The dynamic cross-correlation matrix (DCCM) figure depicts the anticorrelated and correlated movements of each pair of residues in the structure, wild (a), F31S (b), W55L (c), and W55R (d). A perfect correlated motion is shown by red (+1), whereas an anticorrelated motion is marked by blue (−1). (B) DCCM representation in LIS1 structural view, where lines denote the correlation between two residues. wild (a), F31S (b), W55L (c), and W55R (d). A blue line was drawn in anticorrelated movements (−6 to −1), while a red line represents a positive correlation (6 to 1). The intensity of the line color reflects the degree of the association.
Figure 5
Figure 5
Variations in protein dynamics were revealed by using principal component analysis. (A) To demonstrate the similarity and difference among the conformational spaces of wild and variations (F31S (a), W55L (b), and W55R (c)) including structures, the root-mean-square inner product (RMSIP) values of the first PC were counted and plotted as a gradient heat map from yellow to dark red to represent low and high values. (B) Porcupine plots were used to show the contributing motions in the first PC for wild (a), F31S (b), W55L (c), and W55R (d), respectively. (C) Line plot showing the degree of mobility captured in PC1 for monomer A (a) and B (b).
Figure 6
Figure 6
Changes of secondary structural elements and dimer stability. (A) The occupancy of the helix structure was estimated as a fraction of a percentage for wild and all variants. (B) Raincloud plot [54] shows the distribution and average distance between the centers of mass of monomers (a) and total intermonomeric contact (b) for all variants and wild-type structures. Annotation p-values indicates significant (* p < 0.01) in comparison to wild-type.
Figure 7
Figure 7
Variants containing structure showed a difference in the positive electrostatic potential in LIS1 structure. (A) Free energy landscapes were generated using RMSD and Rg as a reaction coordinate to find energy minimum for wild, F31S, W55L, and W55R, respectively. A color-coded map illustrates the energy state of the protein conformer, with dark purple color indicating a lower energy minimum and yellow indicating a high state. (B) The positive electrostatic potential near the dimerization site had been displayed as a surface map for the wild-type and all variants representative structure as determined by the free energy landscape (FEL). A deeper blue zone denotes more electropositive area (>5 kT/e), whereas a red region shows a negative area (−5 kT/e), and a yellow dotted line shows the dimerization site.

Similar articles

Cited by

References

    1. Reiner O., Carrozzo R., Shen Y., Wehnert M., Faustinella F., Dobyns W.B., Caskey C.T., Ledbetter D.H. Isolation of a Miller-Dieker lissencephaly gene containing G protein beta-subunit-like repeats. Nature. 1993;364:717–721. doi: 10.1038/364717a0. - DOI - PubMed
    1. Haverfield E.V., Whited A.J., Petras K.S., Dobyns W.B., Das S. Intragenic deletions and duplications of the LIS1 and DCX genes: A major disease-causing mechanism in lissencephaly and subcortical band heterotopia. Eur. J. Hum. Genet. 2008;17:911–918. doi: 10.1038/ejhg.2008.213. - DOI - PMC - PubMed
    1. Wynshaw-Boris A. Lissencephaly and LIS1: Insights into the molecular mechanisms of neuronal migration and development. Clin. Genet. 2007;72:296–304. doi: 10.1111/j.1399-0004.2007.00888.x. - DOI - PubMed
    1. Reiner O., Cahana A., Escamez T., Martinez S. LIS1-no more no less. Mol. Psychiatry. 2002;7:12–16. doi: 10.1038/sj.mp.4000975. - DOI - PubMed
    1. Hattori M., Adachi H., Tsujimoto M., Arai H., Inoue K. Miller-Dieker lissencephaly gene encodes a subunit of brain platelet-activating factor acetylhydrolase [corrected] Nature. 1994;370:216–218. doi: 10.1038/370216a0. - DOI - PubMed

MeSH terms

Substances