. 2022 Mar 14;23(6):3118.
doi: 10.3390/ijms23063118.

Kappa-Opioid Receptor Blockade Ameliorates Obesity Caused by Estrogen Withdrawal via Promotion of Energy Expenditure through mTOR Pathway

Affiliations

Kappa-Opioid Receptor Blockade Ameliorates Obesity Caused by Estrogen Withdrawal via Promotion of Energy Expenditure through mTOR Pathway

Amparo Romero-Picó et al. Int J Mol Sci. .

Abstract

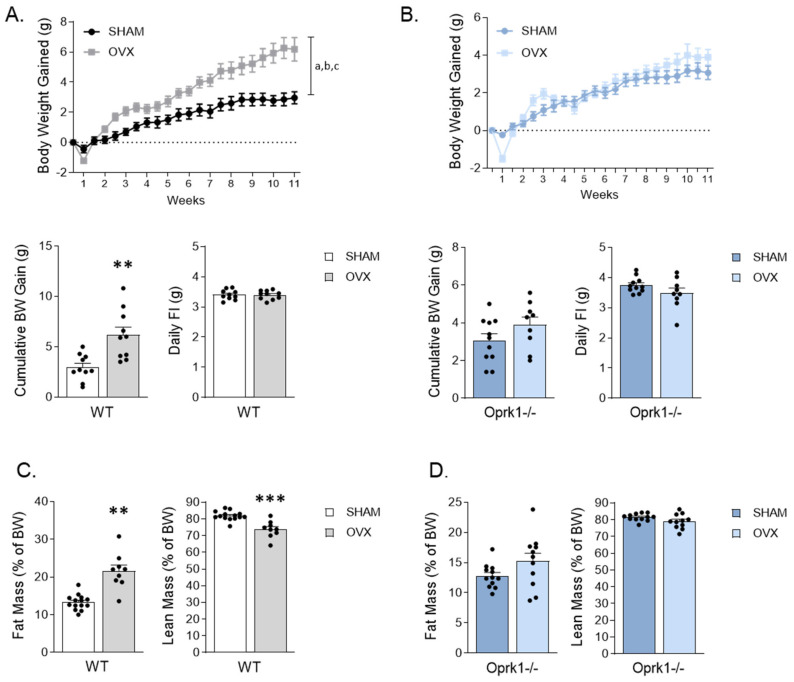
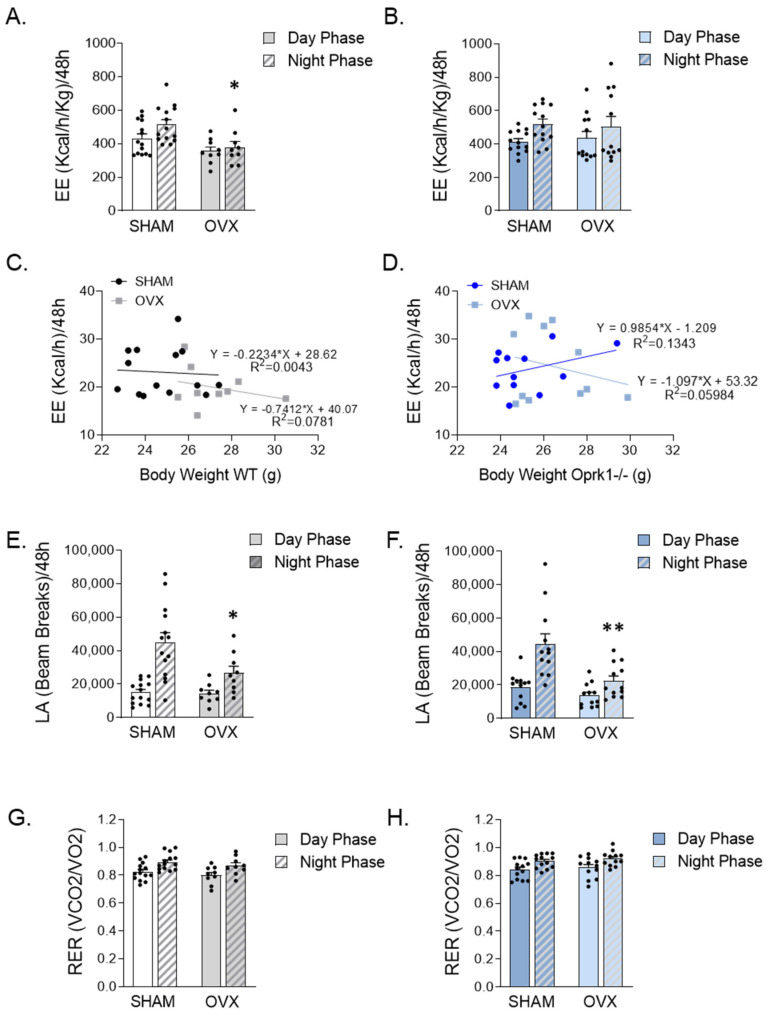
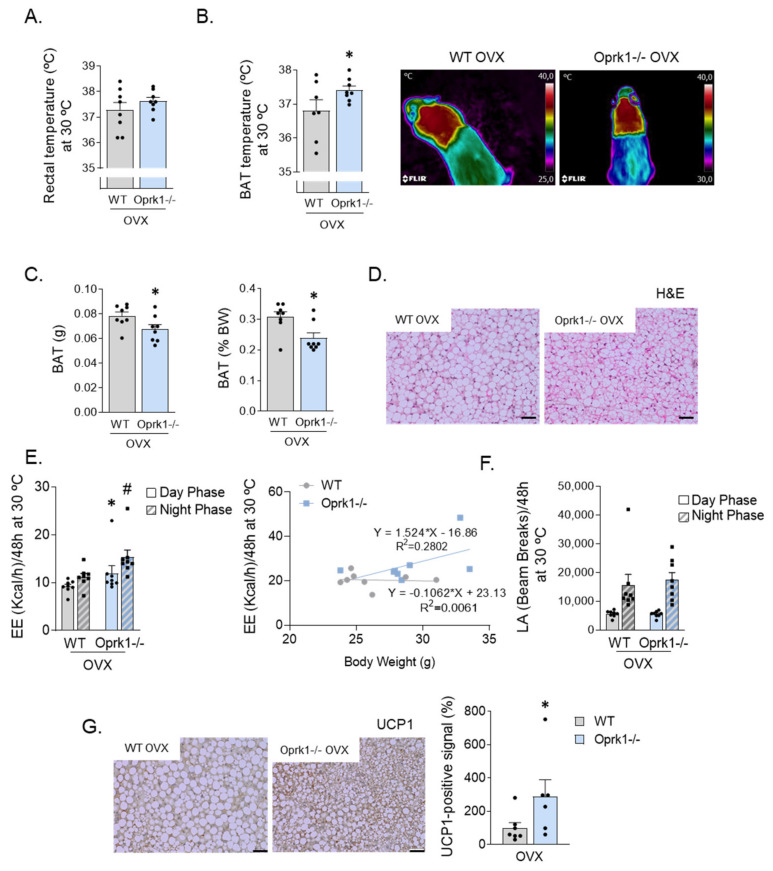
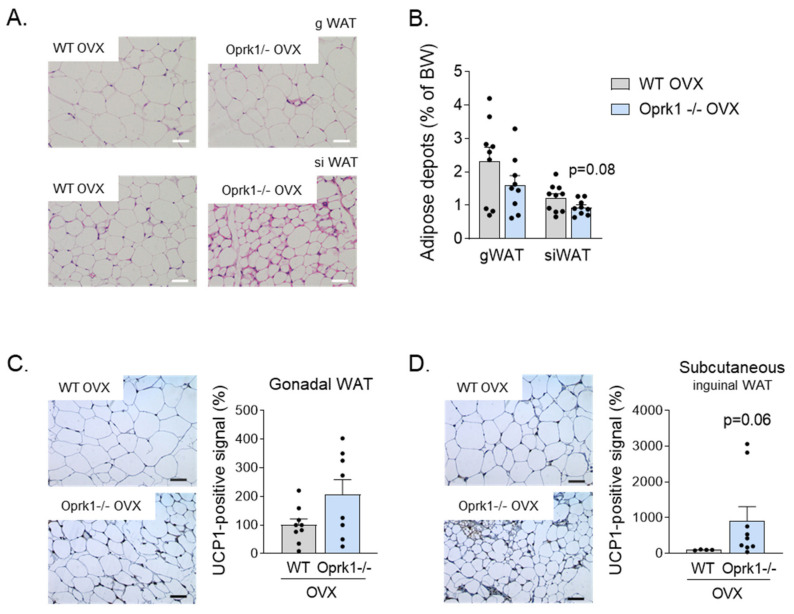
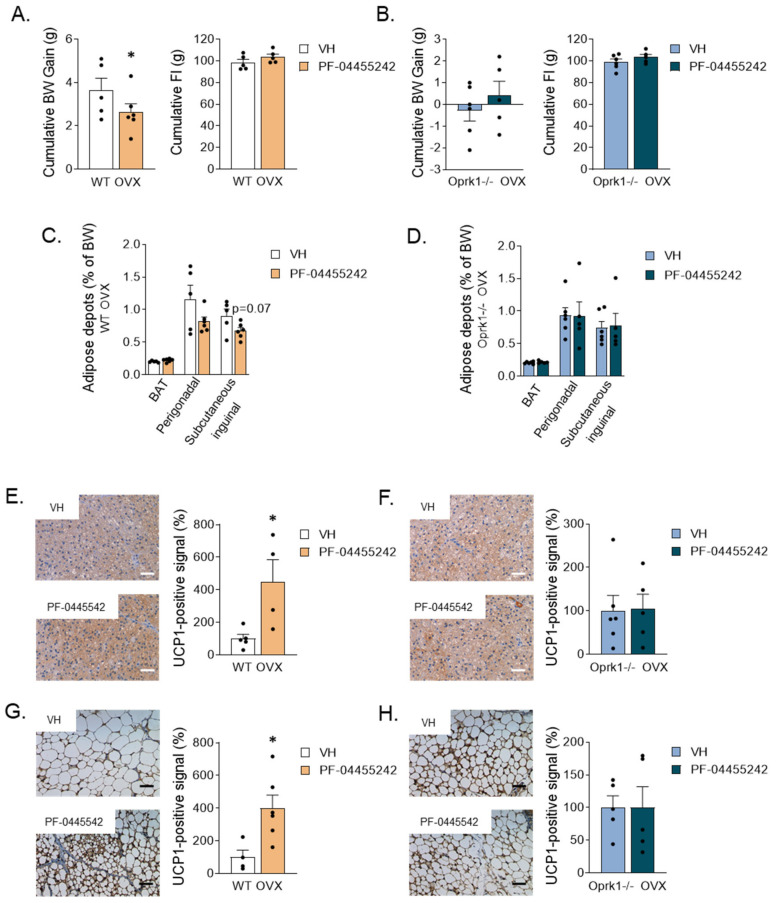
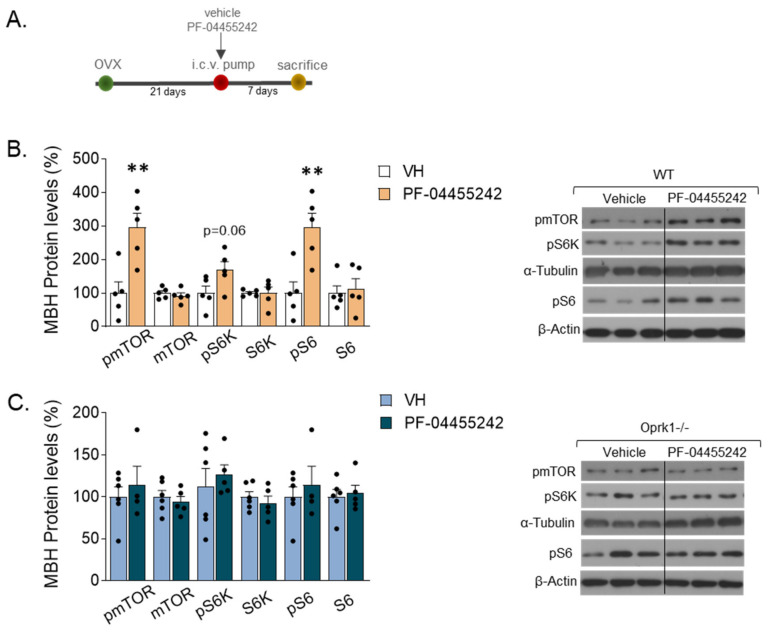
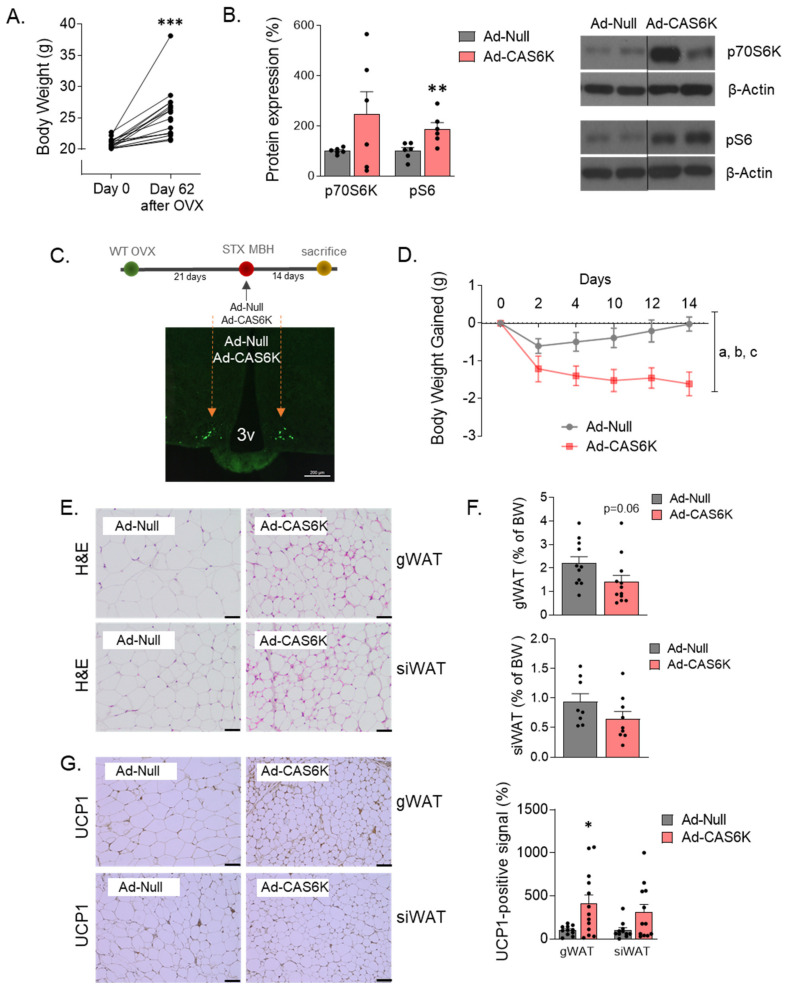
Weight gain is a hallmark of decreased estradiol (E2) levels because of menopause or following surgical ovariectomy (OVX) at younger ages. Of note, this weight gain tends to be around the abdomen, which is frequently associated with impaired metabolic homeostasis and greater cardiovascular risk in both rodents and humans. However, the molecular underpinnings and the neuronal basis for these effects remain to be elucidated. The aim of this study is to elucidate whether the kappa-opioid receptor (k-OR) system is involved in mediating body weight changes associated with E2 withdrawal. Here, we document that body weight gain induced by OVX occurs, at least partially, in a k-OR dependent manner, by modulation of energy expenditure independently of food intake as assessed in Oprk1-/-global KO mice. These effects were also observed following central pharmacological blockade of the k-OR system using the k-OR-selective antagonist PF-04455242 in wild type mice, in which we also observed a decrease in OVX-induced weight gain associated with increased UCP1 positive immunostaining in brown adipose tissue (BAT) and browning of white adipose tissue (WAT). Remarkably, the hypothalamic mTOR pathway plays an important role in regulating weight gain and adiposity in OVX mice. These findings will help to define new therapies to manage metabolic disorders associated with low/null E2 levels based on the modulation of central k-OR signaling.

Keywords: energy expenditure; estrogens; kappa-opioid; obesity; p70S6K.


Conflict of interest statement

The authors declare that they have no conflict of interest.

Figures

Figure 1
Figure 1
Oprk1−/−mutant mice lacking k-OR receptors are resistant to body weight (BW) gain and fat mass accumulation promoted by ovariectomy (OVX). (A,B) BW gain evolution, cumulative BW after 11 weeks and daily food intake (FI) under SHAM and OVX conditions in (A) WT and (B) Oprk1−/−mice. (C,D) results from nuclear magnetic resonance (NMR) regarding fat mass and lean mass expressed in percentage of BW in SHAM and OVX groups in WT (C) and Oprk1−/− (D) animals. Values are expressed as mean ± SEM (n = 8–12 per group). Two-way ANOVA (factors: OVX and time) was used to analyze BW gain evolution. Annotation indicates significant effect of a = OVX, b = time, c = interaction OVX x time. Unpaired t-test or Mann–Whitney test were used to compare the two groups (SHAM and OVX), indicating significant differences compared to SHAM p < 0.01 (**), p < 0.001 (***).
Figure 2
Figure 2
Calorimetric study indicates that Oprk1−/−mice are insensitive to EE changes induced by ovariectomy (OVX). (AD) Total energy expenditure (EE) (Kcal/h/Kg) in (A) WT and (B) Oprk1−/−under SHAM and OVX experimental conditions in the light and dark periods during 48 h and relative to body weight (g) in WT (C) and Oprk1−/− (D) animals. (E,F) locomotor activity (LA) in (E) WT and (F) Oprk1−/−during the dark and light phases from 48 h analysis. (G,H) respiratory exchange ratio (RER) (VCO2/VO2) in (G) WT and (H) Oprk1−/−mice considering light and dark phases under SHAM and OVX conditions. Values are expressed as mean ± SEM (n = 8–12 per group). Unpaired t-test or Mann–Whitney test were used to compare the two groups (SHAM and OVX), indicating significant differences compared to SHAM (*). p < 0.05 (*), p < 0.01 (**).
Figure 3
Figure 3
Increased thermogenic program in ovariectomized k-OR-deficient mice under thermoneutrality. (A) Rectal temperature at 30 °C. (B) Quantification of brown adipose tissue (BAT) interscapular temperature and representative infrared thermal images under thermoneutrality conditions. (C) Total BAT weight (g) and expressed in percentage of body weight (BW). (D) BAT Hematoxylin and Eosin stating (H&E). (E) Total energy expenditure without taking BW into account (kcal/h) in OVX-WT animals and OVX-Oprk1−/−mice and energy expenditure (EE) in WT and Oprk1−/−relative to their body weight (g). (F) Locomotor activity measured in beam breaks in OVX-WT and OVX-Oprk1−/−mice. (G) Uncoupling protein 1 (UCP1) immunostaining in OVX-WT and OVX-Oprk1−/−mice subjected to thermoneutrality. Scale bar: 20 µm. Values are expressed as mean ± SEM (n = 6–8 per group). t-test or Mann–Whitney (non-parametric conditions) was used to compare the two groups (OVX-WT and OVX-Oprk1−/−), indicating significant differences compared to OVX-WT animals. p < 0.05 (*) (# vs. WT night phase).
Figure 4
Figure 4
WAT browning in the E2 withdrawal model. (A) Representative images of Hematoxylin and Eosin staining of gonadal WAT (gWAT) and subcutaneous inguinal WAT (siWAT) from WT and Oprk1−/−mice under OVX conditions. Scale bar: 50 µm. (B) Gonadal and subcutaneous inguinal fat depots expressed as percentage of BW in ovariectomized WT and Oprk1−/−mice. (C,D) Representative images and quantification of UCP1 immunostaining in gWAT (C) and subcutaneous inguinal WAT (siWAT) from same animals. Values are expressed as mean ± SEM (n = 6–12 per group). Mann–Whitney (non-parametric conditions) was used to compare the two groups (OVX-WT and OVX-Oprk1−/−).
Figure 5
Figure 5
Metabolic effects of the central k-OR antagonist, PF-04455242, or vehicle (VH) administration to OVX mice. (A,B) Cumulative body weight gain and cumulative food intake monitored one week after pump brain infusion in WT (A) and in Oprk1−/−mice (B) after k-OR agonist brain infusion. (C,D) Percentage of brown adipose tissue (BAT), perigonadal, and subcutaneous inguinal fat depots (% of BW) in WT (C) and Oprk1−/−mice (D). (EH) Representative images and quantification of uncoupling protein 1 (UCP1) levels in BAT of WT (E) and Oprk1−/− (F) animals and representative images and quantification of UCP1 protein levels in subcutaneous inguinal WAT (siWAT) in the different groups (Vehicle and PF-0445542) of WT (G) and Oprk1−/− (H) animals. Scale bar: 50 µm. Values are expressed as mean ± SEM. t-test or Mann–Whitney were used to compare vehicle and PF-treated mice. p < 0.05 (*).
Figure 6
Figure 6
mTOR signaling pathway in the medio-basal hypothalamic area (MBH) of OVX mice after vehicle (VH) or PF-0445542 infusion. (A) Schematic diagram of the experimental design. (B,C) mTOR pathway analyzed by protein expression of phosphorylated and total forms of mTOR, p70S6K (S6K), and S6 after pharmacological inhibition of k-OR with the antagonist, PF-04455242, in WT (B) and Oprk1−/− (C) OVX mice (n = 5–6 per group). Representative blots are shown. Black line indicates cropped images. t-test or Mann–Whitney used to compare vehicle and PF-treated mice. p < 0.01 (**).
Figure 7
Figure 7
Constitutive activation of p70S6K in medial-basal hypothalamic area (MBH) reduces body weight (BW) gain induced by OVX. (A) Body weight (g) of WT female mice before and after 62 days of OVX surgery. (B) Demonstration of p70S6K constitutive activation by measurements of p70S6K and phosphorylated-S6 ribosomal (Ser240/244) protein forms in Null and CAS6K subjects. Representative blots are shown. Black line indicates cropped images. (C) Image depicting the stereotaxic (STX) bilateral injection of adenoviruses particles (Ad-Null or Ad-CAS6K) into the MBH. (D) BW gain evolution in WT-OVX mice after constitutive activation of p70S6K in MBH. (E) Histological images of WAT depots (Hematoxylin and Eosin staining). (F) Content of gWAT and siWAT expressed as percentage of BW in Ad-Null and Ad-CAS6K OVX-mice. (G) Activation of browning in gWAT and siWAT, as denoted by UCP1 protein levels detected by immunohistochemistry. Values are expressed as mean ± SEM (n = 6–12 per group). Two-way ANOVA was performed to analyze BW gain evolution (factors: p70S6K activation and time). Annotation indicates significant effect of a = p70S6K activation, b = time, c = interaction p70S6K x time). t-test was performed for comparisons between Ad-Null and Ad-CAS6K animals (* p < 0.05; ** p < 0.01; p < 0.001).

Similar articles

Cited by

References

    1. Wade G.N., Gray J.M. Gonadal effects on food intake and adiposity: A metabolic hypothesis. Physiol. Behav. 1979;22:583–593. doi: 10.1016/0031-9384(79)90028-3. - DOI - PubMed
    1. Rogers N.H., Perfield J.W., 2nd, Strissel K.J., Obin M.S., Greenberg A.S. Reduced energy expenditure and increased inflammation are early events in the development of ovariectomy-induced obesity. Endocrinology. 2009;150:2161–2168. doi: 10.1210/en.2008-1405. - DOI - PMC - PubMed
    1. Mauvais-Jarvis F., Clegg D.J., Hevener A.L. The role of estrogens in control of energy balance and glucose homeostasis. Endocr. Rev. 2013;34:309–338. doi: 10.1210/er.2012-1055. - DOI - PMC - PubMed
    1. Lopez M., Tena-Sempere M. Estrogens and the control of energy homeostasis: A brain perspective. Trends Endocrinol. Metab. 2015;26:411–421. doi: 10.1016/j.tem.2015.06.003. - DOI - PubMed
    1. Lopez M., Tena-Sempere M. Estradiol and brown fat. Best Pract. Res. Clin. Endocrinol. Metab. 2016;30:527–536. doi: 10.1016/j.beem.2016.08.004. - DOI - PubMed