. 2022 Mar 15;23(6):3172.
doi: 10.3390/ijms23063172.

Effects of a Fully Humanized Type II Anti-CD20 Monoclonal Antibody on Peripheral and CNS B Cells in a Transgenic Mouse Model of Multiple Sclerosis

Affiliations

Effects of a Fully Humanized Type II Anti-CD20 Monoclonal Antibody on Peripheral and CNS B Cells in a Transgenic Mouse Model of Multiple Sclerosis

Sabine Tacke et al. Int J Mol Sci. .

Abstract

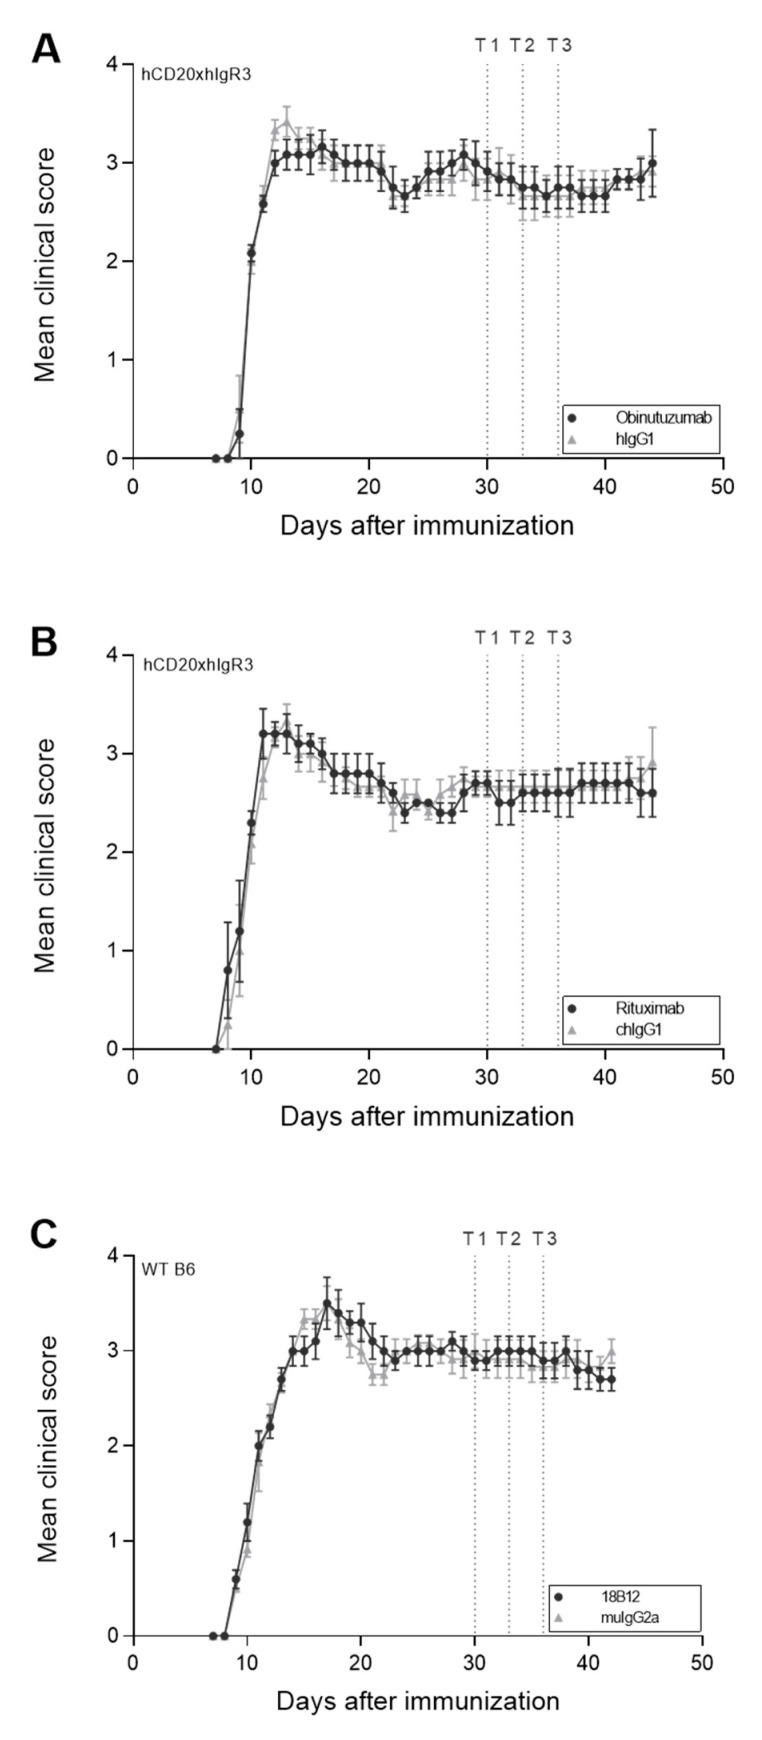
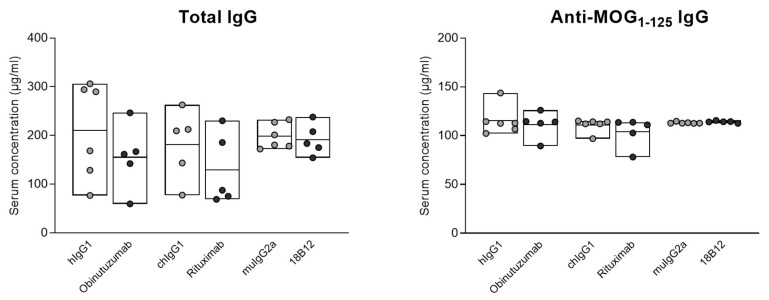
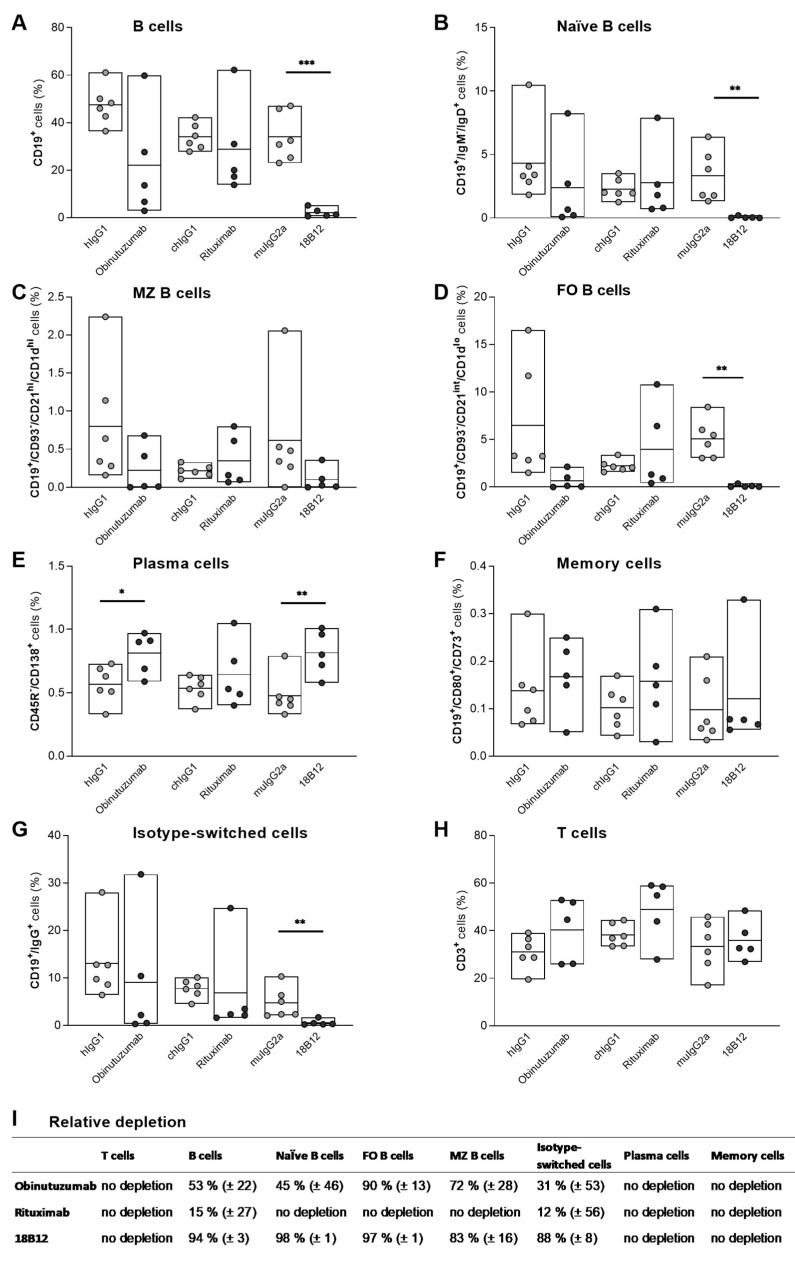
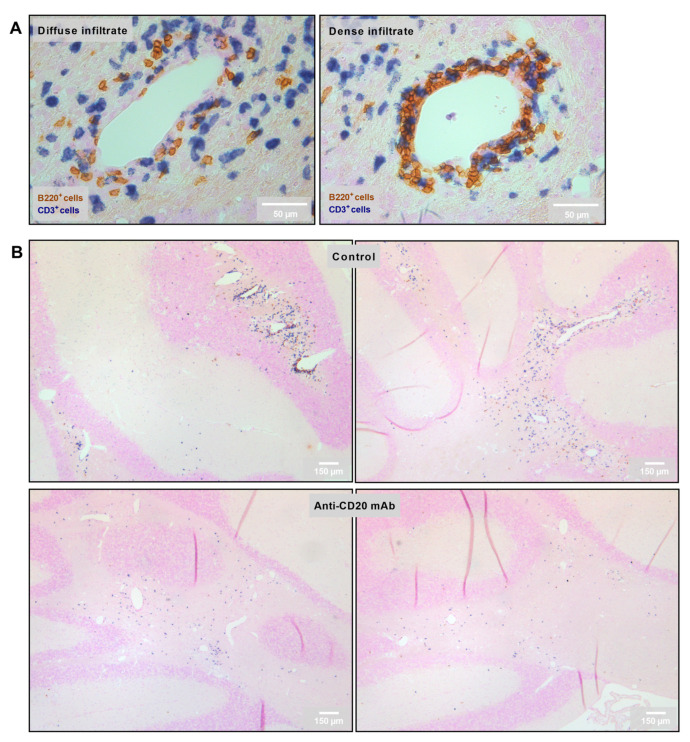
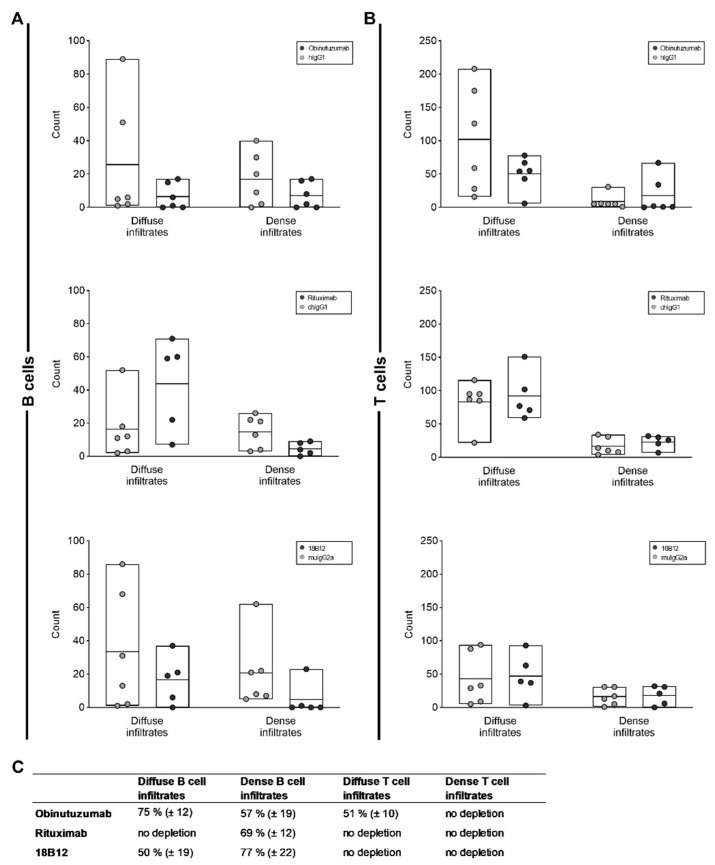
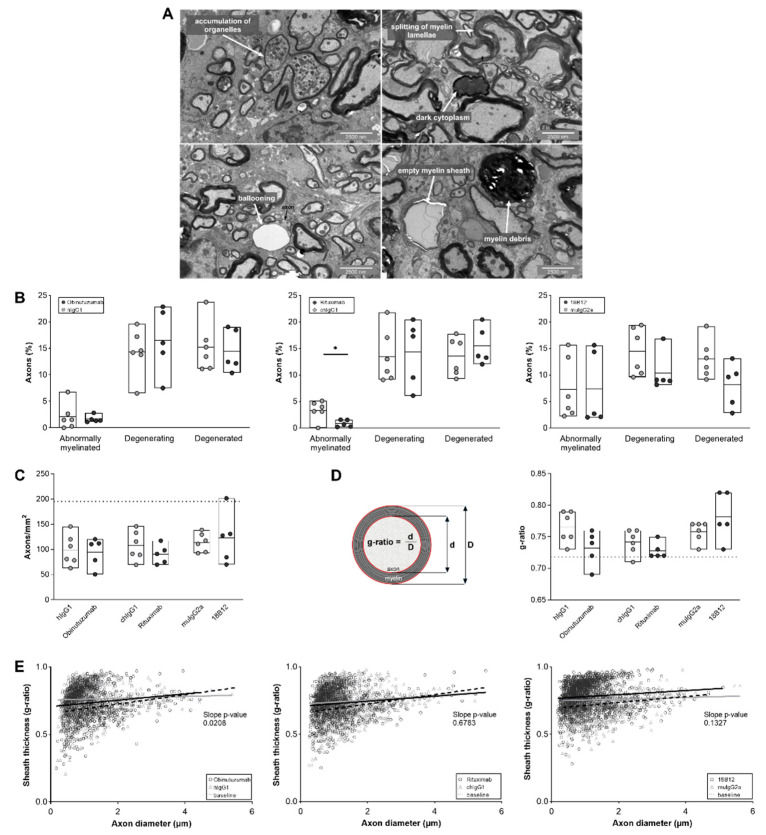
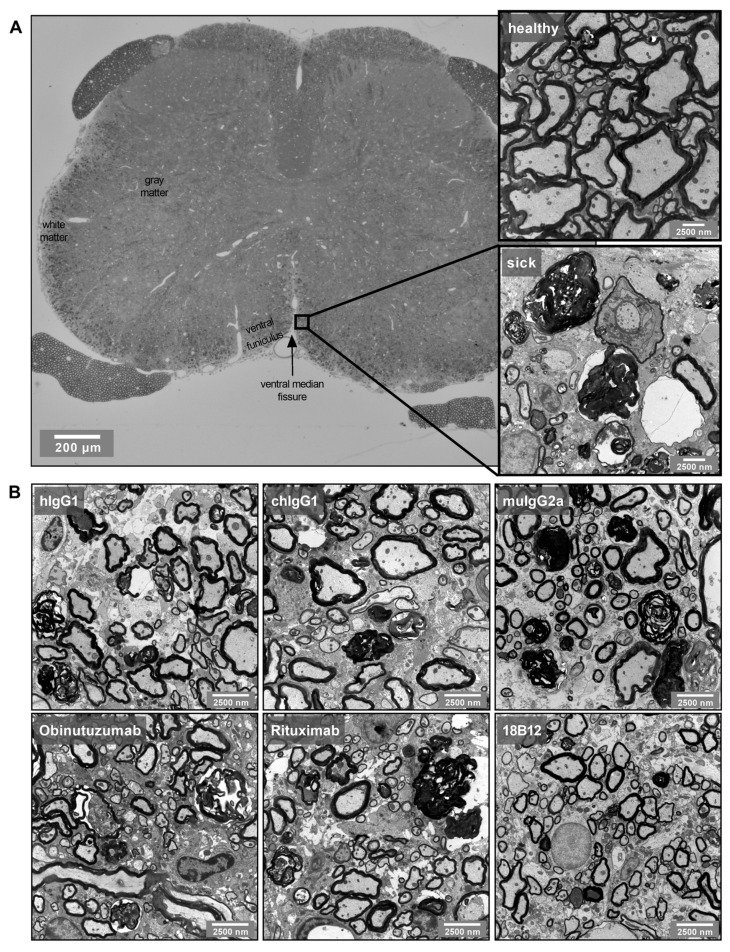
Successful therapy with anti-CD20 monoclonal antibodies (mAbs) has reinforced the key role of B cells in the immunopathology of multiple sclerosis (MS). This study aimed to determine the effects of a novel class of anti-CD20 mAbs on vascular and extravascular central nervous system (CNS)-infiltrating B cells in experimental autoimmune encephalomyelitis (EAE), an animal model of MS. Male hCD20xhIgR3 mice and wild-type C57BL/6 (B6) mice were immunized with human myelin oligodendrocyte glycoprotein (MOG)1-125 to induce EAE. While hCD20xhIgR3 mice were injected intravenously with an anti-human CD20 mAb (5 mg/kg) (rituximab (a type I anti-CD20 mAb) or obinutuzumab (a type II anti-CD20 mAb), B6 mice received the anti-mouse CD20 antibody 18B12. Neither mAb affected clinical disease or serum antibody levels. Obinutuzumab and rituximab had an impact on splenic and CNS-infiltrated B cells with slightly differential depletion efficacy. Additionally, obinutuzumab had beneficial effects on spinal cord myelination. B cell depletion rates in the 18B12/B6 model were comparable with those observed in obinutuzumab-treated hCD20xhIgR3 mice. Our results demonstrate the usefulness of anti-CD20 mAbs for the modulation of B cell-driven peripheral immune response and CNS pathology, with type II antibodies potentially being superior to type I in the depletion of tissue-infiltrating B cells.

Keywords: B cells; CD20; experimental autoimmune encephalomyelitis; multiple sclerosis; obinutuzumab; rituximab.


Conflict of interest statement

S.T., R.C. and V.S. declare that they have no competing interests. E.U. is an employee of F. Hoffmann-La Roche. S.K. reports grants from the Deutsche Forschungsgemeinschaft (DFG), Novartis, F. Hoffmann-La Roche, and Sanofi; and speaker fees and consultancy honoraria from Novartis, F. Hoffmann-La Roche, Sanofi, and Teva (outside the submitted work). The funders had no role in the design of the study; in the collection, analyses, or interpretation of data; in the writing of the manuscript, or in the decision to publish the results.

Figures

Figure 1
Figure 1
Effect of anti-CD20 mAb treatment on clinical disease in hCD20xhIgR3 and WT B6 mice. EAE was assessed daily in all mice (n = 5–6 per group) and scores are shown as means ± standard error of the mean. Dotted lines mark the three time points (T1, day 19; T2, day 22; T3, day 25) of treatment with 5 mg/kg anti-CD20 mAb: (A) obinutuzumab, (B) rituximab, or (C) 18B12, or their respective isotype control antibodies (hIgG1, chIgG1, or muIgG2a). Note that treatment started 19 days after the mice had reached an EAE score of ≥2.5. Mice were scored using the standard EAE scale ranging from 0 to 5: 0, no signs of disease; 1, limp tail; 2, hindlimb weakness; 3, nearly complete or complete hindlimb paralysis; 4, complete hindlimb and partial forelimb paralysis; 5, moribund. The area under the curve (AUC) was calculated for each group. To evaluate whether there was a statistically significant difference in disease severity between the isotype control- and anti-CD20 mAb-treated groups the p-value of the AUCs was calculated using an unpaired t-test. No statistical significance was observed.
Figure 2
Figure 2
Serum levels of total and anti-MOG1–125 IgG in hCD20xhIgR3 and WT B6 mice. Mice were each injected three times with 5 mg/kg anti-CD20 mAbs or the corresponding isotype controls. Serum IgG levels were determined by ELISA in 5–6 mice per group, 7 days after the last injection. Each circle represents the mean value for an individual mouse. The bars indicate the group mean value as well as minimum and maximum values. Statistical significance was evaluated by unpaired t-test. There was no statistically significant difference between any of the groups.
Figure 3
Figure 3
Depletion of splenic B cell subsets by anti-CD20 mAbs in hCD20xhIgR3 and WT B6 mice. Spleen cells were harvested from 5 to 6 animals per group, 7 days after injection with 5 mg/kg of obinutuzumab, rituximab, 18B12, or the corresponding isotype controls. Using flow cytometry, cells were gated on single live lymphocytes followed by the identification of different B cell subsets using five separate antibody panels. Percentages were calculated in reference to the total lymphocyte population. (A) B cells were defined as CD19+, (B) naïve B cells as CD19+/IgM/IgD+, (C) marginal zone B cells as CD19+/CD93/CD21hi/CD1dhi, (D) follicular B cells as CD19+/CD93/CD21int/CD1dlo, (E) plasma cells as CD45R/CD138+, (F) memory cells as CD19+/CD80+/CD73+, and (G) isotype-switched cells as CD19+/IgG+. (H) T cells were defined as CD3+. Each circle represents the mean value of an individual mouse. The bars indicate the group mean value as well as minimum and maximum values. The following statistical tests were used for group comparisons: panels (A,D), Welch’s t-test; panels (B,G), Mann–Whitney U test; panel (C), unpaired t-test (OBZ), Welch’s t-test (RTX) and Mann–Whitney U test (18B12); panels (E,F), unpaired t-test; panel (H), unpaired t-test (OBZ); Welch’s t-test (RTX) and unpaired t-test (18B12). * p ≤ 0.05, ** p ≤ 0.01, *** p ≤ 0.001. (I) Relative depletion (mean ± SEM) of the different B cell subsets in anti-CD20 mAb- compared to isotype control-treated groups. FO, follicular; MZ, marginal zone.
Figure 4
Figure 4
Representative images of CNS infiltration in isotype control- and anti-CD20 mAb-treated groups: (A) Categorization of infiltrates depending on the diffuse vs. dense infiltration of lymphocytes into the CNS. B220+ cells were defined as B cells, and CD3+ cells as T cells. (B) Representative images of cerebellar infiltration in isotype control- (upper row) vs. anti-CD20 mAb (lower row)-treated groups.
Figure 5
Figure 5
Effect of anti-CD20 mAbs on CNS-infiltrating B and T cells. The cerebella of 5–6 mice per group were analyzed 7 days after the end of treatment with anti-CD20 mAbs or isotype controls, as indicated in the figure insets. Thirty images per mouse were analyzed. Each circle represents the mean value for an individual mouse. The bars indicate the group mean value as well as minimum and maximum values. The following statistical tests were used for group comparisons: diffuse infiltrates in panel (A), Mann–Whitney U test (OBZ, RTX) and unpaired t-test (18B12); dense infiltrates in panel (A), unpaired t-test (OBZ, RTX) and Mann–Whitney U test (18B12); diffuse infiltrates in panel (B), unpaired t-test; dense infiltrates in panel (B), Mann–Whitney U test (OBZ) and unpaired t-test (RTX, 18B12). There was no statistically significant difference between any of the groups. (C) Relative depletion (mean ± SEM) of B cell and T cell infiltrates in anti-CD20 mAb- compared to isotype control-treated groups.
Figure 6
Figure 6
Anti-CD20 mAb treatment effects on ultrastructural spinal cord pathology in hCD20xhIgR3 and WT B6 mice. Spinal cords of mice (n = 5–6 per group) were dissected 7 days after the final injection of 5 mg/kg anti-CD20 mAbs or corresponding isotype control. (A) Representative electron micrographs showing the different categories of nerve fiber degeneration. Splitting and ballooning of myelin lamellae indicate abnormally myelinated axons; accumulation of organelles and dark cytoplasm indicate degenerating axons; and myelin debris and empty myelin sheaths indicate degenerated axons. (B) Quantification of axonal degeneration. Each circle represents the mean value of an individual mouse. The bars indicate the group mean value as well as minimum and maximum values. The following statistical tests were used for group comparisons: abnormal axons, unpaired t-test (OBZ) and Welch’s t-test (RTX, 18B12); degenerating and degenerated axons, Welch’s t-test (all groups). * p ≤ 0.05. (C) Number of axons per mm2. The dotted line marks the baseline value (195 axons/mm2) in healthy mice (n = 7). Statistical significance was evaluated by unpaired t-test. (D) The g-ratio was calculated by dividing the diameter of the axon by the diameter of the nerve fiber (axon + myelin sheath) in a mean ± SD of 229 ± 37 randomly selected axons/mouse (n = 5–6 mice per group). The dotted line represents the baseline value of normally myelinated axons (0.718) (n = 7; mean ± SD of 13 ± 19 axons/mouse). The bars indicate the group mean value as well as minimum and maximum values. Statistical significance was calculated using unpaired t-test. (E) Scatter plots showing the myelin sheath thickness of individual myelinated axons as a function of the respective axon diameter with simple linear regression analysis (black line: anti-CD20 mAbs; grey line: isotype controls; dashed line: baseline). The baseline was determined from healthy mice (n = 7). The significant slope change in the regression analysis of obinutuzumab-treated mice toward the baseline indicates a positive effect of the therapeutic mAb on myelination (p = 0.0298). Statistical significance was calculated using ANCOVA.
Figure 7
Figure 7
Representative spinal cord EM images: (A) EM images were taken from the ventral funiculus of transverse spinal cord sections. The magnifications show the difference between healthy and EAE (sick) tissue. (B) Representative EM images from the different isotype control- and anti-CD20 mAb-treated groups.
Figure 8
Figure 8
Representative flow cytometric gating strategy for the analysis of B cell subsets. Cells were gated on single live lymphocytes followed by the identification of the different B cell subsets using five separate antibody panels.

Similar articles

Cited by

References

    1. Kingwell E., Marriott J.J., Jetté N., Pringsheim T., Makhani N., Morrow S.A., Fisk J.D., Evans C., Béland S.G., Kulaga S., et al. Incidence and prevalence of multiple sclerosis in Europe: A systematic review. BMC Neurol. 2013;13:128. doi: 10.1186/1471-2377-13-128. - DOI - PMC - PubMed
    1. Mandia D., Ferraro O.E., Nosari G., Montomoli C., Zardini E., Bergamaschi R. Environmental factors and multiple sclerosis severity: A descriptive study. Int. J. Environ. Res. Public Health. 2014;11:6417–6432. doi: 10.3390/ijerph110606417. - DOI - PMC - PubMed
    1. Bernard C.C., Kerlero de Rosbo N. Multiple sclerosis: An autoimmune disease of multifactorial etiology. Curr. Opin. Immunol. 1992;4:760–765. doi: 10.1016/0952-7915(92)90058-M. - DOI - PubMed
    1. Disanto G., Berlanga A.J., Handel A.E., Para A.E., Burrell A.M., Fries A., Handunnetthi L., De Lucal G.C., Morahan J.M. Heterogeneity in multiple sclerosis: Scratching the surface of a complex disease. Autoimmune Dis. 2010;2011:932351. doi: 10.4061/2011/932351. - DOI - PMC - PubMed
    1. Klineova S., Lublin F.D. Clinical course of multiple sclerosis. Cold Spring Harb. Perspect. Med. 2018;8:a028928. doi: 10.1101/cshperspect.a028928. - DOI - PMC - PubMed

Grants and funding