. 2022 Mar 16;23(6):3184.
doi: 10.3390/ijms23063184.

BRET-Based Biosensors to Measure Agonist Efficacies in Histamine H1 Receptor-Mediated G Protein Activation, Signaling and Interactions with GRKs and β-Arrestins

Affiliations

BRET-Based Biosensors to Measure Agonist Efficacies in Histamine H1 Receptor-Mediated G Protein Activation, Signaling and Interactions with GRKs and β-Arrestins

Eléonore W E Verweij et al. Int J Mol Sci. .

Abstract

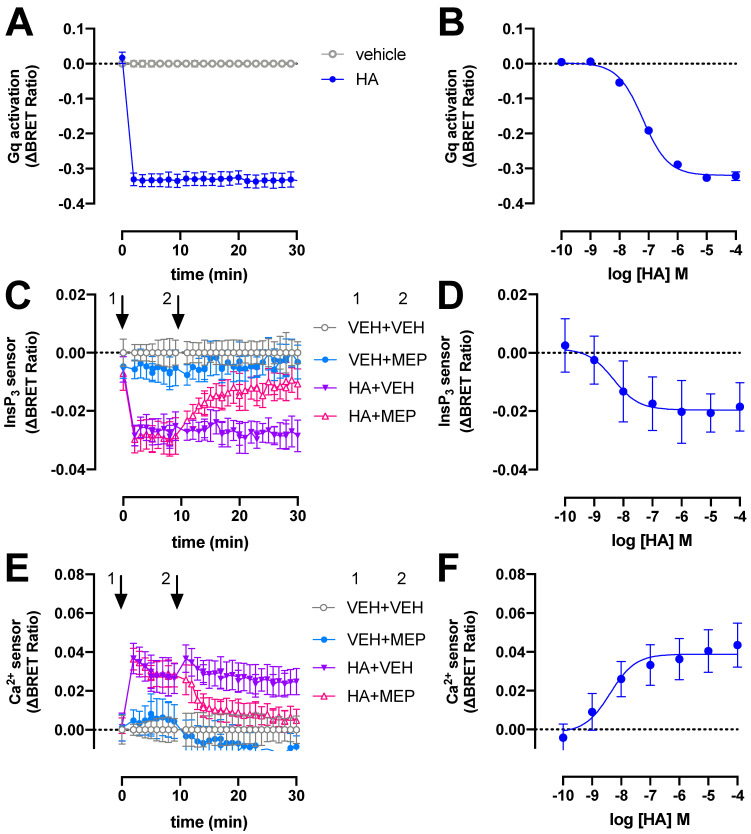
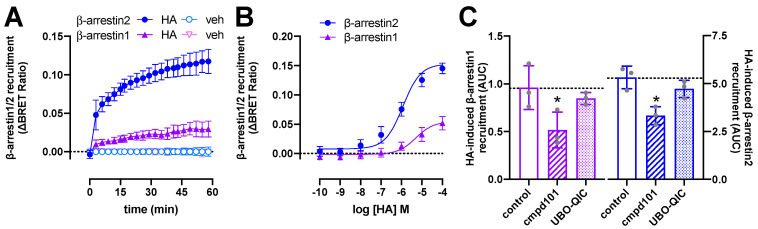
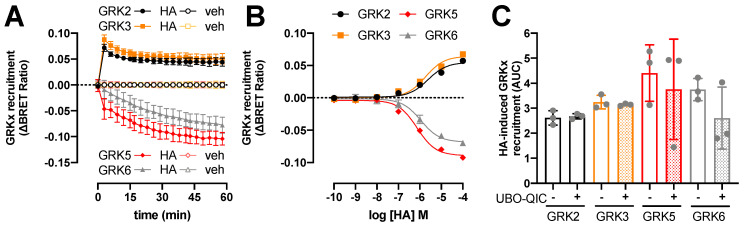
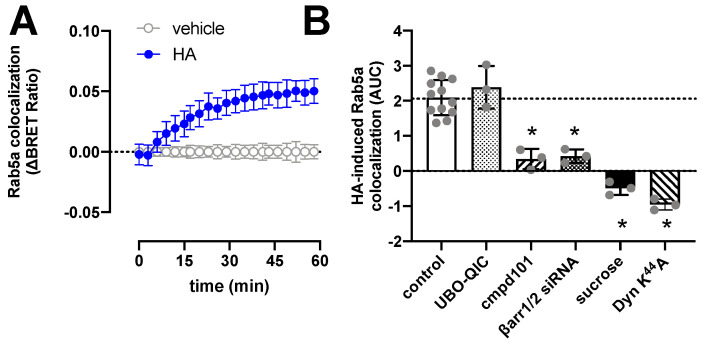
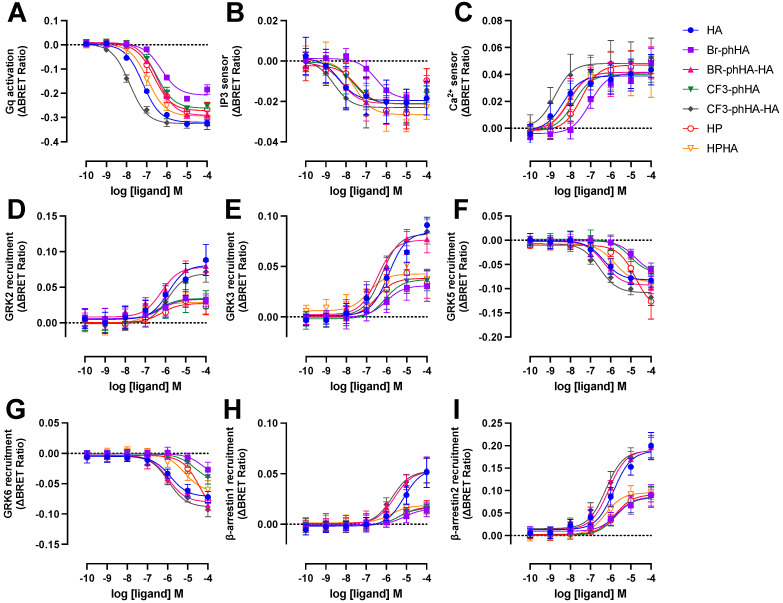
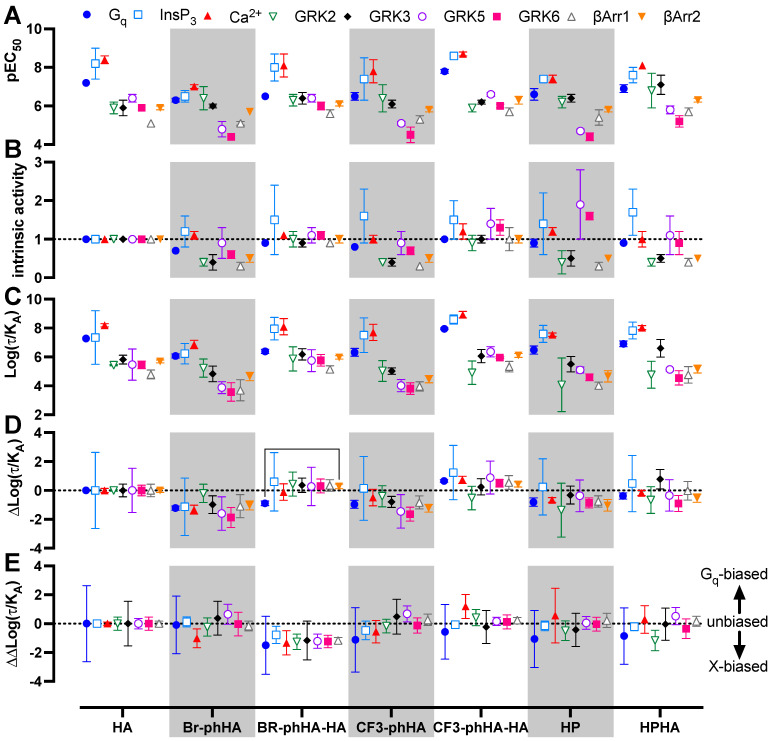
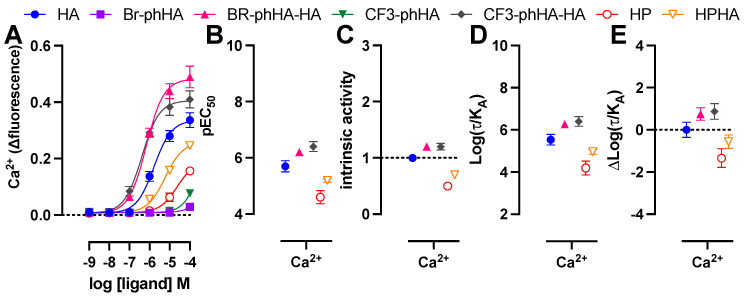
The histamine H1 receptor (H1R) is a G protein-coupled receptor (GPCR) and plays a key role in allergic reactions upon activation by histamine which is locally released from mast cells and basophils. Consequently, H1R is a well-established therapeutic target for antihistamines that relieve allergy symptoms. H1R signals via heterotrimeric Gq proteins and is phosphorylated by GPCR kinase (GRK) subtypes 2, 5, and 6, consequently facilitating the subsequent recruitment of β-arrestin1 and/or 2. Stimulation of a GPCR with structurally different agonists can result in preferential engagement of one or more of these intracellular signaling molecules. To evaluate this so-called biased agonism for H1R, bioluminescence resonance energy transfer (BRET)-based biosensors were applied to measure H1R signaling through heterotrimeric Gq proteins, second messengers (inositol 1,4,5-triphosphate and Ca2+), and receptor-protein interactions (GRKs and β-arrestins) in response to histamine, 2-phenylhistamines, and histaprodifens in a similar cellular background. Although differences in efficacy were observed for these agonists between some functional readouts as compared to reference agonist histamine, subsequent data analysis using an operational model of agonism revealed only signaling bias of the agonist Br-phHA-HA in recruiting β-arrestin2 to H1R over Gq biosensor activation.

Keywords: BRET assay; G protein; GPCR; GPCR kinase; H1R; biased signaling; histamine; β-arrestin.


Conflict of interest statement

The authors declare no conflict of interest.

Figures

Figure 1
Figure 1
H1R activates heterotrimeric Gq proteins, InsP3 production and Ca2+ release in response to histamine (HA). BRET measurements in HEK293T cells transiently co-expressing H1R (0.5–1 µg plasmid/dish) in combination with the heterotrimeric Gq activation sensor (2.5 µg plasmid/dish) (A,B), InsP3 (C,D) or Ca2+ (E,F) sensor (4.0–4.5 µg plasmid/dish) in real time upon stimulation with 10 µM histamine (A,C,E) or after 20-min stimulation with increasing concentrations histamine (B,D,F). InsP3 and Ca2+ cells were first stimulated with vehicle (VEH) or histamine (HA) at t = 0 min followed by a second injection of vehicle (VEH) or 10 µM mepyramine (MEP) at t = 10 min, indicated by the numbered arrows 1 and 2, respectively (CE). Data are shown as mean ± SD from at least three independent experiments performed in triplicate.
Figure 2
Figure 2
Histamine (HA)-induced β-arrestin1/2 recruitment to H1R. BRET measurements in HEK293T cells transiently co-expressing H1R-Rluc8 (0.5 µg plasmid/dish) in combination with β-arrestin1-eYFP or β-arrestin2-mVenus (4.0 µg plasmid/dish) in real time upon stimulation with 10 µM histamine (A) or after 1-h stimulation with increasing concentrations histamine (B). Data are shown as mean ± SD from at least four independent experiments performed in triplicate. Area under the curve (AUC) of 1-h BRET traces in response to 10 µM histamine following 30-min pretreatment of the cells with vehicle (control), 3 µM cmpd101, or 1 µM UBO-QIC. AUC of the BRET experiments are presented as mean ± SD from three independent experiments performed in triplicate, with scatter plots (gray dots) showing the individual AUC values (C). Statistical differences (p < 0.05) compared to vehicle-pretreated (i.e., control) cells were determined using one-way ANOVA with Dunnett’s multiple comparison test and are indicated by an asterisk.
Figure 3
Figure 3
Histamine (HA)-induced modulation in H1R interaction with GRKs. BRET measurements in HEK293T cells transiently co-expressing H1R-Rluc8 (0.5 µg plasmid/dish) in combination with GRK2-mVenus, GRK3-mVenus, GRK5-mVenus, or GRK6-mVenus (4.0 µg plasmid/dish) in real time upon stimulation with 10 µM histamine (A) or after 1-h stimulation with increasing concentrations histamine (B). Data are shown as mean ± SD from at least three independent experiments performed in triplicate. Area under the curve (AUC) of 1-h BRET traces in response to 10 µM histamine following 30-min pretreatment of the cells with vehicle (control) or 1 µM UBO-QIC. AUC of the BRET experiments are presented as mean ± SD from three independent experiments performed in triplicate, with scatter plots (gray dots) showing the individual AUC values (C). No statistical differences (p < 0.05) compared to vehicle-pretreated (i.e., control) cells are observed using one-way ANOVA with Dunnett’s multiple comparison test.
Figure 4
Figure 4
Histamine (HA)-induced internalization of H1R. BRET measurements in HEK293T cells transiently co-expressing H1R-Rluc8 (0.5 µg plasmid/dish) in combination with the early endosome marker Venus-Rab5a (2 µg plasmid/dish) in real time upon stimulation with 10 µM histamine (A). Data are shown as mean ± SD from at least three independent experiments performed in triplicate. Area under the curve (AUC) of 1-h BRET traces in response to 10 µM histamine following 30-min pretreatment of the cells with vehicle (control), 1 µM UBO-QIC, 3 µM cmpd101, or 0.16 µM sucrose, or co-transfection with dominant negative dynamin mutant K44A or β-arrestin1/2 siRNA. AUC of the BRET experiments are presented as mean ± SD from three independent experiments performed in triplicate, with scatter plots (gray dots) showing the individual AUC values (B). Statistical differences (p < 0.05) compared to vehicle-pretreated (i.e., control) cells were determined using one-way ANOVA with Dunnett’s multiple comparison test and are indicated by an asterisk.
Figure 5
Figure 5
Concentration response curves of BRET-based responses in HEK293T cells upon stimulation with various H1R agonists. BRET measurements in HEK293T cells transiently co-expressing H1R (0.5–1.0 µg plasmid/dish) in combination with Gq activation sensor (2.5 µg plasmid/dish) (A), InsP3 (B) or Ca2+ (C) sensor (4.0 µg plasmid/dish), or H1R-Rluc8 (1.0 µg plasmid/dish) in combination with GRK2-mVenus (D), GRK3-mVenus (E), GRK5-mVenus (F), GRK6-mVenus (G), β-arrestin1-eYFP (H), or β-arrestin2-mVenus (I) (4.0 µg plasmid/dish), upon stimulation with increasing concentrations agonist for 20 (AC)or 60 min (DI). Data are shown as mean ± SD from at least three independent experiments performed in triplicate.
Figure 6
Figure 6
Biased activities of agonists in BRET-based H1R responses in transfected HEK293T cells. The pEC50 (A) and intrinsic activity (B) values obtained from the concentration response curves in Figure 5 (Supplementary Tables S1 and S2). Intrinsic activities were calculated versus reference full agonist histamine. Transduction ratio (Log(τ/KA) (C), relative effectiveness (ΔLog(τ/KA) (D) and Log bias factor (ΔΔLog(τ/KA) (E) as calculated after analyzing the concentration response curves in Figure 5 using the operational model of agonism to retrieve the transduction ratio (Log(τ/KA; Supplementary Table S3), followed by normalization to the reference full agonist histamine (ΔLog(τ/KA; Supplementary Table S4) and comparison of the various functional readouts to the Gq activation response (ΔΔLog(τ/KA; Supplementary Table S5). Data are shown as mean ± SD from at least three independent experiments performed in triplicate. Statistical differences (p < 0.05) between relative effectiveness of each ligand in the tested responses were determined using Welch ANOVA with Dunnett’s T3 multiple comparison test and are indicated by an asterisk.
Figure 7
Figure 7
Activities of agonists in endogenous H1R-mediated Ca2+ response in HeLa cells. Concentration response curves of Ca2+ mobilization measured 20–30 s after stimulation of HeLa cells with agonists (A). The pEC50 (B), intrinsic activity (C), transduction ratio (Log(τ/KA) (D), and relative effectiveness (ΔLog(τ/KA) as compared to reference agonist histamine (E) of agonist-induced Ca2+ mobilization in HeLa cells are shown as mean ± SD from at least three independent experiments performed in triplicate.

Similar articles

Cited by

References

    1. Thurmond R.L., Gelfand E.W., Dunford P.J. The role of histamine H1 and H4 receptors in allergic inflammation: The search for new antihistamines. Nat. Rev. Drug Discov. 2008;7:41–53. doi: 10.1038/nrd2465. - DOI - PubMed
    1. Panula P., Chazot P.L., Cowart M., Gutzmer R., Leurs R., Liu W.L.S., Stark H., Thurmond R.L., Haas H.L. International union of basic and clinical pharmacology. XCVIII. Histamine receptors. Pharmacol. Rev. 2015;67:601–655. doi: 10.1124/pr.114.010249. - DOI - PMC - PubMed
    1. Tiligada E., Ennis M. Histamine pharmacology: From sir Henry Dale to the 21st century. Br. J. Pharmacol. 2020;177:469–489. doi: 10.1111/bph.14524. - DOI - PMC - PubMed
    1. Gurevich V.V., Gurevich E.V. GPCR signaling regulation: The role of GRKs and arrestins. Front. Pharmacol. 2019;10:125. doi: 10.3389/fphar.2019.00125. - DOI - PMC - PubMed
    1. Peterson Y.K., Luttrell L.M. The diverse roles of arrestin scaffolds in G protein-coupled receptor signaling. Pharmacol. Rev. 2017;69:256–297. doi: 10.1124/pr.116.013367. - DOI - PMC - PubMed

MeSH terms

LinkOut - more resources