

Reduced Expression of PD-1 in Circulating CD4+ and CD8+ Tregs Is an Early Feature of RRMS
- PMID: 35328606
- PMCID: PMC8954486
- DOI: 10.3390/ijms23063185
Reduced Expression of PD-1 in Circulating CD4+ and CD8+ Tregs Is an Early Feature of RRMS
Abstract
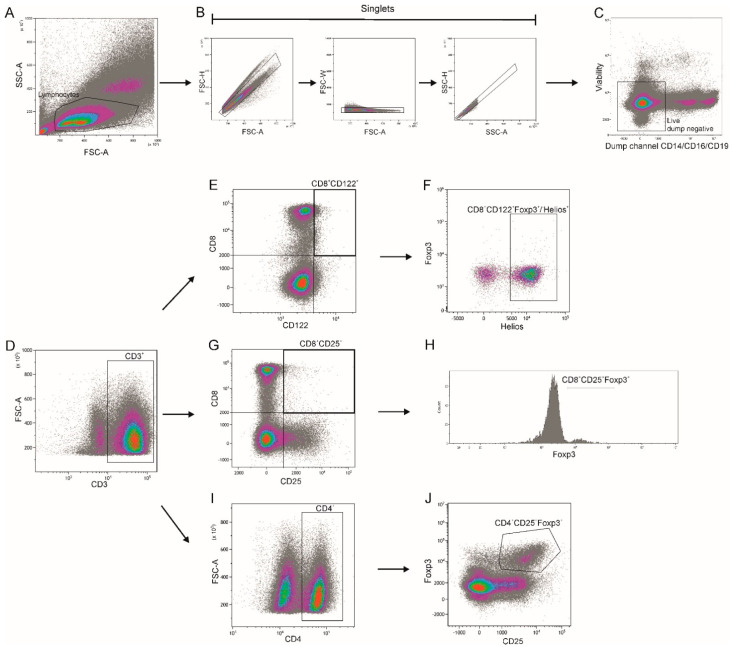
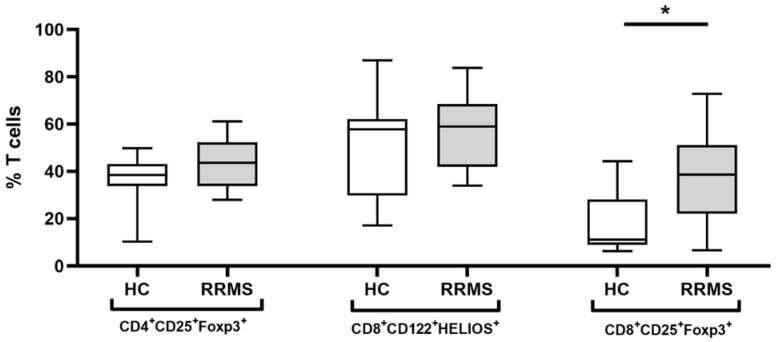
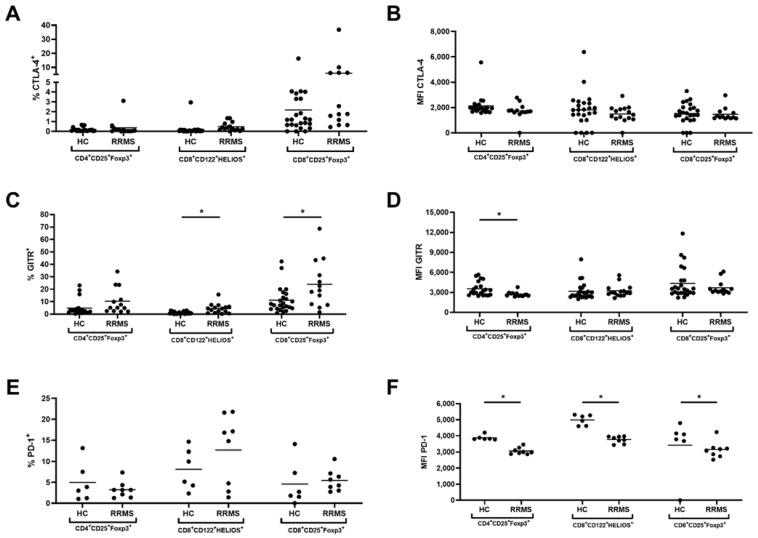
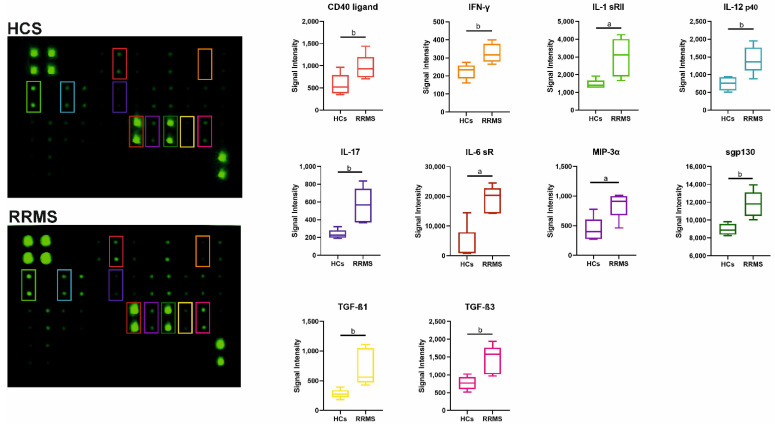
Altered regulatory T cell (Treg) function could contribute to MS. The expression of activating and inhibitory receptors influences the activity of Tregs. Our aim was to investigate T cell phenotypes in relapsing-remitting MS (RRMS) patients at an early phase of the disease. We examined the influence of demographic parameters on the distribution of CD4+ and CD8+ T cell subclasses by generalized linear modeling. We also studied the expression of the following markers-CTLA-4, GITR, PD-1, FoxP3, Helios, CD28, CD62L, CD103-on T cell subsets from peripheral blood with a 14-color flow cytometry panel. We used an antibody array to define the profiles of 34 Th1/Th2/Th17 cytokines in the serum. Expression of PD-1 and GITR on CD4+ and CD8+ Tregs was decreased in RRMS patients. The proinflammatory factors IFN-γ, IL-17, IL-17F, TGFβ-1, TGFβ-3, IL-1SRII, IL-12 p40, sgp130, IL-6sR were significantly increased in RRMS patients. Therefore, a deficiency of PD-1 and GITR immune checkpoints on CD4+ and CD8+ Tregs is a feature of RRMS and might underlie impaired T cell control.
Keywords: T cells; cytokines; relapsing–remitting multiple sclerosis; suppressive markers.
Conflict of interest statement
The authors declare that there is no conflict of interest.
Figures
Similar articles
-
Associations among IL-6 Signaling Molecules in Treg Populations in Patients with Relapsing-Remitting Multiple Sclerosis.J Integr Neurosci. 2025 May 26;24(5):36207. doi: 10.31083/JIN36207. J Integr Neurosci. 2025. PMID: 40464469
-
Decreased suppression of CD8+ and CD4+ T cells by peripheral regulatory T cells in generalized vitiligo due to reduced NFATC1 and FOXP3 proteins.Exp Dermatol. 2020 Aug;29(8):759-775. doi: 10.1111/exd.14157. Epub 2020 Aug 11. Exp Dermatol. 2020. PMID: 32682346
-
Low Memory T Cells Blood Counts and High Naïve Regulatory T Cells Percentage at Relapsing Remitting Multiple Sclerosis Diagnosis.Front Immunol. 2022 May 30;13:901165. doi: 10.3389/fimmu.2022.901165. eCollection 2022. Front Immunol. 2022. PMID: 35711452 Free PMC article.
-
Increased in vitro induced CD4+ and CD8+ T cell IFN-gamma and CD4+ T cell IL-10 production in stable relapsing multiple sclerosis.Int J Neurosci. 1997 Aug;90(3-4):187-202. doi: 10.3109/00207459709000638. Int J Neurosci. 1997. PMID: 9352427 Review.
-
TH2 cells in the pathogenesis of airway remodeling: regulatory T cells a plausible panacea for asthma.Immunol Res. 2006;35(3):219-32. doi: 10.1385/IR:35:3:219. Immunol Res. 2006. PMID: 17172648 Review.
Cited by
-
Effects of High Efficacy Multiple Sclerosis Disease Modifying Drugs on the Immune Synapse: A Systematic Review.Curr Pharm Des. 2024;30(7):536-551. doi: 10.2174/0113816128288102240131053205. Curr Pharm Des. 2024. PMID: 38343058
-
The Immune Response to Nematode Infection.Int J Mol Sci. 2023 Jan 23;24(3):2283. doi: 10.3390/ijms24032283. Int J Mol Sci. 2023. PMID: 36768605 Free PMC article. Review.
-
The Association between Diet and Multiple Sclerosis.Endocr Metab Immune Disord Drug Targets. 2024;24(8):909-917. doi: 10.2174/0118715303247891231023070031. Endocr Metab Immune Disord Drug Targets. 2024. PMID: 37933212
-
Autoreactive lymphocytes in multiple sclerosis: Pathogenesis and treatment target.Front Immunol. 2022 Sep 23;13:996469. doi: 10.3389/fimmu.2022.996469. eCollection 2022. Front Immunol. 2022. PMID: 36211343 Free PMC article. Review.
-
Crosstalk between dendritic cells and regulatory T cells: Protective effect and therapeutic potential in multiple sclerosis.Front Immunol. 2022 Sep 13;13:970508. doi: 10.3389/fimmu.2022.970508. eCollection 2022. Front Immunol. 2022. PMID: 36177043 Free PMC article. Review.
References
MeSH terms
Substances
Grants and funding
LinkOut - more resources
Full Text Sources
Research Materials
