. 2022 Mar 16;23(6):3192.
doi: 10.3390/ijms23063192.

The Hematopoietic TALE-Code Shows Normal Activity of IRX1 in Myeloid Progenitors and Reveals Ectopic Expression of IRX3 and IRX5 in Acute Myeloid Leukemia

Affiliations

The Hematopoietic TALE-Code Shows Normal Activity of IRX1 in Myeloid Progenitors and Reveals Ectopic Expression of IRX3 and IRX5 in Acute Myeloid Leukemia

Stefan Nagel et al. Int J Mol Sci. .

Abstract

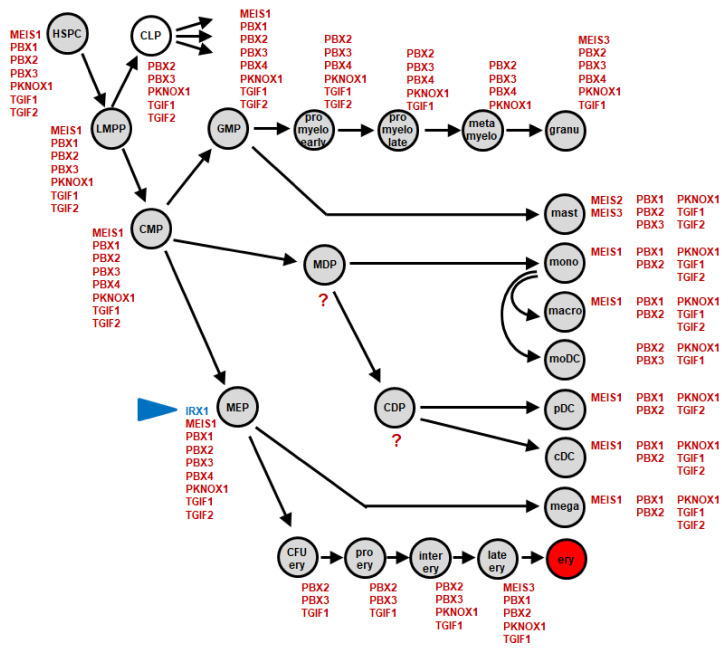
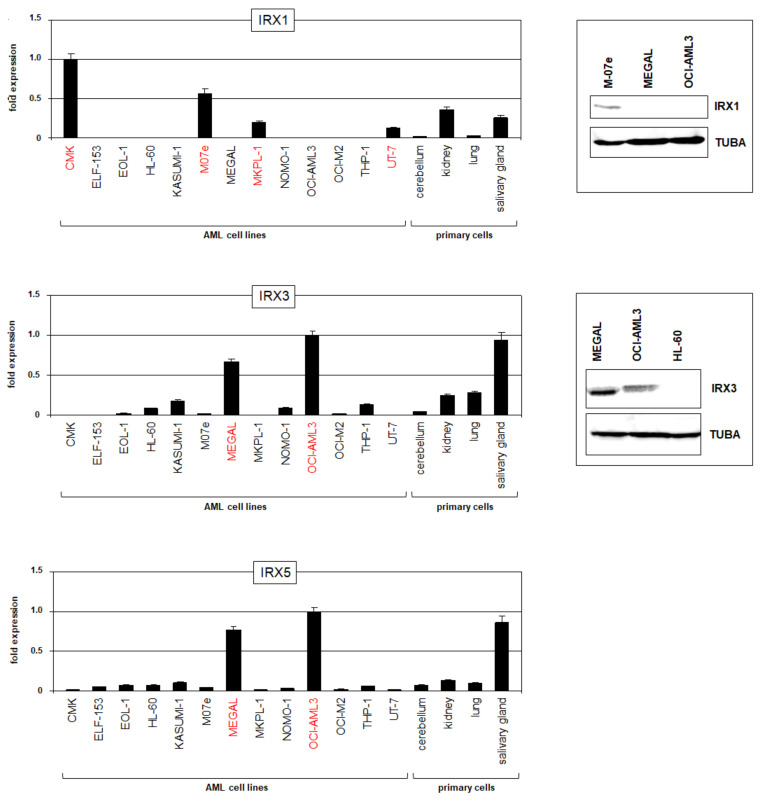
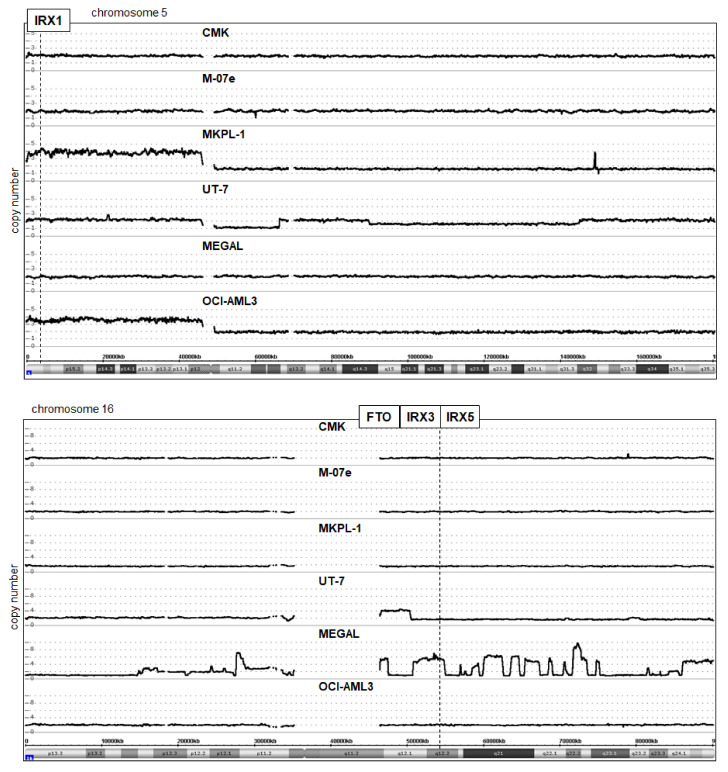
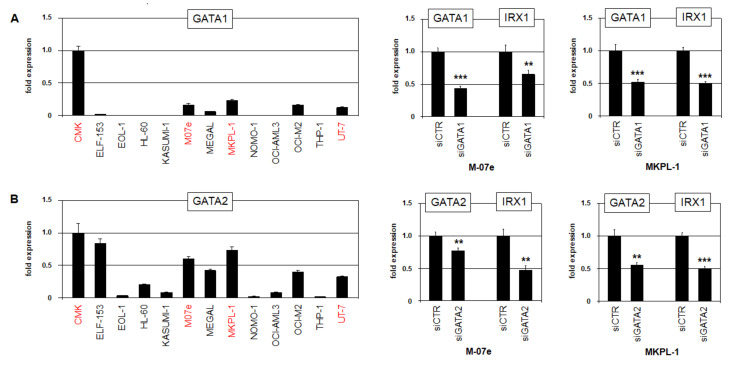
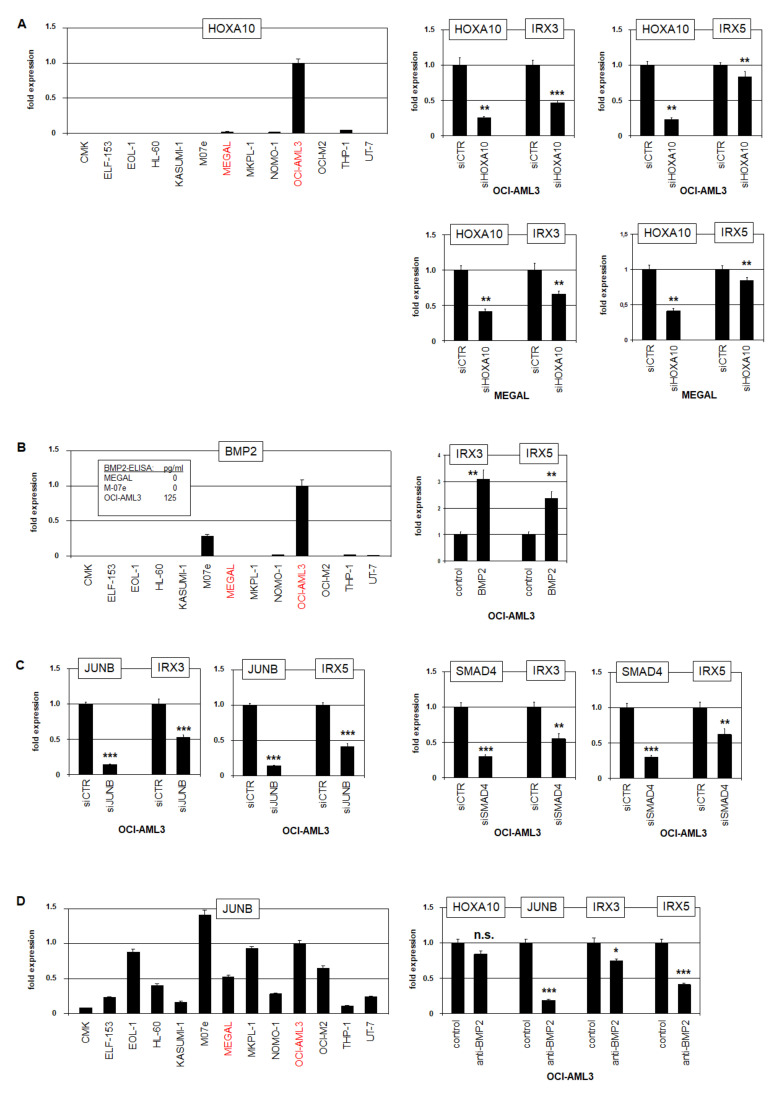
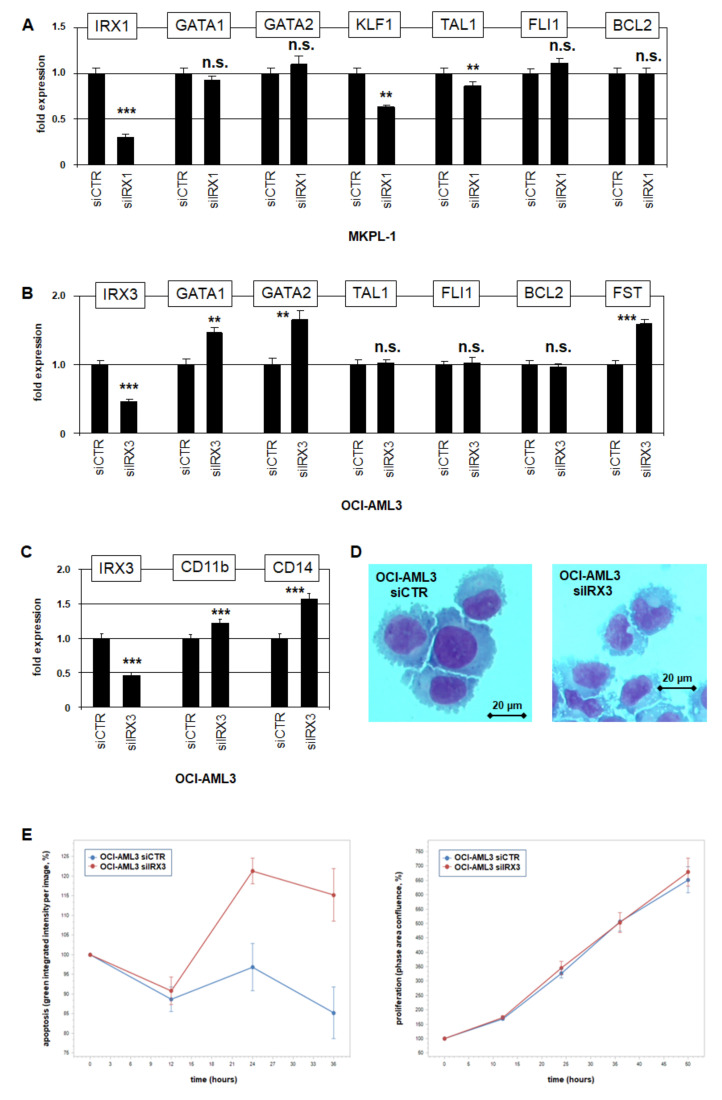
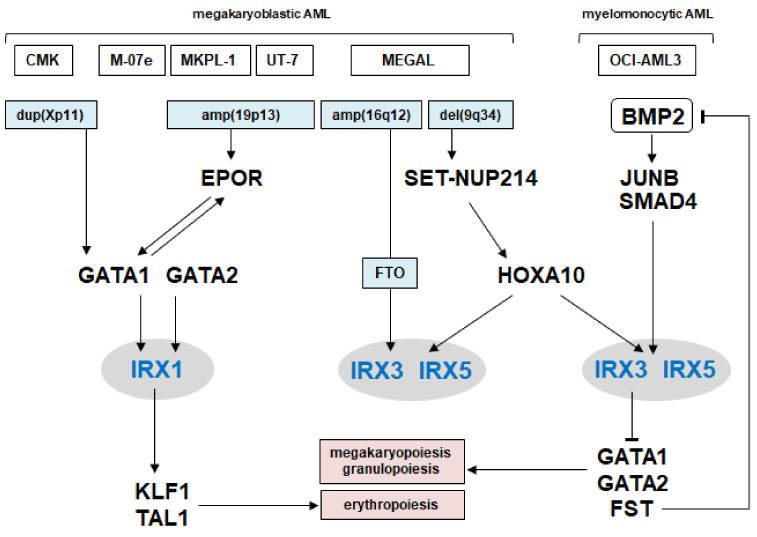
Homeobox genes encode transcription factors that control basic developmental decisions. Knowledge of their hematopoietic activities casts light on normal and malignant immune cell development. Recently, we constructed the so-called lymphoid TALE-code that codifies expression patterns of all active TALE class homeobox genes in early hematopoiesis and lymphopoiesis. Here, we present the corresponding myeloid TALE-code to extend this gene signature, covering the entire hematopoietic system. The collective data showed expression patterns for eleven TALE homeobox genes and highlighted the exclusive expression of IRX1 in megakaryocyte-erythroid progenitors (MEPs), implicating this TALE class member in a specific myeloid differentiation process. Analysis of public profiling data from acute myeloid leukemia (AML) patients revealed aberrant activity of IRX1 in addition to IRX3 and IRX5, indicating an oncogenic role for these TALE homeobox genes when deregulated. Screening of RNA-seq data from 100 leukemia/lymphoma cell lines showed overexpression of IRX1, IRX3, and IRX5 in megakaryoblastic and myelomonocytic AML cell lines, chosen as suitable models for studying the regulation and function of these homeo-oncogenes. Genomic copy number analysis of IRX-positive cell lines demonstrated chromosomal amplification of the neighboring IRX3 and IRX5 genes at position 16q12 in MEGAL, underlying their overexpression in this cell line model. Comparative gene expression analysis of these cell lines revealed candidate upstream factors and target genes, namely the co-expression of GATA1 and GATA2 together with IRX1, and of BMP2 and HOXA10 with IRX3/IRX5. Subsequent knockdown and stimulation experiments in AML cell lines confirmed their activating impact in the corresponding IRX gene expression. Furthermore, we demonstrated that IRX1 activated KLF1 and TAL1, while IRX3 inhibited GATA1, GATA2, and FST. Accordingly, we propose that these regulatory relationships may represent major physiological and oncogenic activities of IRX factors in normal and malignant myeloid differentiation, respectively. Finally, the established myeloid TALE-code is a useful tool for evaluating TALE homeobox gene activities in AML.

Keywords: HOX-code; NKL-code; PBX1; TALE-code; TBX-code; homeodomain.


Conflict of interest statement

The authors declare no conflict of interest.

Figures

Figure 1
Figure 1
Myeloid TALE-code. This diagram summarizes the screening results for expression analyses of TALE homeobox genes (red) in early hematopoiesis and myelopoiesis. We have termed this expression pattern myeloid TALE-code. Expression of IRX1 is highlighted in blue (arrowhead). Abbreviations: cDC, conventional dendritic cell; CDP, common dendritic progenitor; CFU ery, erythroid colony forming unit; CLP, common lymphoid progenitor; CMP, common myeloid progenitor; ery, erythrocyte; GMP, granulo-myeloid progenitor; granu, granulocyte; HSPC, hematopoietic stem and progenitor cell; inter ery, intermediate stage erythroblast; late ery, pyknotio-stage erythroblast; LMPP, lymphomyelo-primed progenitor; macro, macrophage; mast, mast cell; MDP, monocyte dendritic cell progenitor; mega, megakaryocyte; MEP, megakaryocytic-erythroid progenitor; metamyelo, metamyelocyte; moDC, monocyte-derived dendritic cell; mono, monocyte; pDC, plasmacytoid dendritic cell; pro ery, pro-erythroblast; pro myelo early/late, early/late promyelocyte.
Figure 2
Figure 2
IRX gene activities in AML cell lines. Expression analyses of TALE homeobox genes IRX1, IRX3, and IRX5 in AML cell lines and primary controls as performed by RQ-PCR (left). Cell lines showing significant expression levels of the corresponding IRX genes are shown in red. P-values are indicated by asterisks. Western blot analyses (right) were performed for IRX1 and IRX3 in selected AML cell lines. TUBA served as loading control.
Figure 3
Figure 3
Genomic analysis of AML cell lines. Copy number states for chromosome 5 (above) and chromosome 16 (below) of IRX1-positive cell lines CMK, M-07e, MKPL-1, and UT-7, and of IRX3/IRX5-positive AML cell lines MEGAL and OCI-AML3 were determined by genomic profiling analysis. A copy number gain for IRX1 (located at 5p15) was detected in MKPL-1 and OCI-AML3. Amplification of FTO, IRX3, and IRX5 (16q12) was detected among multiple complex chromosome 16 rearrangements in MEGAL.
Figure 4
Figure 4
Transcriptional regulation of IRX1. Expression analysis of (A) GATA1 and (B) GATA2 by RQ-PCR in selected AML cell lines (left). Transcript levels are indicated in relation to CMK. Cell lines expressing significant levels of IRX1 are highlighted in red. SiRNA-mediated knockdown of (A) GATA1 and (B) GATA2 demonstrates activations of IRX1 and IRX5 in AML cell lines M-07e and MKPL-1 (right). p-values are indicated by asterisks (** p < 0.01, *** p < 0.001).
Figure 5
Figure 5
Transcriptional regulation of IRX3 and IRX5. (A) RQ-PCR analysis of HOXA10 in AML cell lines (left). Transcript levels are indicated in relation to OCI-AML3, and IRX3/IRX5-positive cell lines are indicated in red. RQ-PCR analysis of OCI-AML3 (above) and MEGAL (below) showed downregulation of IRX3 and IRX5 after siRNA-mediated knockdown of HOXA10 (right). (B) RQ-PCR analysis of BMP2 in AML cell lines (left). Transcript levels are indicated in relation to OCI-AML3. ELISA results for BMP2 protein levels in AML cell line supernatants are inserted. RQ-PCR analysis of OCI-AML3 treated with BMP2 resulted in the upregulation of IRX3 and IRX5 (right). (C) RQ-PCR analysis of OCI-AML3 after siRNA-mediated knockdown of JUNB (left) and SMAD4 (right) showed downregulation of IRX3 and IRX5. (D) RQ-PCR analysis of JUNB in AML cell lines (left). Transcript levels are indicated in relation to OCI-AML3. RQ-PCR analysis of OCI-AML3 treated with inhibitory BMP2-antibody resulted in downregulation of JUNB, IRX3, and IRX5, while HOXA10 was not significantly affected (right). p-values are indicated by asterisks (* p < 0.05, ** p < 0.01, *** p < 0.001, n.s. not significant).
Figure 6
Figure 6
Target gene analyses for IRX1 and IRX3 in AML cell lines. (A) RQ-PCR analysis of MKPL-1 treated for siRNA-mediated knockdown of IRX1 resulted in downregulation of KLF1 and TAL1, while GATA1, GATA2, FLI1, and BCL2 remained unaffected. Thus, IRX1 activates KLF1 and TAL1. (B) RQ-PCR analysis of OCI-AML3 treated for siRNA-mediated knockdown of IRX3 resulted in upregulation of GATA1, GATA2, and FST, while TAL1, FLI1 and BCL2 remained unaffected. Thus, IRX3 inhibits GATA1, GATA2, and FST. (C) RQ-PCR analysis of OCI-AML3 treated for siRNA-mediated knockdown of IRX3 resulted in upregulation of myeloid differentiation marker CD11b/ITGAM and CD14. (D) SiRNA-mediated knockdown of IRX3 in OCI-AML3 cells induced morphological alterations of their nuclei, as shown by Giemsa–May–Grünwald staining. (E) Live-cell imaging analyses of OCI-AML3 treated for siRNA-mediated knockdown of IRX3 showed increased levels of apoptosis (left), while proliferation remained unaffected (right). Standard deviations are indicated as bars. p-values are indicated by asterisks (** p < 0.01, *** p < 0.001, n.s. not significant).
Figure 7
Figure 7
Gene regulatory network of IRX1 and IRX3/IRX5 in AML. The figure summarizes the results of this study. TALE homeobox genes IRX1, IRX3, and IRX5 are located centrally, chromosomal aberrations lie upstream, and developmental TFs and BMP2-signaling components both upstream and downstream. Thus, these IRX genes are part of a regulatory gene network, controlling myeloid differentiation.

Similar articles

Cited by

References

    1. Liggett L.A., Sankaran V.G. Unraveling Hematopoiesis through the Lens of Genomics. Cell. 2020;182:1384–1400. doi: 10.1016/j.cell.2020.08.030. - DOI - PMC - PubMed
    1. Wilson N.K., Foster S.D., Wang X., Knezevic K., Schütte J., Kaimakis P., Chilarska P.M., Kinston S., Ouwehand W.H., Dzierzak E., et al. Combinatorial transcriptional control in blood stem/progenitor cells: Genome-wide analysis of ten major transcriptional regulators. Cell Stem Cell. 2010;7:532–544. doi: 10.1016/j.stem.2010.07.016. - DOI - PubMed
    1. Kucinski I., Wilson N.K., Hannah R., Kinston S.J., Cauchy P., Lenaerts A., Grosschedl R., Göttgens B. Interactions between lineage-associated transcription factors govern haematopoietic progenitor states. EMBO. J. 2020;39:e104983. doi: 10.15252/embj.2020104983. - DOI - PMC - PubMed
    1. Rothenberg E.V. Transcriptional Control of Early T and B Cell Developmental Choices. Annu. Rev. Immunol. 2014;32:283–321. doi: 10.1146/annurev-immunol-032712-100024. - DOI - PMC - PubMed
    1. Bürglin T.R., Affolter M. Homeodomain proteins: An update. Chromosoma. 2015;125:497–521. doi: 10.1007/s00412-015-0543-8. - DOI - PMC - PubMed

MeSH terms