. 2022 Mar 16;23(6):3201.
doi: 10.3390/ijms23063201.

Inducible Systemic Gcn1 Deletion in Mice Leads to Transient Body Weight Loss upon Tamoxifen Treatment Associated with Decrease of Fat and Liver Glycogen Storage

Affiliations

Inducible Systemic Gcn1 Deletion in Mice Leads to Transient Body Weight Loss upon Tamoxifen Treatment Associated with Decrease of Fat and Liver Glycogen Storage

Jun Liu et al. Int J Mol Sci. .

Abstract

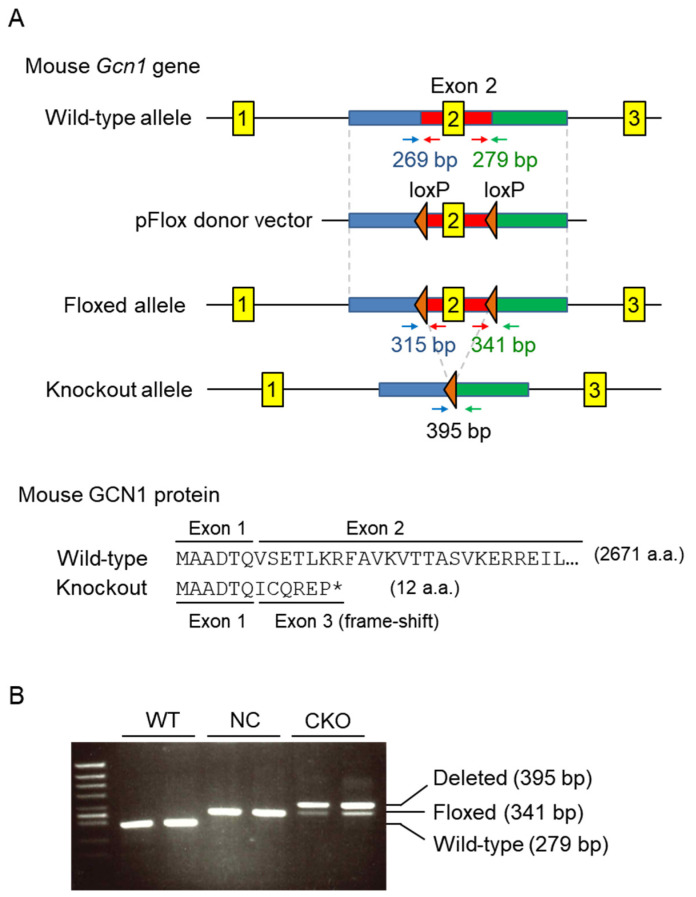
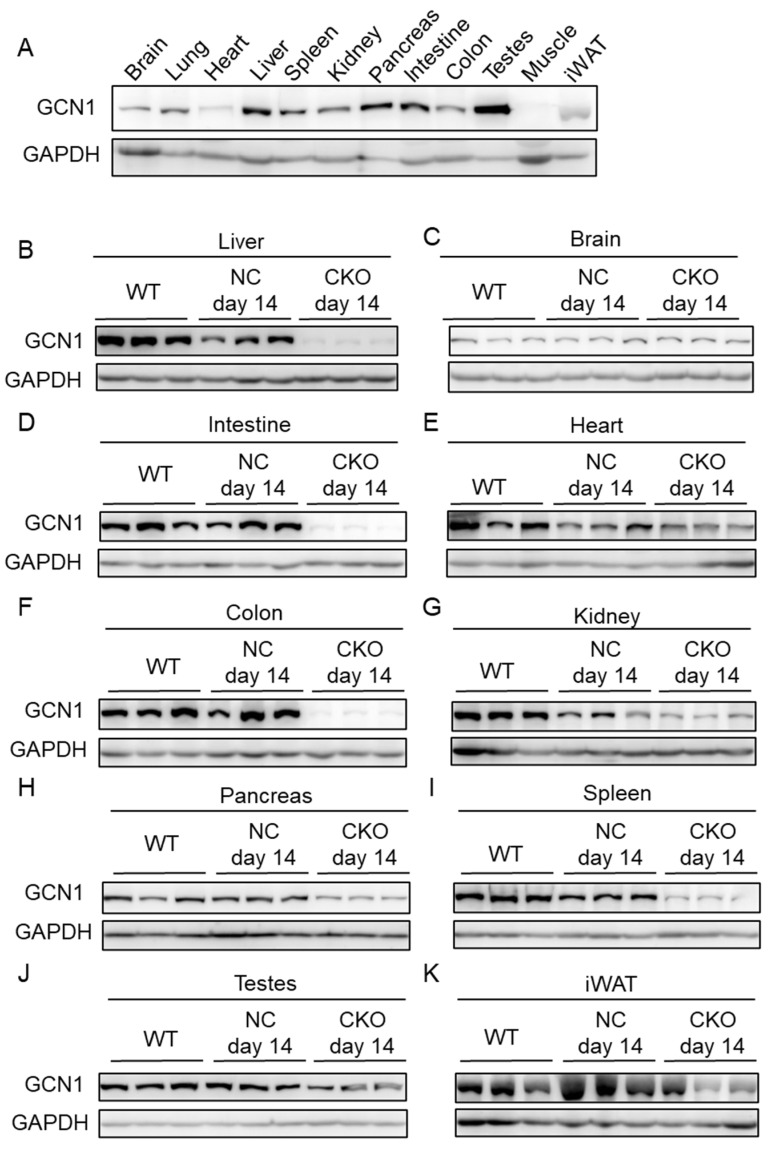
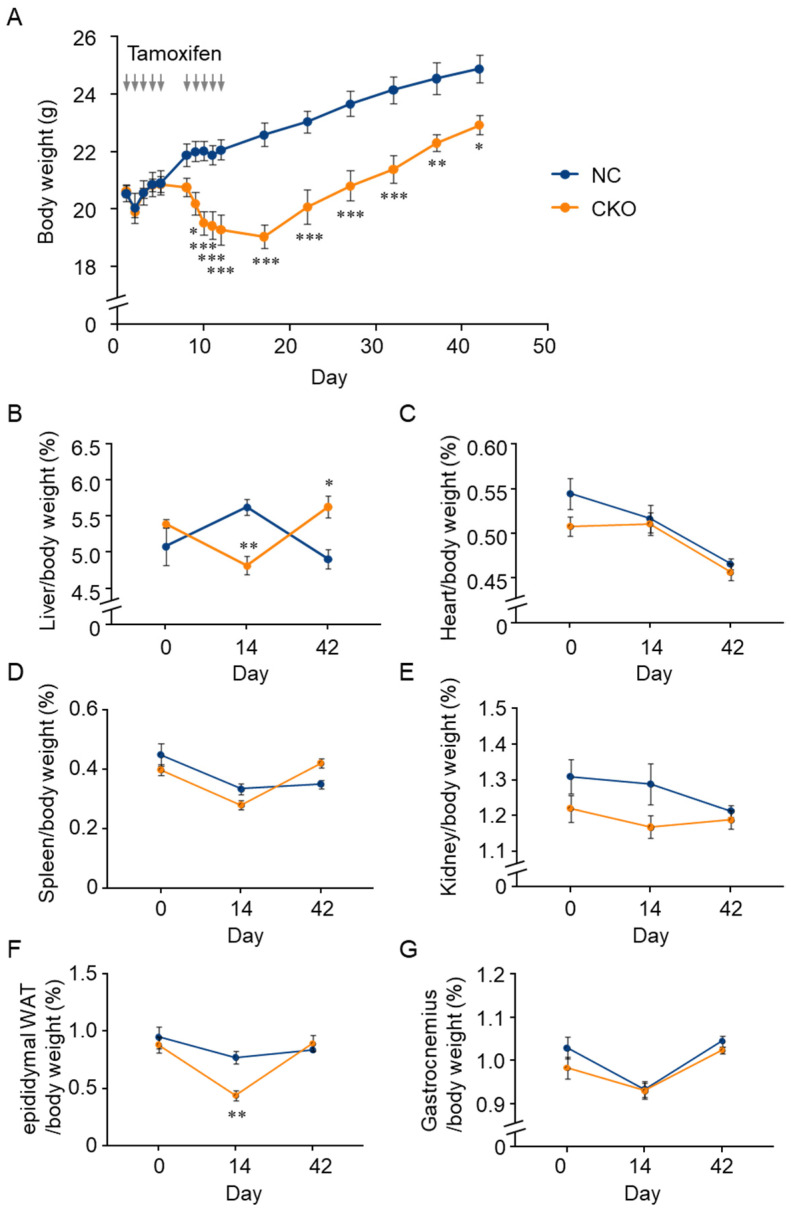
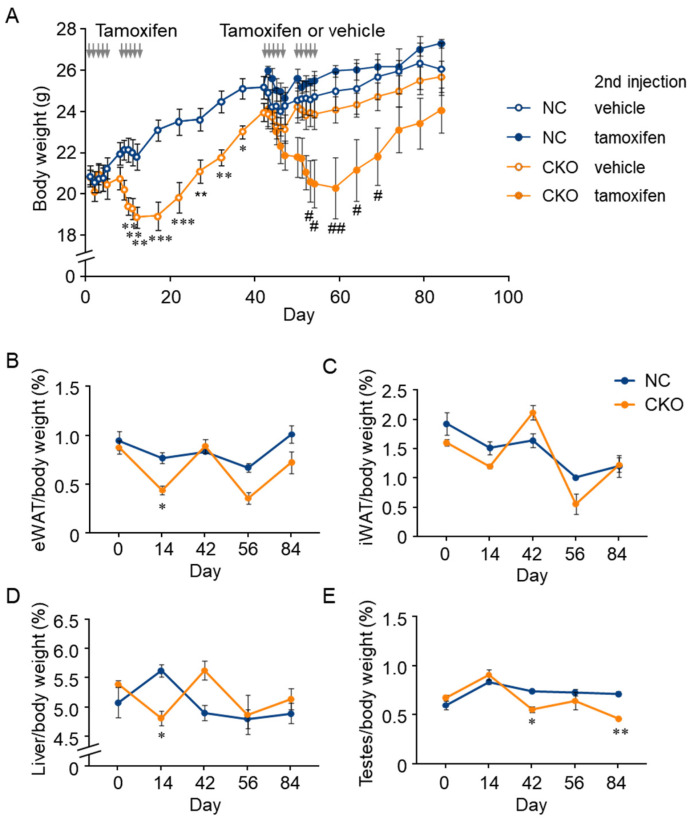
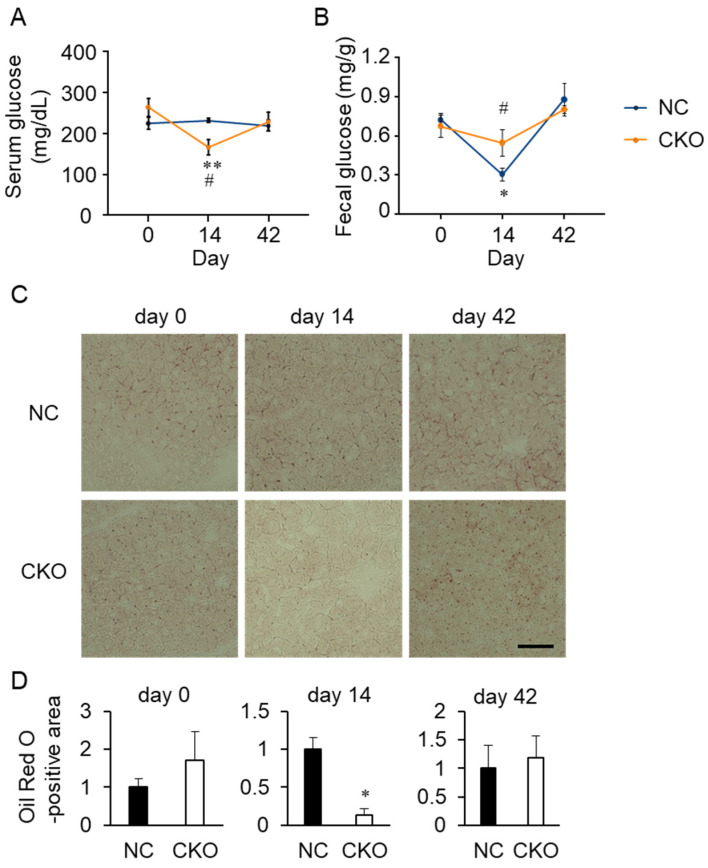
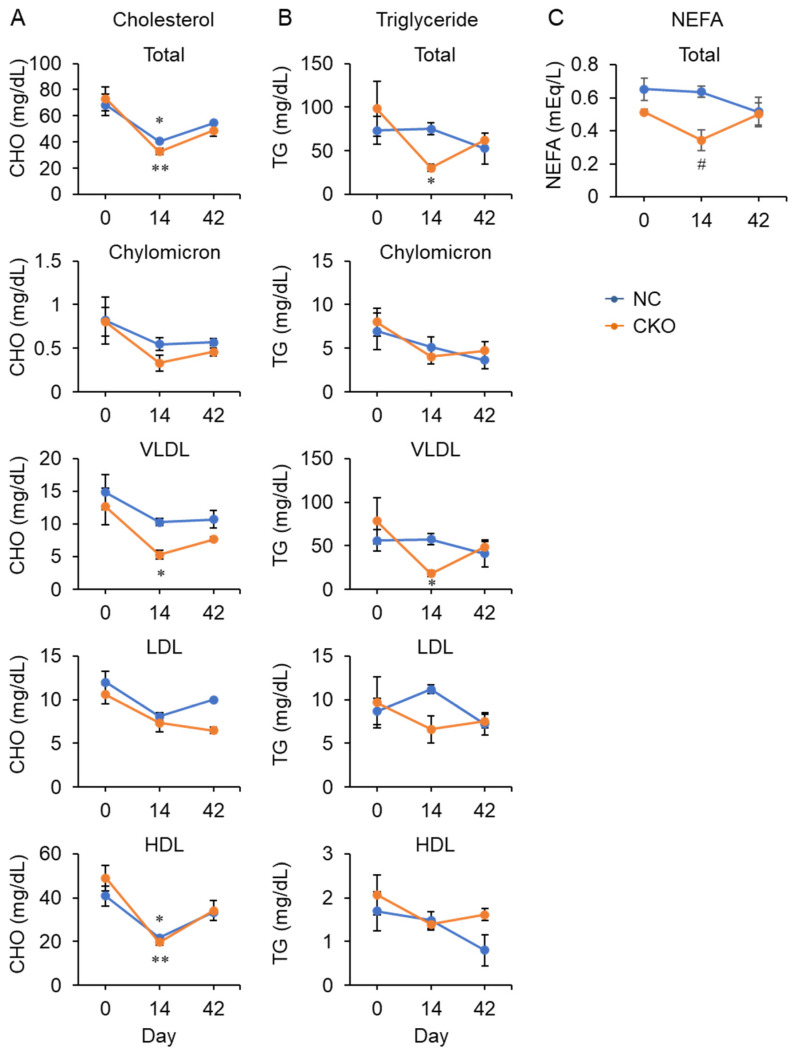
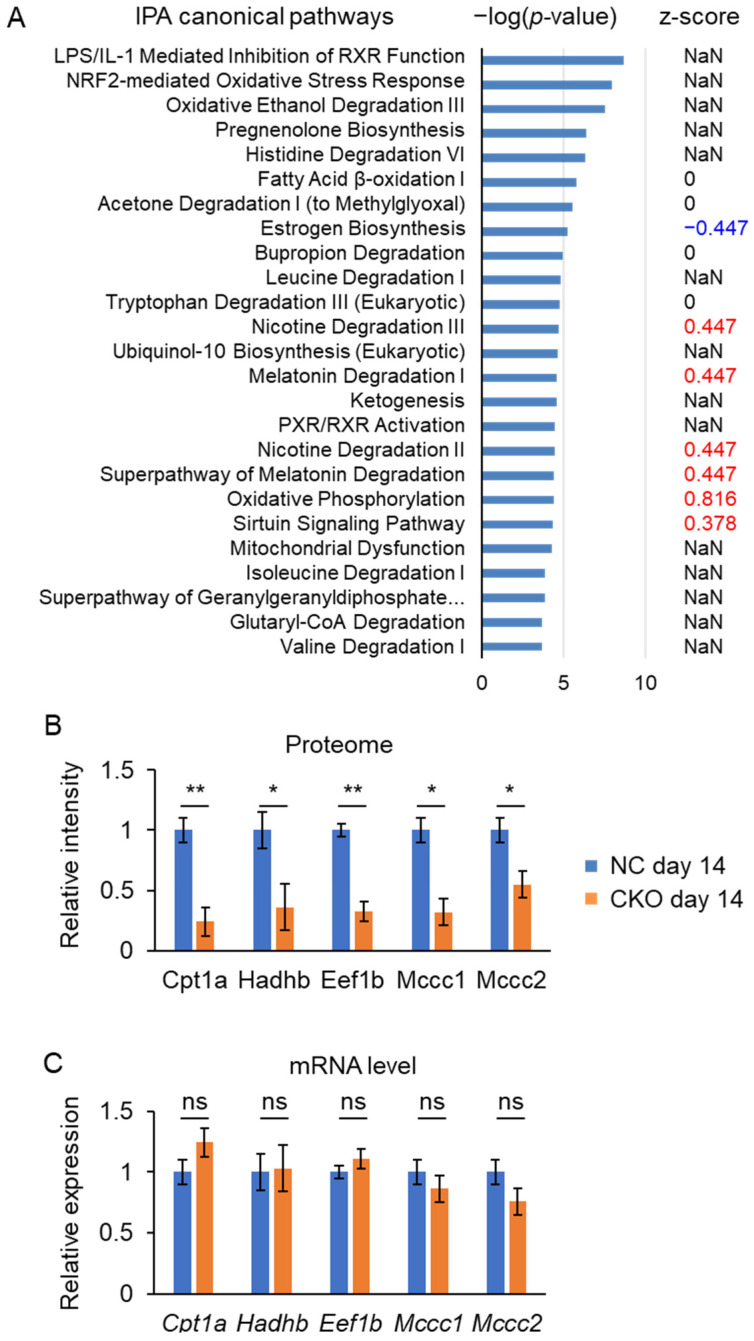
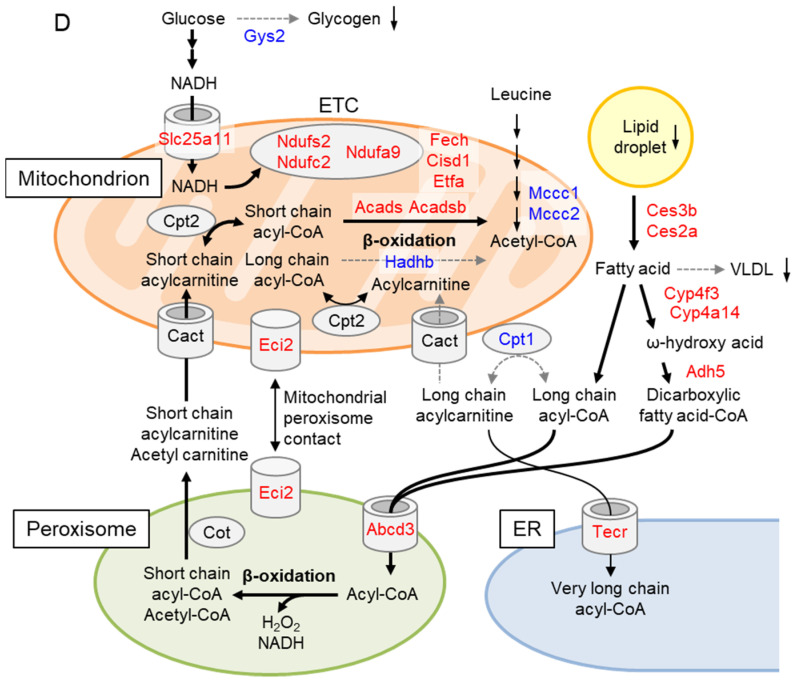
GCN1 is an evolutionarily-conserved ribosome-binding protein that mediates the amino acid starvation response as well as the ribotoxic stress response. We previously demonstrated that Gcn1 mutant mice lacking the GCN2-binding domain suffer from growth retardation and postnatal lethality via GCN2-independent mechanisms, while Gcn1-null mice die early in embryonic development. In this study, we explored the role of GCN1 in adult mice by generating tamoxifen-inducible conditional knockout (CKO) mice. Unexpectedly, the Gcn1 CKO mice showed body weight loss during tamoxifen treatment, which gradually recovered following its cessation. They also showed decreases in liver weight, hepatic glycogen and lipid contents, blood glucose and non-esterified fatty acids, and visceral white adipose tissue weight with no changes in food intake and viability. A decrease of serum VLDL suggested that hepatic lipid supply to the peripheral tissues was primarily impaired. Liver proteomic analysis revealed the downregulation of mitochondrial β-oxidation that accompanied increases of peroxisomal β-oxidation and aerobic glucose catabolism that maintain ATP levels. These findings show the involvement of GCN1 in hepatic lipid metabolism during tamoxifen treatment in adult mice.

Keywords: GCN1; VLDL; body weight loss; lipid storage; tamoxifen toxicity.


Conflict of interest statement

The authors declare no conflict of interest.

Figures

Figure 1
Figure 1
Tamoxifen-induced Gcn1 exon2 conditional knockout. (A) A schematic diagram explaining the method for establishing Gcn1 CKO mice. The LoxP sites were inserted by CRISPR/Cas9 and pFlox donor vector targeting Gcn1 exon 2. The genotyping primers surrounding loxP sites are indicated by arrows. Deletion of Gcn1 exon 2 results in a frame-shift with premature stop codon (*) in exon 3. (B) Genotyping of the wild-type (WT) mice, Gcn1fl/fl::R26+/+ mice that were treated with tamoxifen (NC), and Gcn1fl/fl::R26Cre/Cre mice that were treated with tamoxifen (CKO). Genomic DNA samples that were extracted from the tail were used to distinguish right loxP in the WT allele (279 bp), floxed (341 bp), and deleted allele in CKO (395 bp).
Figure 2
Figure 2
Expression of GCN1 in the tissues of wild-type and CKO mice. (A) GCN1 protein expression in the tissues of wild-type male mice (six weeks old). GCN1 and the loading control, GAPDH, were detected by immunoblotting. (BK) GCN1 expression in untreated wild-type mice (day 0), and tamoxifen-administrated Gcn1fl/fl::R26+/+ (NC, day 14) and Gcn1fl/fl::R26Cre/Cre (CKO, day 14) mice. GCN1 expression was examined in the liver (B), brain (C), intestine (D), heart (E), colon (F), kidney (G), pancreas (H), spleen (I), testes (J), and inguinal white adipose tissue (iWAT; (K)).
Figure 3
Figure 3
Body weight change of tamoxifen-induced Gcn1 CKO mice. (A) Body weight change of Gcn1fl/fl and Gcn1fl/fl::R26Cre/Cre mice that were treated with tamoxifen. Male mice at five to six weeks old were injected 10 times with 75 mg/kg tamoxifen as indicated by the gray arrows, which generated negative control (NC) and conditional knockout (CKO), respectively. The body weight was recorded every day during the injection period, and then every five days until day 42 (n = 6 per group). The data are presented as the mean ± SEM. Statistical significance was analyzed by two-way ANOVA and Sidak method. (BG) The tissue weight change in CKO mice. The weight of the liver (B), heart (C), spleen (D), kidney (E), epididymal WAT (F), and gastrocnemius (G) was normalized to body weight (n = 6, except for gastrocnemius in the NC group, n = 5). The data are presented as the mean ± SEM. Statistical significance was analyzed by two-way ANOVA and Tukey’s test. * p < 0.05, ** p < 0.01, *** p < 0.001.
Figure 4
Figure 4
Combination of GCN1-deletion and tamoxifen-treatment induces the loss of body weight gain. (A) Body weight change of CKO mice that were treated with two rounds of tamoxifen injections. The Gcn1 CKO (n = 6) or NC (n = 6) mice were randomly separated (n = 3 per group), and then subjected to a second round of injections of tamoxifen or control vehicle at day 43 by the same regimen. Statistical analysis was carried out by two-way ANOVA and Tukey’s test. * p < 0.05, ** p < 0.01, *** p < 0.001 compared with NC/tamoxifen; # p < 0.05, ## p < 0.01 compared with the CKO/vehicle. (BE) Tissue weight change upon two rounds of injections of tamoxifen or control vehicle were analyzed in the epididymal WAT (B), inguinal WAT (C), liver (D), and testes (E). The data in (BE) are presented as the mean ± SEM (n = 3) and statistically analyzed by two-way ANOVA and Tukey’s test. * p < 0.05, ** p < 0.01 compared with NC group.
Figure 5
Figure 5
Impaired glucose and fat metabolism in tamoxifen-induced Gcn1 CKO mice. (A) The serum glucose in the NC and CKO mice were measured as described in the Materials and Methods. The data are presented as the mean ± SEM of NC/day 0 (n = 3), CKO/day 0 (n = 3), NC/day 14 (n = 7), CKO/day 14 (n = 7), NC/day 42 (n = 4), and CKO/day 42 (n = 3). Statistical analysis was carried out by two-way ANOVA and Tukey’s test. ** p < 0.01 compared with day 0, # p < 0.05 compared with NC. (B) Fecal glucose was quantified as described in the Materials and Methods (n = 3). Statistical analysis was carried out by two-way ANOVA and Tukey’s test. * p < 0.05, compared with day 0; # p < 0.05 compared with NC. (C) Frozen liver sections were subjected to Oil Red O staining to examine the lipid accumulation. Scale bar, 50 µm. (D) The area of Oil Red O-positive region per image was quantified by ImageJ and normalized to NC. The data are expressed as the mean ± SEM (n = 3 per group). Statistical analysis was carried out by t-test. * p < 0.05.
Figure 6
Figure 6
Alteration of the lipoprotein in the Gcn1 CKO mouse. (AC) Amounts of cholesterol (A), triglyceride (B), and NEFA (C) were quantified in the total serum and in fractions of chylomicron, VLDL, LDL, and HDL. The data are expressed as the mean ± SEM of NC/day 0 (n = 3), CKO/day 0 (n = 3), NC/day 14 (n = 4), CKO/day 14 (n = 4), NC/day 42 (n = 3), and CKO/day 42 (n = 2) for cholesterol and triglyceride (A,B) and n = 4 per group for NEFA (C). Statistical analysis was carried out by two-way ANOVA and Tukey’s test. * p < 0.05, ** p < 0.01 compared with day 0, # p < 0.05 compared with NC.
Figure 7
Figure 7
Proteomic analysis of Gcn1 CKO mouse liver. (A) Top 25 canonical pathways that were analyzed by IPA of 137 proteins correlated with a discriminant model in OPLS-DA correlation [p1(corr) > 0.6 or < −0.6]. −Log(p-value) and z-score (activation in red, inactivation in blue, and neutral and not a number, NaN in black). (B) Results of the proteomic quantification of proteins markedly decreased in CKO liver are expressed as the mean ± SEM (n = 4) and normalized by the value in the NC liver. (C) mRNA levels of transcripts that are listed in (B) were quantified by RT-qPCR and normalized by Cypa, with that in NC liver expressed as 1. The data are expressed as the mean ± SEM (n = 4 per group). The data were statistically compared by t-test. * p < 0.05, ** p < 0.01, not significant (n.s.). (D) Summarized pathways of lipid metabolism in the CKO mouse liver. Proteins significantly increased and decreased (except for Acads, p = 0.057) in CKO are shown in red and blue, respectively. Decreases in lipids that were determined by the other analyses are indicated by downward arrows. The pathways predicted to be attenuated are indicated by a gray arrow with a dashed line and increased are indicated by a bold arrow, respectively.
Figure 7
Figure 7
Proteomic analysis of Gcn1 CKO mouse liver. (A) Top 25 canonical pathways that were analyzed by IPA of 137 proteins correlated with a discriminant model in OPLS-DA correlation [p1(corr) > 0.6 or < −0.6]. −Log(p-value) and z-score (activation in red, inactivation in blue, and neutral and not a number, NaN in black). (B) Results of the proteomic quantification of proteins markedly decreased in CKO liver are expressed as the mean ± SEM (n = 4) and normalized by the value in the NC liver. (C) mRNA levels of transcripts that are listed in (B) were quantified by RT-qPCR and normalized by Cypa, with that in NC liver expressed as 1. The data are expressed as the mean ± SEM (n = 4 per group). The data were statistically compared by t-test. * p < 0.05, ** p < 0.01, not significant (n.s.). (D) Summarized pathways of lipid metabolism in the CKO mouse liver. Proteins significantly increased and decreased (except for Acads, p = 0.057) in CKO are shown in red and blue, respectively. Decreases in lipids that were determined by the other analyses are indicated by downward arrows. The pathways predicted to be attenuated are indicated by a gray arrow with a dashed line and increased are indicated by a bold arrow, respectively.

Similar articles

Cited by

References

    1. Castilho B.A., Shanmugam R., Silva R.C., Ramesh R., Himme B.M., Sattlegger E. Keeping the eIF2 alpha kinase Gcn2 in check. Biochim. Biophys. Acta. 2014;1843:1948–1968. doi: 10.1016/j.bbamcr.2014.04.006. - DOI - PubMed
    1. Yamazaki H., Kasai S., Mimura J., Ye P., Inose-Maruyama A., Tanji K., Wakabayashi K., Mizuno S., Sugiyama F., Takahashi S., et al. Ribosome binding protein GCN1 regulates the cell cycle and cell proliferation and is essential for the embryonic development of mice. PLoS Genet. 2020;16:e1008693. doi: 10.1371/journal.pgen.1008693. - DOI - PMC - PubMed
    1. Harding H.P., Novoa I., Zhang Y., Zeng H., Wek R., Schapira M., Ron D. Regulated translation initiation controls stress-induced gene expression in mammalian cells. Mol. Cell. 2000;6:1099–1108. doi: 10.1016/S1097-2765(00)00108-8. - DOI - PubMed
    1. Zhang P., McGrath B.C., Reinert J., Olsen D.S., Lei L., Gill S., Wek S.A., Vattem K.M., Wek R.C., Kimball S.R., et al. The GCN2 eIF2alpha kinase is required for adaptation to amino acid deprivation in mice. Mol. Cell Biol. 2002;22:6681–6688. doi: 10.1128/MCB.22.19.6681-6688.2002. - DOI - PMC - PubMed
    1. Jang S.H., Kim A.R., Park N.H., Park J.W., Han I.S. DRG2 Regulates G2/M Progression via the Cyclin B1-Cdk1 Complex. Mol. Cells. 2016;39:699–704. doi: 10.14348/molcells.2016.0149. - DOI - PMC - PubMed