Identification of Novel Genes Involved in Hyperglycemia in Mice
- PMID: 35328627
- PMCID: PMC8949927
- DOI: 10.3390/ijms23063205
Identification of Novel Genes Involved in Hyperglycemia in Mice
Abstract
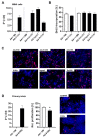
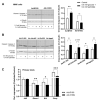
Current attempts to prevent and manage type 2 diabetes have been moderately effective, and a better understanding of the molecular roots of this complex disease is important to develop more successful and precise treatment options. Recently, we initiated the collective diabetes cross, where four mouse inbred strains differing in their diabetes susceptibility were crossed with the obese and diabetes-prone NZO strain and identified the quantitative trait loci (QTL) Nidd13/NZO, a genomic region on chromosome 13 that correlates with hyperglycemia in NZO allele carriers compared to B6 controls. Subsequent analysis of the critical region, harboring 644 genes, included expression studies in pancreatic islets of congenic Nidd13/NZO mice, integration of single-cell data from parental NZO and B6 islets as well as haplotype analysis. Finally, of the five genes (Acot12, S100z, Ankrd55, Rnf180, and Iqgap2) within the polymorphic haplotype block that are differently expressed in islets of B6 compared to NZO mice, we identified the calcium-binding protein S100z gene to affect islet cell proliferation as well as apoptosis when overexpressed in MIN6 cells. In summary, we define S100z as the most striking gene to be causal for the diabetes QTL Nidd13/NZO by affecting β-cell proliferation and apoptosis. Thus, S100z is an entirely novel diabetes gene regulating islet cell function.
Keywords: QTL; apoptosis; diabetes; proliferation; β-cell.
Conflict of interest statement
The authors declare no conflict of interest.
Figures


Similar articles
-
Characterization of Nob3, a major quantitative trait locus for obesity and hyperglycemia on mouse chromosome 1.Physiol Genomics. 2009 Jul 9;38(2):226-32. doi: 10.1152/physiolgenomics.00011.2009. Epub 2009 May 26. Physiol Genomics. 2009. PMID: 19470805 Free PMC article.
-
Two Novel Candidate Genes for Insulin Secretion Identified by Comparative Genomics of Multiple Backcross Mouse Populations.Genetics. 2018 Dec;210(4):1527-1542. doi: 10.1534/genetics.118.301578. Epub 2018 Oct 19. Genetics. 2018. PMID: 30341086 Free PMC article.
-
Maternal environment and genotype interact to establish diabesity in mice.Genome Res. 2000 Oct;10(10):1568-78. doi: 10.1101/gr.147000. Genome Res. 2000. PMID: 11042154 Free PMC article.
-
The genetic basis of obesity and type 2 diabetes: lessons from the new zealand obese mouse, a polygenic model of the metabolic syndrome.Results Probl Cell Differ. 2010;52:1-11. doi: 10.1007/978-3-642-14426-4_1. Results Probl Cell Differ. 2010. PMID: 20865367 Review.
-
Diabetes and hypertension in rodent models.Ann N Y Acad Sci. 1997 Sep 20;827:64-84. doi: 10.1111/j.1749-6632.1997.tb51822.x. Ann N Y Acad Sci. 1997. PMID: 9329742 Review.
Cited by
-
E96V Mutation in the Kdelr3 Gene Is Associated with Type 2 Diabetes Susceptibility in Obese NZO Mice.Int J Mol Sci. 2023 Jan 3;24(1):845. doi: 10.3390/ijms24010845. Int J Mol Sci. 2023. PMID: 36614300 Free PMC article.
-
Transcriptomic Signature of Frailty in Older Patients With Cardiovascular Disease Undergoing Cardiac Surgery or TAVI.J Cachexia Sarcopenia Muscle. 2025 Jun;16(3):e13846. doi: 10.1002/jcsm.13846. J Cachexia Sarcopenia Muscle. 2025. PMID: 40468979 Free PMC article.
References
-
- Vogel H., Kamitz A., Hallahan N., Lebek S., Schallschmidt T., Jonas W., Jähnert M., Gottmann P., Zellner L., Kanzleiter T., et al. A collective diabetes cross in combination with a computational framework to dissect the genetics of human obesity and type 2 diabetes. Hum. Mol. Genet. 2018;27:3099–3112. doi: 10.1093/hmg/ddy217. - DOI - PMC - PubMed
-
- Gässler A., Quiclet C., Kluth O., Gottmann P., Schwerbel K., Helms A., Stadion M., Wilhelmi I., Jonas W., Ouni M., et al. Overexpression of Gjb4 impairs cell proliferation and insulin secretion in primary islet cells. Mol. Metab. 2020;41:101042. doi: 10.1016/j.molmet.2020.101042. - DOI - PMC - PubMed
MeSH terms
Grants and funding
LinkOut - more resources
Full Text Sources
Medical
Molecular Biology Databases

