Review
. 2022 Mar 17;23(6):3227.
doi: 10.3390/ijms23063227.

Phosphatidic Acid in Plant Hormonal Signaling: From Target Proteins to Membrane Conformations

Affiliations
Review

Phosphatidic Acid in Plant Hormonal Signaling: From Target Proteins to Membrane Conformations

Yaroslav Kolesnikov et al. Int J Mol Sci. .

Abstract

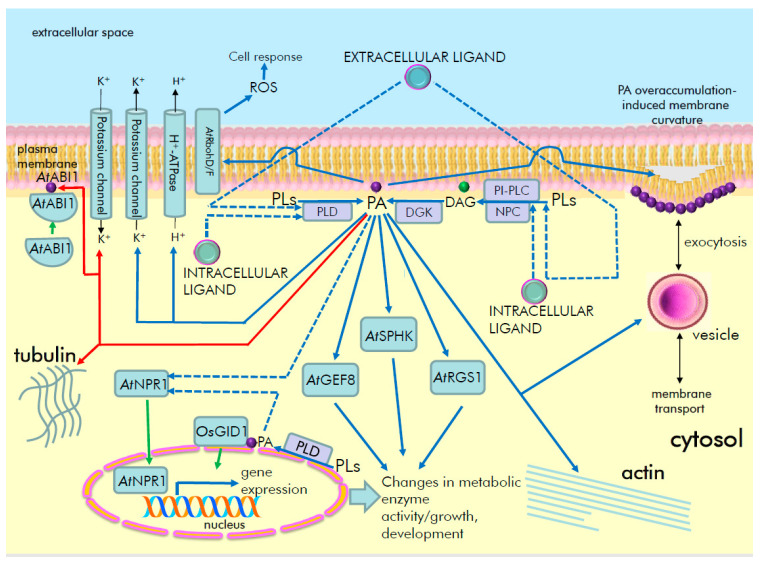
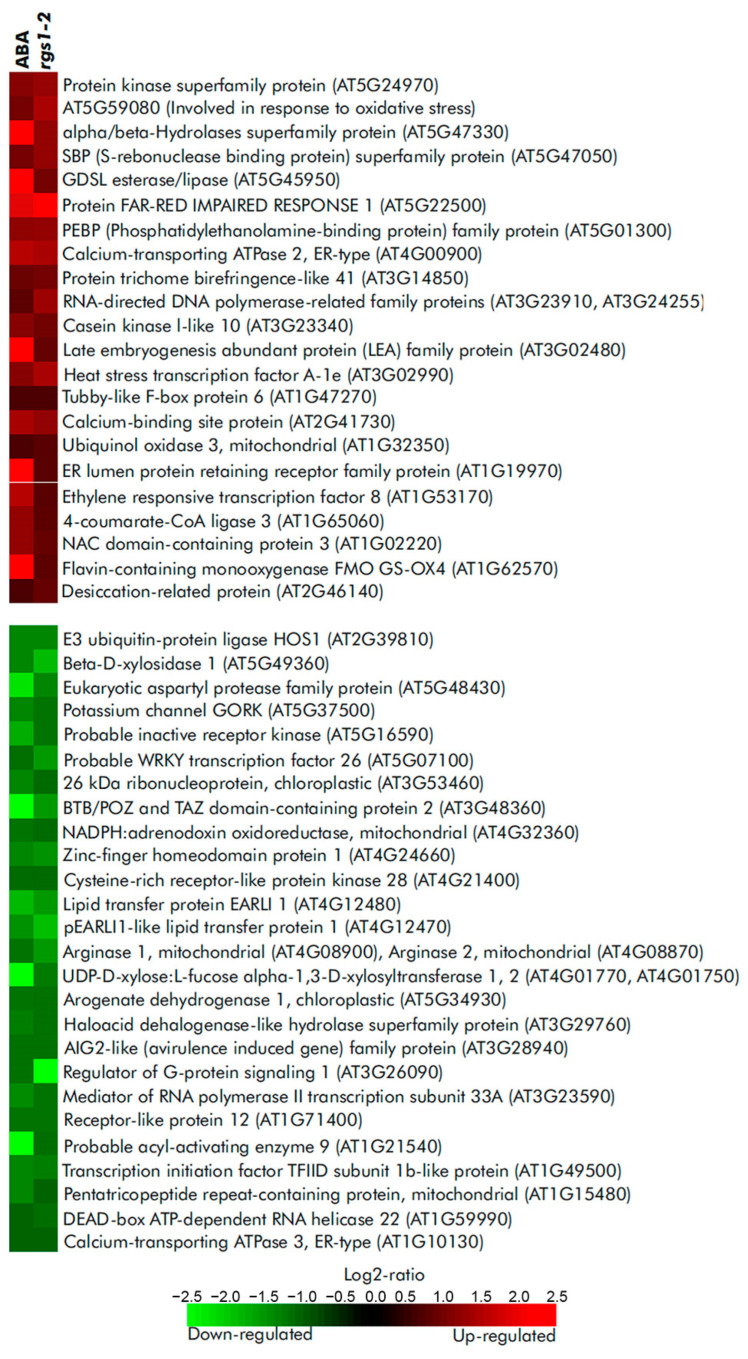
Cells sense a variety of extracellular signals balancing their metabolism and physiology according to changing growth conditions. Plasma membranes are the outermost informational barriers that render cells sensitive to regulatory inputs. Membranes are composed of different types of lipids that play not only structural but also informational roles. Hormones and other regulators are sensed by specific receptors leading to the activation of lipid metabolizing enzymes. These enzymes generate lipid second messengers. Among them, phosphatidic acid (PA) is a well-known intracellular messenger that regulates various cellular processes. This lipid affects the functional properties of cell membranes and binds to specific target proteins leading to either genomic (affecting transcriptome) or non-genomic responses. The subsequent biochemical, cellular and physiological reactions regulate plant growth, development and stress tolerance. In the present review, we focus on primary (genome-independent) signaling events triggered by rapid PA accumulation in plant cells and describe the functional role of PA in mediating response to hormones and hormone-like regulators. The contributions of individual lipid signaling enzymes to the formation of PA by specific stimuli are also discussed. We provide an overview of the current state of knowledge and future perspectives needed to decipher the mode of action of PA in the regulation of cell functions.

Keywords: autophagy; biologically active substance; diacylglycerol kinase; phosphatidic acid; phospholipase; phospholipid; signal transduction; targets.


Conflict of interest statement

The authors declare no conflict of interest.

Figures

Figure 3
Figure 3
PA-binding folds of Arabidopsis proteins involved in plant hormone (abscisic acid) signaling. Shown are amphipathic α-helix projections of a minimal characteristic PA-binding domain obtained with “Heliquest” software [90]. The arrows indicate the hydrophobic moment. Basic and hydrophobic residues are shown in blue and yellow, respectively. PA-binding motifs were obtained from published data: AtRbohD [30], AtABI1 [32], AtRGS1 [91], AtGEF8 [75] and AtSPHK1 [86]. The sequences of PA-binding motifs are as follows: 140-SRELRRVFSRRPSPAVRRFD-159 (AtRbohD), 63-GSESRKVLISRINSPNLNMK-82 (AtABI), 250-QPLLSQISLKKRQNFEFQRM-269 (AtRGS1), 6-ERGLSASKSFNFKRMFDSSS-25 (AtGEF8), 175-KYDGIVCVSGDGILVEVVNG-194 (AtSPHK1).
Figure 6
Figure 6
Meta-analysis of the expression pattern of PA-producing signaling enzymes (PLD, PI-PLC, NPC, DGK) in plants in response to phytohormones. Transcriptomic data were collected from the “Genevestigator” database [55] according to the outputs of classical array experiments (“AT_AFFY_ATH1” platform). Shown here is a heat-map of the relative values of gene expression differences between hormone-treated and mock-treated samples. All statistical data were implemented and provided by the “Genevestigator” database. Color saturation corresponds to the specific level of upregulation (red) and downregulation (green) of gene expression. Genes and corresponding AGI used: AtPLDα1 (At3g15730), AtPLDα2 (At1g52570), AtPLDα3 (At5g25370), AtPLDε (At1g55180), AtPLDβ1 (At2g42010), AtPLDβ2 (At4g00240), AtPLDγ1 (At4g11850), AtPLDγ2 (At4g11830), AtPLDγ3 (At4g11840), AtPLDδ (At4g35790), AtPLDζ1 (At3g16785), AtPLDζ2 (At3g05630); AtPI-PLC1 (At5g58670), AtPI-PLC2 (At3g08510), AtPI-PLC3 (At4g38530), AtPI-PLC4 (At5g58700), AtPI-PLC5 (At5g58690), AtPI-PLC7 (At3g55940), AtPI-PLC8 (At3g47290), AtPI-PLC9 (At3g47220), AtPI-PLC10 (At4G34920), AtPI-PLC11 (At3G19310); AtNPC1 (At1g07230), AtNPC2 (At2g26870), AtNPC3 (At3g03520), AtNPC4 (At3g03530), AtNPC5 (At3g03540), AtNPC6 (At3g48610); AtDGK1 (At5g07920), AtDGK2 (At5g63770), AtDGK3 (At2g18730), AtDGK4 (At5g57690), AtDGK5 (At2g20900), AtDGK6 (At4g28130), AtDGK7 (At4g30340). Gene of AtPI-PLC6 (At2g40116) was not represented in the corresponding platform. A total of 15 experiments were used for the analysis. Abbreviations, short description of experimental conditions (time of treatment, concentrations, tissue types, genotypes) and experiment ID codes for each set of experimental data (from figure left to right) are as follows: ABA, abscisic acid, 10 μM, 3 h, seedlings, Col-0 (AT-00110); ACC, 1-aminocyclopropane-1-carboxylic acid, 10 μM, 3 h, seedlings, Col-0 (AT-00110); ethylene, 5 ppm, 3 h, petiole samples, Col-0 (AT-00013); BA, 6-benzylaminopurine, 10 μM, 1 h, shoot samples, Col-0 (AT-00351); zeatin, 1 μM, 3 h, seedlings, Col-0 (AT-00110); BL, brassinolide, 10 nM, 3 h, seedlings, Col-0 (AT-00110); 24-eBL, 24-epibrassinolide, 0.1 μM, 3 h, dark, seedling sample, Col (AT-00650); GA, gibberellic acid 3, 1 μM, 3 h, seedlings, Col-0 (AT-00110); IAA, indole-acetic acid, 1 μM, 3 h, seedlings, Col-0 (AT-00110); NAA, naphthaleneacetic acid (a synthetic auxin), 10 μM, 2 h, leaf disc samples, Col-0 (AT-00392); MeJa, methyl jasmonate, 10 μM, 3 h, seedlings, Col-0 (AT-00110); OPDA, 12-oxo-phytodienoic acid, 75 μM, 4 h, seedlings, Col-0 (AT-00293); SA, salicylic acid, 2 mM, 1 day, seedlings, Col-0 (AT-00320); RALF, Rapid Alkalinization Factor 1 (peptide, AtRALF), 1 μM, 30 min, seedling sample, Col (AT-00679); strigolactone, GR24, 1 μM, 90 min, max3-9 (a strigolactone deficient mutant) whole plant samples (AT-00404). Original data resources: GSE14961/E-GEOD-14961 datasets for salicylic acid-regulated gene expression (AT-00320), [132,133,134,135,136,137,138,139] for other hormones/biologically active substances.
Figure 1
Figure 1
A diagram representing key enzymatic steps of PA production involved in cell signaling. Phosphatidylcholine (PC) is shown as the principal substrate for PLD-generated PA. Signaling lipid mediators and their active products are highlighted in dark blue. Their non-signaling by-products or lipid precursors are shown in black. Phospholipases involved in DAG and PA metabolism are shown in light blue rectangles. Lipid kinases that phosphorylate DAG and PA are shown in violet rectangles. Lipid phosphatases that dephosphorylate DGPP and PA are shown in light red rectangles. Black arrows indicate pathways that generate signaling lipids; green arrows indicate pathways that generate by-products. Note that no PAK-coding gene is currently identified in Arabidopsis. Chol, choline; DGK, diacylglycerol kinase; DGPP, diacylglycerol pyrophosphate; IP3, inositol 1,4,5-trisphosphate; LPP, lipid phosphate phosphatase; NPC, nonspecific phospholipase C; PAK, phosphatidic acid kinase; PAP, phosphatidic acid phosphatase; PChol, phosphocholine; PC, phosphatidylcholine; PIdes, phosphoinositides, PI-PLC, phosphatidylinositol-specific phospholipase C; PLD, phospholipase D; R1, R2, fatty acids.
Figure 2
Figure 2
Expression levels of genes encoding enzymes of PA signaling at different developmental stages of Arabidopsis thaliana obtained using “Genevestigator” database [55]. Data were collected from data based on classical array experiments (“AT_AFFY_ATH1” platform). The relative values of gene expression (percent of expression potential, log2 scale) are shown. Percent of expression potential denotes the relative transcript abundance given as percentage of the level in the developmental stage where the gene is expressed at maximum level. Color saturation corresponds to the specific level of gene expression. White color signifies an absence of data. Number of samples: germinated seed (515), seedling (2781), young rosette (830), developed rosette (2219), bolting (358), young flower (720), developed flower (1003), flowers and siliques (274), mature siliques (93), senescence (18). Gene identifiers are as follows: PLDα1 (At3g15730), PLDα2 (At1g52570), PLDα3 (At5g25370), PLDε (At1g55180), PLDβ1 (At2g42010), PLDβ2 (At4g00240), PLDγ1 (At4g11850), PLDγ2 (At4g11830), PLDγ3 (At4g11840), PLDδ (At4g35790), PLDζ1 (At3g16785), PLDζ2 (At3g05630); PI-PLC1 (At5g58670), PI-PLC2 (At3g08510), PI-PLC3 (At4g38530), PI-PLC4 (At5g58700), PI-PLC5 (At5g58690), PI-PLC6 (At2g40116), PI-PLC7 (At3g55940), PI-PLC8 (At3g47290), PI-PLC9 (At3g47220), PI-PLC10 (At4G34920), PI-PLC11 (At3G19310); NPC1 (At1g07230), NPC2 (At2g26870), NPC3 (At3g03520), NPC4 (At3g03530), NPC5 (At3g03540), NPC6 (At3g48610); DGK1 (At5g07920), DGK2 (At5g63770), DGK3 (At2g18730), DGK4 (At5g57690), DGK5 (At2g20900), DGK6 (At4g28130), DGK7 (At4g30340). Abbreviations of Arabidopsis developmental stages: G, germinated seed; S, seedling; YR, young rosette; DR, developed rosette; B, bolting; YF, young flower; DF, developed flower; FS, flowers and siliques; MS, mature siliques; S, senescence.
Figure 4
Figure 4
Schematic representation of the PA signaling in plants. Hypothetical receptors lead to activation of lipid signaling enzymes. Key examples of PA-regulated signaling events in hormonal regulation are shown (for details, see the main text); also shown here are PA-induced changes of membrane curvature and subsequent membrane transport events. Headgroups of DAG in a membrane are shown in green; headgroups of PA in crimson; and headgroups of other lipids in pink color. ABI1, ABSCISIC ACID-INSENSITIVE 1, At, Arabidopsis thaliana, DAG, diacylglycerol, DGK, diacylglycerol kinase, GEF8, RopGEF8, guanine nucleotide exchange factor 8, GID, GIBBERELLIN INSENSITIVE DWARF1, NPC, non-specific phospholipase C, NPR1, NONEXPRESSOR OF PATHOGENESIS-RELATED GENES 1, Os, Oryza sativa, PA, phosphatidic acid, PI-PLC, phosphatidylinositol-specific phospholipase C; PLD, phospholipase D, PLs, phospholipids (e.g., phosphatidylcholine, phosphatidylethanolamine), RbohD/F, respiratory burst oxidase protein D/F, RGS1, Regulator of G protein Signaling 1, ROS, reactive oxygen species, SPHK, sphingosine kinase.
Figure 5
Figure 5
A set of similarly regulated genes in ABA-treated Col-0 Arabidopsis plants and in mock-treated rgs1-2 knockout mutants obtained using “Genevestigator” database [55]. Experiments ID used to mine the data are as follows: ABA, AT-00433; rgs1-2, AT-00530. Changes in gene expression (log2-ratio) are color-coded according to the provided scale. Statistical treatment of the data was implemented by “Genevestigator” database. Original data resources [117,118].

Similar articles

Cited by

References

    1. Kwiatek J.M., Carman G.M. Yeast phosphatidic acid phosphatase Pah1 hops and scoots along the membrane phospholipid bilayer. J. Lipid Res. 2020;61:1232–1243. doi: 10.1194/jlr.RA120000937. - DOI - PMC - PubMed
    1. Zhukovsky M.A., Filograna A., Luini A., Corda D., Valente C. Phosphatidic acid in membrane rearrangements. FEBS Lett. 2019;593:2428–2451. doi: 10.1002/1873-3468.13563. - DOI - PubMed
    1. Cai G., Kim S.-C., Li J., Zhou Y., Wang X. Transcriptional regulation of lipid catabolism during seedling establishment. Mol. Plant. 2020;13:984–1000. doi: 10.1016/j.molp.2020.04.007. - DOI - PubMed
    1. Zhang G., Yang J., Chen X., Zhao D., Zhou X., Zhang Y., Wang X., Zhao J. Phospholipase D- and phosphatidic acid-mediated phospholipid metabolism and signaling modulate symbiotic interaction and nodulation in soybean (Glycine max) Plant J. 2021;106:142–158. doi: 10.1111/tpj.15152. - DOI - PubMed
    1. Lavell A.A., Benning C. Cellular organization and regulation of plant glycerolipid metabolism. Plant Cell Physiol. 2019;60:1176–1183. doi: 10.1093/pcp/pcz016. - DOI - PMC - PubMed

LinkOut - more resources