. 2022 Mar 18;23(6):3271.
doi: 10.3390/ijms23063271.

Methylation of Subtelomeric Chromatin Modifies the Expression of the lncRNA TERRA, Disturbing Telomere Homeostasis

Affiliations

Methylation of Subtelomeric Chromatin Modifies the Expression of the lncRNA TERRA, Disturbing Telomere Homeostasis

Diego Oliva-Rico et al. Int J Mol Sci. .

Abstract

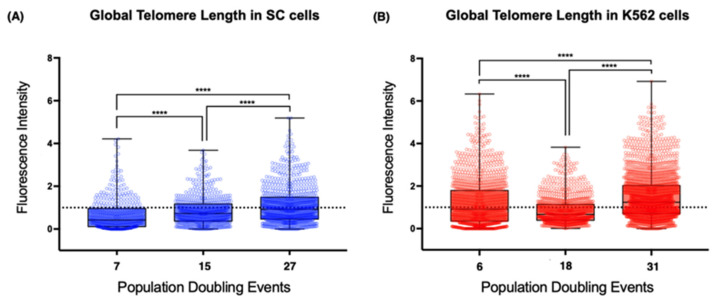
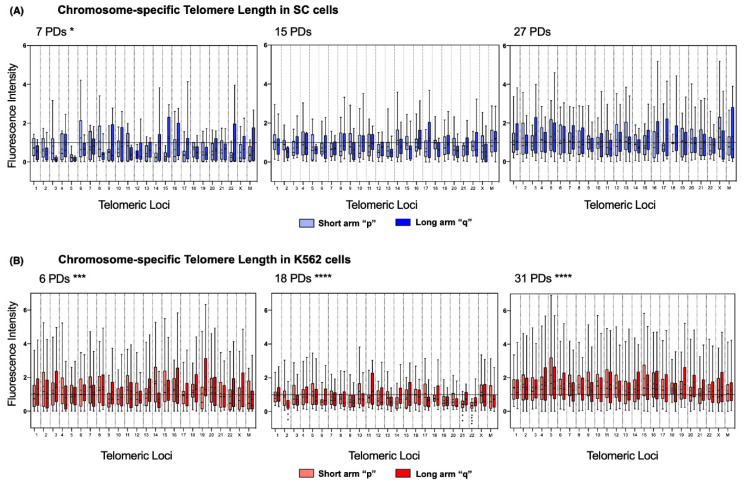
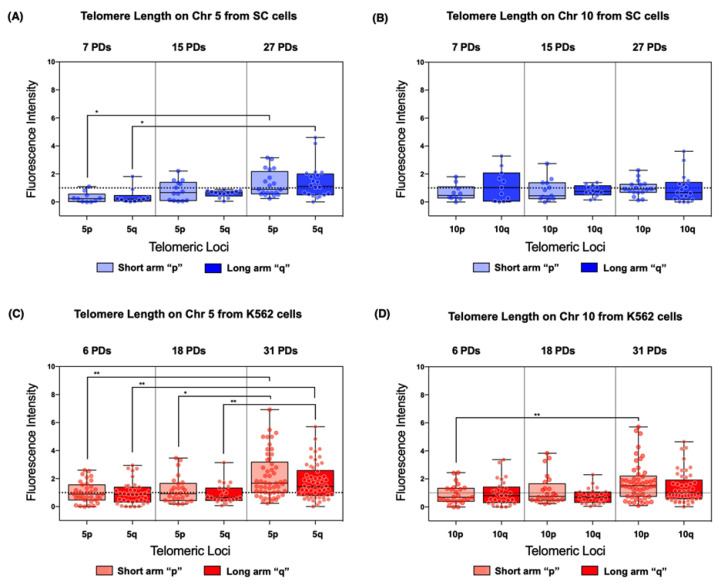
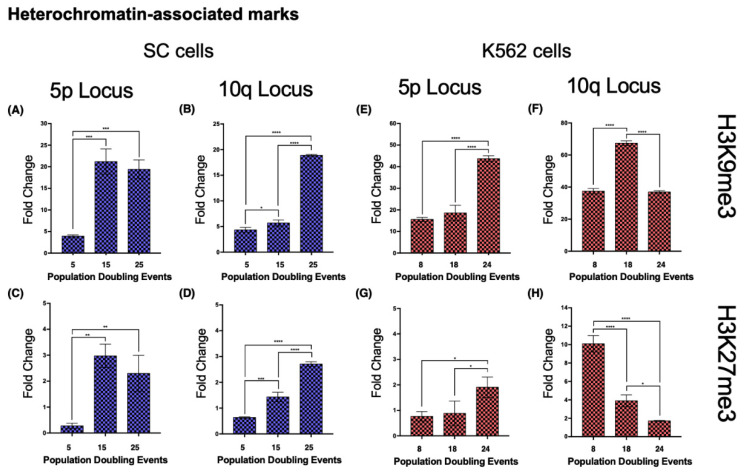
The long noncoding RNA (lncRNA) telomeric repeat-containing RNA (TERRA) has been associated with telomeric homeostasis, telomerase recruitment, and the process of chromosome healing; nevertheless, the impact of this association has not been investigated during the carcinogenic process. Determining whether changes in TERRA expression are a cause or a consequence of cell transformation is a complex task because studies are usually carried out using either cancerous cells or tumor samples. To determine the role of this lncRNA in cellular aging and chromosome healing, we evaluated telomeric integrity and TERRA expression during the establishment of a clone of untransformed myeloid cells. We found that reduced expression of TERRA disturbed the telomeric homeostasis of certain loci, but the expression of the lncRNA was affected only when the methylation of subtelomeric bivalent chromatin domains was compromised. We conclude that the disruption in TERRA homeostasis is a consequence of cellular transformation and that changes in its expression profile can lead to telomeric and genomic instability.

Keywords: TERRA; hTERT; lncRNA; telomeres.


Conflict of interest statement

The authors declare no conflict of interest.

Figures

Figure 1
Figure 1
A hypotriploid clone of the SC cells was established, but numerical chromosomal instability was still present. (A) Percentage of aneuploid cells after 7, 10, 15, and 27 population-doubling events (PDs) of the SC cell line. Over 50% of the analyzed cells were hypotriploid (3n−) in 3 of the sampled PDs. (B) Table with the chromosomal abnormalities found after 27 PDs of the SC cell line. Approximately 60% of the analyzed cells displayed a loss of chromosome 5 and of a derivative chromosome 10, together with the appearance of an extra chromosome marker. (C) Karyogram of the SC cells after 7 population-doubling events. The numerical or structural chromosomal alterations that were found in every sampled population are marked (*). (D) Karyogram of the SC cells after 27 population-doubling events. The numerical or structural chromosomal alterations that were found in every sampled population are marked (*). Additional chromosomal abnormalities are marked with blue arrows.
Figure 2
Figure 2
The hypotriploid K562 cell line displayed chromosomal instability as the culture aged. (A) Percentage of aneuploid cells after 8, 15, and 31 population-doubling events (PDs) in the K562 cell line. Over 50% of the analyzed cells were hypotriploid (3n−) in the sampled PDs. (B) Table with the chromosomal abnormalities found after 31 PDs of the K562 cell line. A total of 14 numerical/structural chromosomal alterations were found; 8 of them occurred in more than 80% of the analyzed cells. (C) Karyogram of the K562 cells after 8 population-doubling events. The numerical or structural chromosomal alterations that were found in every sampled population are marked (*). (D) Karyogram of K562 cells after 31 population-doubling events. The numerical or structural chromosomal alterations that were found in every sampled population are marked (*). Additional chromosomal abnormalities are marked with red arrows.
Figure 3
Figure 3
The expression of hTERT was recovered, and TERRA length increased in the SC cells. (A) Expression of hTERT in SC, K562, and Saos2 cells at different passages. hTERT showed increased and stable expression in SC cells. Fluctuating expression of hTERT was found in K562 cells. In Saos2 cells, hTERT expression remained significantly lower than that in myelogenous cell lines. Data were analyzed using ANOVA and Tukey’s multiple comparisons test. Adjusted p value < 0.0001 (****), =0.0006 (***), =0.0234 (*). (B) Northern blot analysis of TERRA abundance in the SC and K562 cell lines at different passages. There did not appear to be an increase in the global amount of TERRA in any of the sampled passages. However, there was an increase in the size of the lncRNA when hTERT expression was elevated in the SC cells (15 PDs) and in the K562 cells (18 PDs).
Figure 4
Figure 4
The expression of TERRA changed in a telomere-specific manner. (A) The expression of TERRA 5p was unaffected by cellular aging in SC cells. (B) Expression of TERRA 10q increased significantly after 29 PDs of the SC cells. (C,D) There was a similar expression pattern in both loci of the K562 cells. TERRA expression increased after 14 PDs and then dropped significantly after 29 PDs. Data were analyzed using ANOVA and Tukey’s multiple comparisons test. Adjusted p value < 0.0001 (****), =0.0003 (***), <0.005 (**), =0.0240 (*).
Figure 5
Figure 5
Global telomere length increased steadily in SC cells. (A) Dispersion of telomere length in different passages of the SC cell line. There was a discrete but steady lengthening of telomeric sequences during the assay. (B) Dispersion of telomere length in the K562 cell line at different passages. There was a significant reduction in telomere length after 18 PDs, but telomere length was recovered after 31 PDs. The dotted line in (A,B) represents the reference value used for the quantitative analysis of fluorescence intensity and the fluorescence from chromosome 18′s centromere. The fluorescence intensity of the telomeric probe was normalized against the centromeric fluorescence and expressed in arbitrary units (AU). Values > 1 represent an increase in hybridized telomeric sequences, i.e., lengthened telomeres. Values < 1 represent a loss of telemetric sequences, i.e., shortened telomeres. Data were analyzed using Kruskal–Wallis and Dunn’s multiple comparisons test. **** p < 0.0001.
Figure 6
Figure 6
Chromosome-specific telomere length in SC and K562 cells (A) In the chromosome arms of the SC cells, we observed steady telomere lengthening. The initial telomere length was significantly heterogeneous at 7 PDs; several chromosome arms displayed critically short telomeres. In later passages, telomere length was recovered, and the dispersion of length values was no longer significant. Data were analyzed using Kruskal–Wallis and Dunn’s multiple comparisons tests. The p value for telomere length at 7 PDs was 0.043 (*). (B) In the chromosome arms of the K562 cells, we observed abrupt telomere shortening, followed by heterogeneous lengthening. The initial telomere length was significantly longer than that in the SC cells, but after 18 PDs, the telomere length decreased considerably. Telomeres 2q, 21p, and 22p were significantly shorter after 18 PDs in every analyzed cell. Adjusted p values for telomeres 2q, 21p, and 22p after 18 PDs < 0.005 (**) and <0.0001 (****). After 31 PDs, telomere length recovered, but the dispersion of length values remained statistically significant. Data were analyzed using Kruskal-Wallis and Dunn’s multiple comparisons tests. (A,B) The fluorescence intensity of the telomeric probe was normalized against a centromeric probe and expressed in arbitrary units (AU). The mean value is shown in every box (•). The p value for telomere length at 6 PDs was 0.0002 (***), and after 18 and 31 PDs, it was <0.0001 (****).
Figure 7
Figure 7
Individual chromosome arms displayed different lengthening patterns. Telomere length was evaluated on chromosomes 5 and 10. (A,C) In both cell lines, the telomeres from chromosome 5 were significantly extended after 27 PDs in SC cells and after 31 PDs in K562 cells. (B) No discernible lengthening occurred in chromosome 10 of the SC cells. (D) A lengthening pattern was evident in chromosome 10 of the K562 cells, but the change was only significant at locus 10p. (AD) The fluorescence intensity of the telomeric probe was normalized against a centromeric probe and expressed in arbitrary units (AU). Data were analyzed with a Kruskal–Wallis test and Dunn’s multiple comparisons test. Adjusted p value < 0.05 (*), <0.005 (**).
Figure 8
Figure 8
Heterochromatin-associated histone marks accumulated on both analyzed loci in the SC cell line. Chromatin immunoprecipitation was carried out to determine the abundance of the heterochromatin-associated histone marks, H3K9me3 and H3K27me3. Note the different scales on the axes of the graphs. (AD) As the culture aged, both marks accumulated in loci 5p and 10q of the SC cells. (E,G) In K562 cells, locus 5p also accumulated both heterochromatin-associated marks. (F) The levels of H3K9me3 only increased temporarily at locus 10q after 18 PDs in K562 cells. (H) The levels of H3K27me3 decreased at locus 10q as K562 cells aged. Notably, in both cell lines, the levels of H3K9me3 were always considerably higher than those of H3K27me3. Data were analyzed using ANOVA and Tukey’s multiple comparisons test. Adjusted p value < 0.0001 (****), <0.001 (***), <0.01 (**), <0.05 (*).
Figure 9
Figure 9
Antagonizing histone marks occurring in the same locus favored TERRA transcription. Chromatin immunoprecipitation was carried out to analyze the abundance of the histone marks, H4K20me3 and H3K4me3. Note the different scales on the axes of the graphs. (A) H4K20me3, a mark normally enriched in telomeric constitutive heterochromatin, had very low levels in locus 5p of the SC cells; after 25 PDs, this mark was nearly undetectable. (B) At locus 10q, the levels of H4K20me3 increased after 15 PDs and then became significantly enriched after 25 PDs. (E,F) The levels of H4K20me3 behaved similarly in both loci of the K562 cells; the mark accumulated after 18 PDs but then diminished after 24 PDs. The enrichment of H4K20me3 was considerably higher on K562 10q than on 5p. (C,D) H3K4me3, a mark associated with active gene promoters, accumulated in both loci of the SC cells after 25 PDs. The enrichment of H3K4me3 was higher on SC 10q than on 5p. (G) H3K4me3 also increased significantly after 18 PDs of the K562 cells, but the levels of the mark returned to their original value after 24 PDs. (H) The levels of H3K4me3 decreased gradually as the K562 cells aged. Data were analyzed using ANOVA and Tukey’s multiple comparisons test. Adjusted p value < 0.0001 (****), =0.0008 (***), <0.01 (**).
Figure 10
Figure 10
Euchromatin-associated proteins accumulated on both analyzed loci in the SC cell line. Chromatin immunoprecipitation was carried out to analyze the abundance of the euchromatin-associated proteins’ RNA Polymerase 2 (Pol 2) and the CCCTC binding factor (CTCF). Note the different scales on the axes of the graphs. (AD) As the culture aged, both proteins accumulated in loci 5p and 10q of the SC cells. (E,F) The levels of Pol 2 diminished at loci 5p and 10q as the K562 cells aged. The reduced levels of Pol 2 that were found after 24 PDs in K562 cells were close to the levels accumulated on the same loci of the SC cells after 25 PDs. (G,H) The levels of CTCF increased on both loci after 18 PDs of the K562 cells, but after 24 PDs, they returned to their original values. Data were analyzed using ANOVA and Tukey’s multiple comparisons test. Adjusted p value < 0.0001 (****), = 0.0008 (***), < 0.01 (**), < 0.05 (*).
Figure 11
Figure 11
Proposed model for TERRA involvement in telomere recovery. In spite of hTERT reactivation, the expansion of a cell clone leads to critical telomere length due to an accelerated cell division. If hTERT is overexpressed, telomere healing ensues, and homeostasis is recovered. If hTERT expression does not resolve telomere loss, then genomic instability takes place. If the conditions are met, both scenarios can further develop. Upper panel. In cells with stable telomere length, proliferation can still be halted. Accumulation of DNA damage under physiological levels of oxidative stress can lead to the TP53/RB1-mediated cell cycle arrest and the induction of cellular senescence [18,89]. Lower panel. In cells with critical telomere length, further mutations can accumulate due to genomic instability. Mutations in genes such as HRAS, TP53, and RB1, together with the re-expression of hTERT, can prompt a cell towards malignant transformation [86,87,88].

Similar articles

Cited by

References

    1. Deng Z., Norseen J., Wiedmer A., Riethman H., Lieberman P.M. TERRA RNA Binding to TRF2 Facilitates Heterochromatin Formation and ORC Recruitment at Telomeres. Mol. Cell. 2009;35:403–413. doi: 10.1016/j.molcel.2009.06.025. - DOI - PMC - PubMed
    1. Griffith J.D., Comeau L., Rosenfield S., Stansel R.M., Bianchi A., Moss H., Lange T. de Mammalian Telomeres End in a Large Duplex Loop. Cell. 1999;97:503–514. doi: 10.1016/S0092-8674(00)80760-6. - DOI - PubMed
    1. Arnoult N., Beneden A.V., Decottignies A. Telomere Length Regulates TERRA Levels through Increased Trimethylation of Telomeric H3K9 and HP1α. Nat. Struct. Mol. Biol. 2012;19:948–956. doi: 10.1038/nsmb.2364. - DOI - PubMed
    1. Oliva-Rico D., Herrera L.A. Regulated Expression of the LncRNA TERRA and Its Impact on Telomere Biology. Mech. Ageing Dev. 2017;167:16–23. doi: 10.1016/j.mad.2017.09.001. - DOI - PubMed
    1. Flynn R.L., Centore R.C., O’Sullivan R.J., Rai R., Tse A., Songyang Z., Chang S., Karlseder J., Zou L. TERRA and HnRNPA1 Orchestrate an RPA-to-POT1 Switch on Telomeric Single-Stranded DNA. Nature. 2012;471:532–536. doi: 10.1038/nature09772. - DOI - PMC - PubMed

LinkOut - more resources