. 2022 Mar 18;23(6):3295.
doi: 10.3390/ijms23063295.

The Human Induced Pluripotent Stem Cell Test as an Alternative Method for Embryotoxicity Testing

Affiliations

The Human Induced Pluripotent Stem Cell Test as an Alternative Method for Embryotoxicity Testing

Saskia Galanjuk et al. Int J Mol Sci. .

Abstract

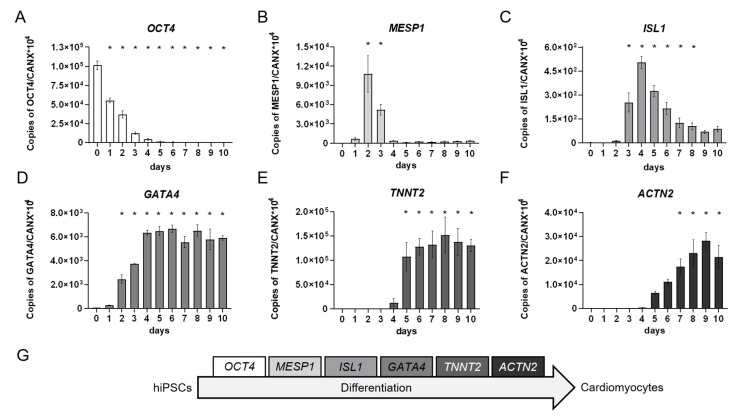
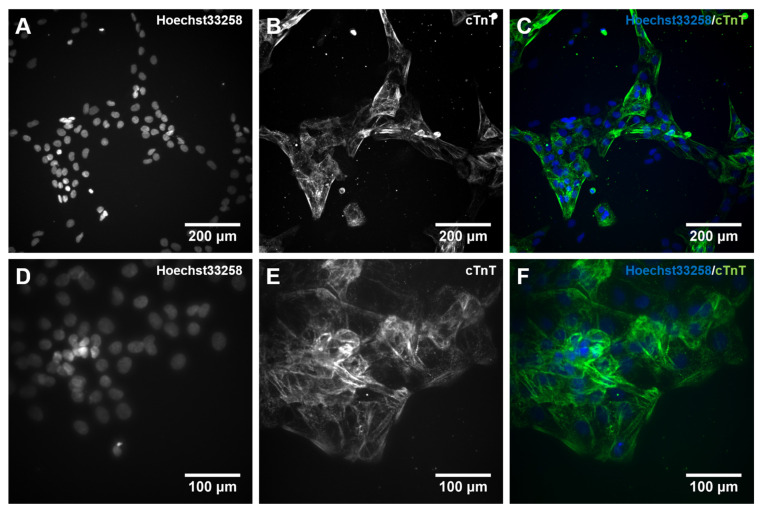
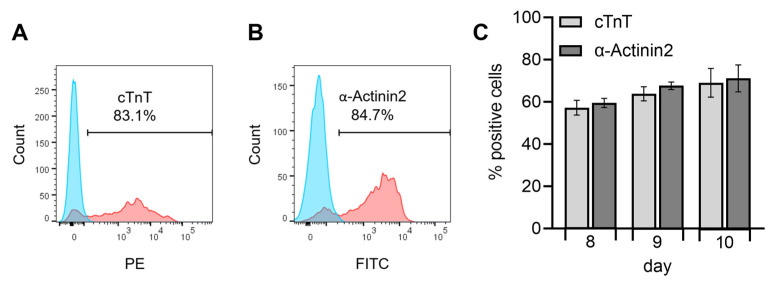
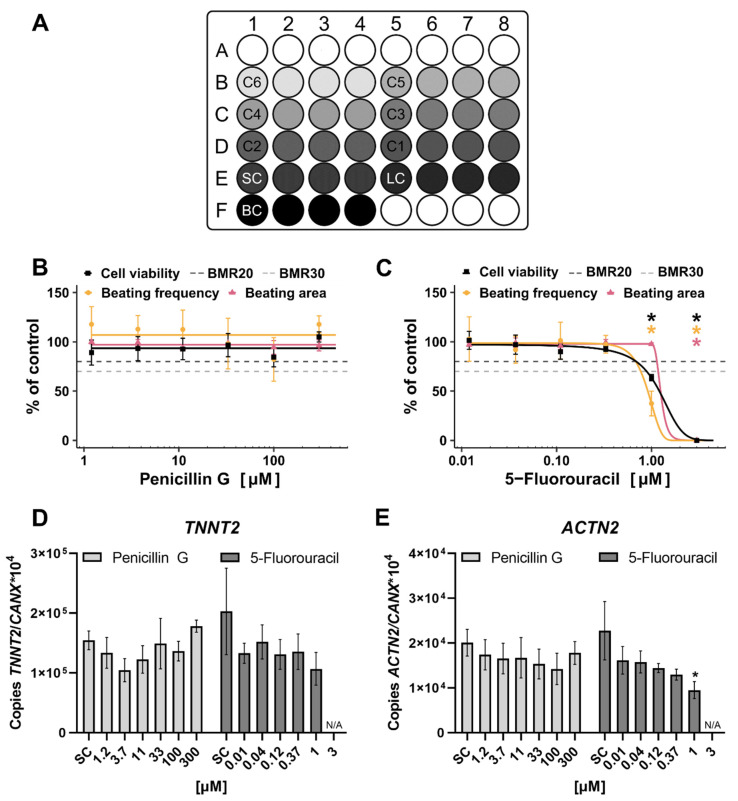
The evaluation of substances for their potency to induce embryotoxicity is controlled by safety regulations. Test guidelines for reproductive and developmental toxicity rely mainly on animal studies, which make up the majority of animal usage in regulatory toxicology. Therefore, there is an urgent need for alternative in vitro methods to follow the 3R principles. To improve human safety, cell models based on human cells are of great interest to overcome species differences. Here, human induced pluripotent stem cells (hiPSCs) are an ideal cell source as they largely recapitulate embryonic stem cells without bearing ethical concerns and they are able to differentiate into most cell types of the human body. Here, we set up and characterized a fetal bovine serum (FBS)-free hiPSC-based in vitro test method, called the human induced pluripotent stem cell test (hiPS Test), to evaluate the embryotoxic potential of substances. After 10 days in culture, hiPSCs develop into beating cardiomyocytes. As terminal endpoint evaluations, cell viability, qPCR analyses as well as beating frequency and area of beating cardiomyocytes by video analyses are measured. The embryotoxic positive and non-embryotoxic negative controls, 5-Fluorouracil (5-FU) and Penicillin G (PenG), respectively, were correctly assessed in the hiPS Test. More compounds need to be screened in the future for defining the assay's applicability domain, which will inform us of the suitability of the hiPS Test for detecting adverse effects of substances on embryonic development.

Keywords: CardioVision; cardiomyocytes; developmental toxicity; embryotoxicity; hiPS Test; hiPSC; in vitro; video analyses.


Conflict of interest statement

The authors declare no conflict of interest.

Figures

Figure 1
Figure 1
The human induced pluripotent stem cell (hiPSC) line iPS11 grown on Laminin521 (LN521) in FDTA medium displaying pluripotent and differentiated morphology. Representative phase-contrast microscopic images of cultivated iPS11 taken with an Olympus CKX53SF (Tokyo, Japan) and integrated camera SC50. (A,B): Human iPSCs with a pluripotent morphology indicated by a small cytoplasm to nucleus ratio, multiple nucleoli, and small cell size. (C,D): Human iPSC culture with differentiated cells showing a higher cytoplasm to nucleus ratio, a larger size, flattened morphology, and differentiation cracks. Magnification 40× (A,C) and 100× (B,D).
Figure 2
Figure 2
Flow cytometry analyses of cell line iPS11 analyzing stem cell markers NANOG-PE, OCT3/4-PerCP-Cy5.5, SOX2-Alexa Fluor 647, and SSEA-4-FITC, plus fixable viability stain 510 (FVS510) as a live/dead discriminator. The human induced pluripotent stem cell (hiPSC) line iPS11 was cultured in FTDA on Laminin521 (LN521)-coated 6-well plates in a single-cell-based culture and analyzed every other passage (p) from p4 to p10 and p20. The acquisition was performed using a BD FACSCanto™ II system operated with the BD FACSDiva™ software; further analysis was conducted with FlowJo. (A): Gating strategy for the relevant cell population. (B): Gating strategy to ensure analyses of single cells. (C): Gating strategy to discriminate between live and dead cells. (DG): Isotype controls for the respective antibodies. (HK): The threshold/gate was set to a maximum of 0.49% positive cells in the unstained control, every signal above was counted as a positive signal. Exemplary flow cytometry results of hiPSCs in p4a for the markers NANOG-PE, OCT3/4-PerCP-Cy5.5, SOX2-Alexa Fluor 647, and SSEA-4-FITC, blue peak: unstained cells, red peak: positively stained cells. (L): Percentages of positively stained cells (indicated by +) of the flow cytometry analyses from p4 to p10 and p20 for the indicated markers.
Figure 3
Figure 3
Schematic depiction of the cardiomyocyte differentiation protocol and range-finding experiment of CHIR99021 (CHIR) and bone morphogenetic protein 4 (BMP4) concentrations. (A): The protocol starts with the activation of the WNT and BMP signaling pathways by adding CHIR and BMP4, respectively, to the ITS medium. After 24 h, the ITS medium is changed to TS medium. On days 2 and 3 the WNT pathway is inhibited by supplementing TS medium with Inhibitor of WNT Production-2 (IWP2). From day 4 to 10 the medium is replaced every other day with TS medium devoid of pathway modulators. First beating cardiomyocytes are observable on day 7. Endpoint analyses are performed on day 10. For media compositions see Materials and Methods Section 3.2.2 and Supplementary Tables S1–S3. (B): The concentrations of CHIR and BMP4 have to be assessed for every hiPSC line individually. Therefore, a grid of 1 to 1.75 µM CHIR and 0.75 to 2 ng/mL BMP4 in increments of 0.25 µM and ng/mL, respectively, was applied using the protocol shown in (A), seeding 5 × 10⁵ cells/Matrigel (MG)-coated 24-well in 1.5 mL medium. In case the first results showed an optimal concentration combination at the edge of the grid (green square in (B)), the grid was extended framing the optimal concentration (blue square in (B)) and tested again. (C): Exemplary images of the grid testing for iPS11 cells. The grid was extended to 2 µM CHIR and 0.5 ng/mL BMP4 as shown in (B). Concentrations of interest were tested in triplicates seeding 2.75 × 10⁵ cells/MG-coated 48-well following the protocol shown in (A) (see Section 3.2.4). Exemplary images were taken on day 10 using an Olympus CKX53SF (Tokyo, Japan) with an integrated camera SC50. Magnification: 40×.
Figure 4
Figure 4
Exemplary phase-contrast images of the same well of human induced pluripotent stem cells (hiPSCs) differentiating into cardiomyocytes over a time course of 10 days. First, 2.75 × 10⁵ cells/Matrigel (MG)-coated 48-well were plated on day 0 in ITS medium. Day 1: Medium was replaced with TS medium. Cells grew on top of each other. Day 2 and 3: Medium was changed to TS supplemented with 2 µM IWP2. Cells grew to uneven heights. Day 4: Medium was changed to TS medium. On day 5 cells were not fed and not tracked. Day 6: TS medium was refreshed. Cells started to form holes and detached from the matrix. Day 7: Cells formed multiple holes and further detachement from the matrix was observed. Areas of beating cardiomyocytes were observable. Day 8: TS medium was refreshed. Cells started to beat in a wave motion. Day 9–10: The morphology of cells did not alter noticeably. The beating developed into a synchronous wave contracting over the entire well on day 10. Dead cells were trapped between the matrix and the beating cells not sucked in during feeding (white arrows). Images were taken with an Olympus CKX53SF (Tokyo, Japan) and an integrated camera SC50. Magnification: 40×.
Figure 5
Figure 5
Quantitative real-time RT-PCR analyses of developing human induced pluripotent stem cell (hiPSC)-derived cardiomyocytes over a time course of 10 days. Triplicates of 2.75 × 10⁵ cells/well were seeded onto Matrigel (MG)-coated 48-well plates and differentiated according to the protocol shown in Figure 3A. Each day a triplicate of samples was collected and pooled for RT-qPCR analysis of marker genes for (A): stem cells, (B): cardiac mesoderm, (C,D): cardiac progenitor cells, and (E,F): functional cardiomyocytes. (G): Depiction of chosen markers according to the differentiation stages from hiPSCs to cardiomyocytes. Day 0 represents the hiPSCs used for the respective induction collected during the cell passaging procedure. Mean values of copy numbers of the target genes OCT4, MESP1, ISL1, GATA4, TNNT2, and ACTN2 were normalized to the reference gene CANX which is stably expressed in hiPSCs and cells of the mesodermal lineage [60,61] including early cardiomyocytes in the hiPS Test (Figure S2). N = 3, ±SEM, p < 0.05 was considered significant, * = significant compared to day 0. These gene expression analyses demonstrated the course of different cardiomyocyte developmental stages that differentiating hiPSCs proceed through (Figure 5G) and which were also observed using other differentiation protocols [46,62,63,64,65].
Figure 6
Figure 6
Immunocytochemical (ICC) staining for cardiac muscle Troponin T (cTnT) in 10 days differentiated cardiomyocytes. Human iPSCs were differentiated into cardiomyocytes for 10 days. On day 10, cells were dissociated with Accutase supplemented with 10 µM Y-27632, and 6 × 10⁴ cells were plated on a 96-well plate coated with Matrigel (MG). Cells were cultivated for an additional 24 h and subsequently stained with an antibody against cTnT together with Hoechst 33258. (A,D): cell nuclei stained with Hoechst33258; (B,E): cTnT staining, (C,F): merged pictures. The visualization was performed with an automated microscopic system for high content imaging (CellInsight CX7 LZR Platform). Magnification; (AC):100×, (DF): 200×.
Figure 7
Figure 7
Flow cytometry analysis of human induced pluripotent stem cell (hiPSC)-derived cardiomyocytes analyzing the cardiac-specific proteins cardiac muscle Troponin T (cTnT)-PE and α-Actinin2-FITC, including fixable viability stain 510 (FVS510) as a live/dead discriminator on days 8, 9, and 10 of the differentiation protocol (Figure 3A). Human iPSCs were differentiated into cardiomyocytes in replicates of 16 for every day of analysis and pooled on the respective days. Flow cytometry analyses were performed using a BD FACSCanto™ II system operated with the BD FACSDiva™ software. Further analyses were conducted with FlowJo. (A,B): Exemplary flow cytometry results of day 10 for the markers cTnT-PE and α-Actinin2-FITC, blue peak: unstained cells, red peak: positively stained cells. The gate to determine a positive signal was defined through the unstained control by setting it to a maximum of 0.49% positively stained cells in the unstained control. (C): Results of positively stained cells for the markers cTnT-PE and α-Actinin2-FITC on days 8, 9, and 10. N = 4, ±SEM. p < 0.05 was considered significant, no statistical significance was detected.
Figure 8
Figure 8
Substance testing of Penicillin G (PenG) and 5-Fluorouracil (5-FU) in the human induced pluripotent stem cell Test (hiPS Test). Human iPSCs were differentiated into cardiomyocytes over a time course of 10 days (Figure 3A). On day 10, endpoints were analyzed. (A): Pipetting scheme for compound testing in the hiPS Test. C6-C1: Increasing concentrations of a tested substance in quadruplicates, SC: solvent control, LC: lysis control, BC: background control, white circles: border wells filled with 800 µL sterile water. (BE): Cells were treated with 1.2–300 µM PenG or 0.012–3 µM 5-FU for 10 days. Substances were freshly applied on every feeding day (days 2, 3, 4, 6, and 8). (B,C): Concentration response curves normalized to the control of cell viability, beating frequency, and beating area for PenG and 5-FU, respectively, including the benchmark response (BMR)20 and BMR30. On day 10 videos of every well were recorded using a Binocular (Leica, Wetzlar, Germany, DS100B) with an integrated heating plate set to 37 °C. Video analyses were performed with the in-house developed software CardioVision to evaluate the beating frequency and beating area. A cell viability assay was performed and analyzed using a multimode-microplate reader (TECAN, Männedorf, Switzerland, Infinite® 200 PRO). (D,E): Samples were collected (quadruplicates) and pooled for RT-qPCR analysis of TNNT2, an early cardiomyocyte marker, and ACTN2, a later cardiomyocyte marker. Mean values of copy numbers of the target genes TNNT2 and ACTN2 were normalized to the reference gene CANX which is stably expressed in hiPSCs and cells of the mesodermal lineage [59,60] including early cardiomyocytes in the hiPS Test (Figure S2). For all experiments, N = 3, ±SEM, p < 0.05 was considered significant, * = significant compared to the solvent control. N/A = not applicable.
Figure 9
Figure 9
Visualization of video processing steps used in the in-house developed software CardioVision. The software includes different video processing steps to finally determine the beating frequency and beating area of a recorded video. (A): Reference points (white dots) were placed over the video in a grid of 20 pixels to each other. Reference points within the region of interest (ROI), depicted as a red circle, were analyzed. The motion profile of a single reference point marked in green is depicted inside the black frame. Peaks marked with an orange X are counted as a beat. (B): Heatmap representing the beating area color-coded with the respective beating frequency in beats/second calculated at each reference point.

Similar articles

Cited by

References

    1. Miller B.F., Keane C., O’Toole M.T. Encyclopedia & Dictionary of Medicine, Nursing & Allied Health. 7th ed. W B Saunders Co; Philadelphia, PA, USA: 2003.
    1. Nicoll R. Environmental Contaminants and Congenital Heart Defects: A Re-Evaluation of the Evidence. Int. J. Environ. Res. Public Health. 2018;15:2096. doi: 10.3390/ijerph15102096. - DOI - PMC - PubMed
    1. MacDorman M.F., Gregory E.C.W. Fetal and Perinatal Mortality: United States, 2013. Natl. Vital Stat. Rep. 2015;64:24. - PubMed
    1. DeSesso J.M. Future of Developmental Toxicity Testing. Curr. Opin. Toxicol. 2017;3:1–5. doi: 10.1016/j.cotox.2017.04.001. - DOI
    1. Weinhold B. Environmental Factors in Birth Defects: What We Need to Know. Environ. Health Perspect. 2009;117:A440–A447. doi: 10.1289/ehp.117-a440. - DOI