. 2022 Mar 18;23(6):3300.
doi: 10.3390/ijms23063300.

A Mixture of Valine and Isoleucine Restores the Growth of Protein-Restricted Pigs Likely through Improved Gut Development, Hepatic IGF-1 Pathway, and Plasma Metabolomic Profile

Affiliations

A Mixture of Valine and Isoleucine Restores the Growth of Protein-Restricted Pigs Likely through Improved Gut Development, Hepatic IGF-1 Pathway, and Plasma Metabolomic Profile

Mohammad Habibi et al. Int J Mol Sci. .

Abstract

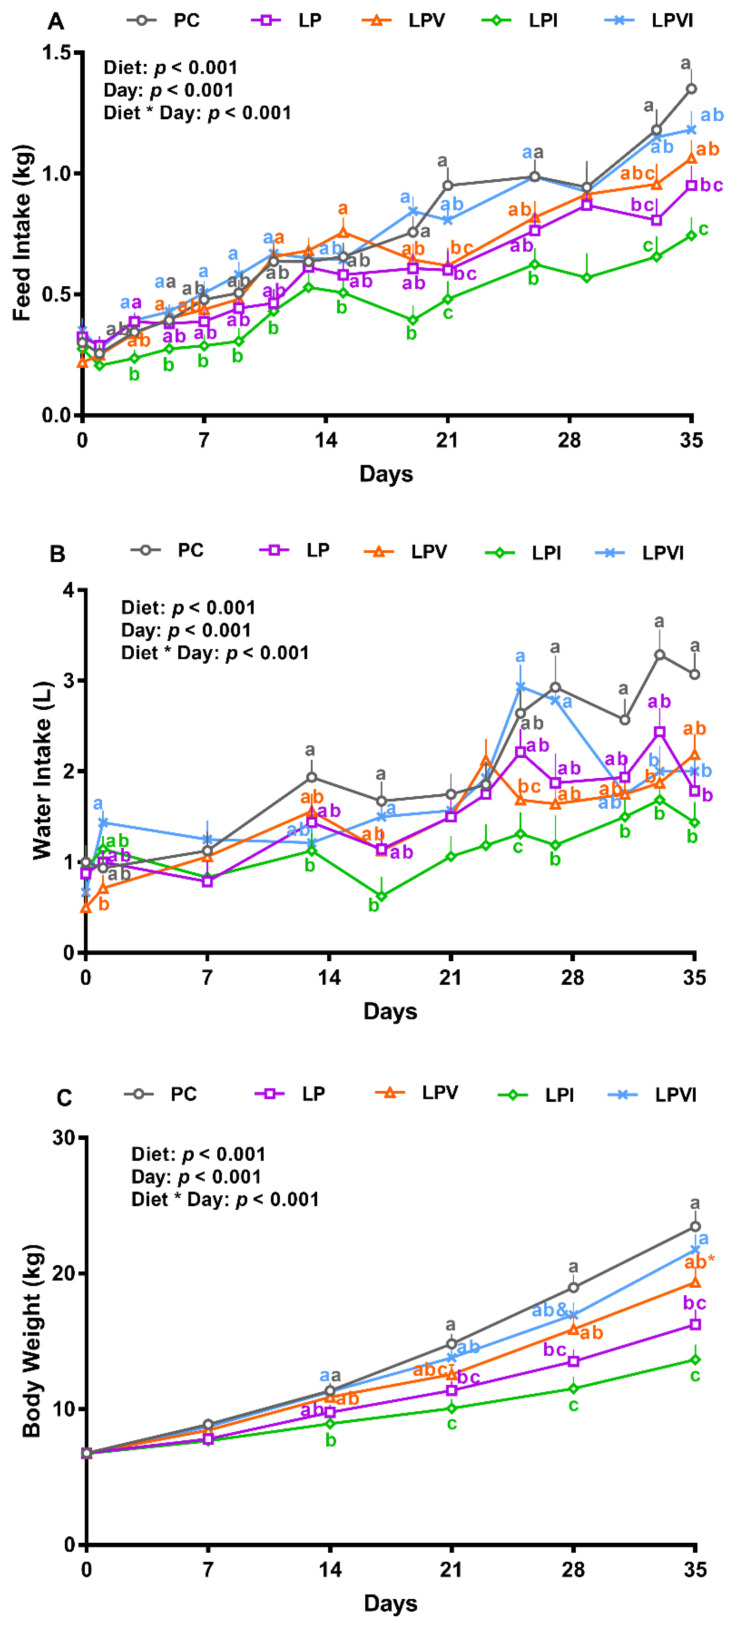
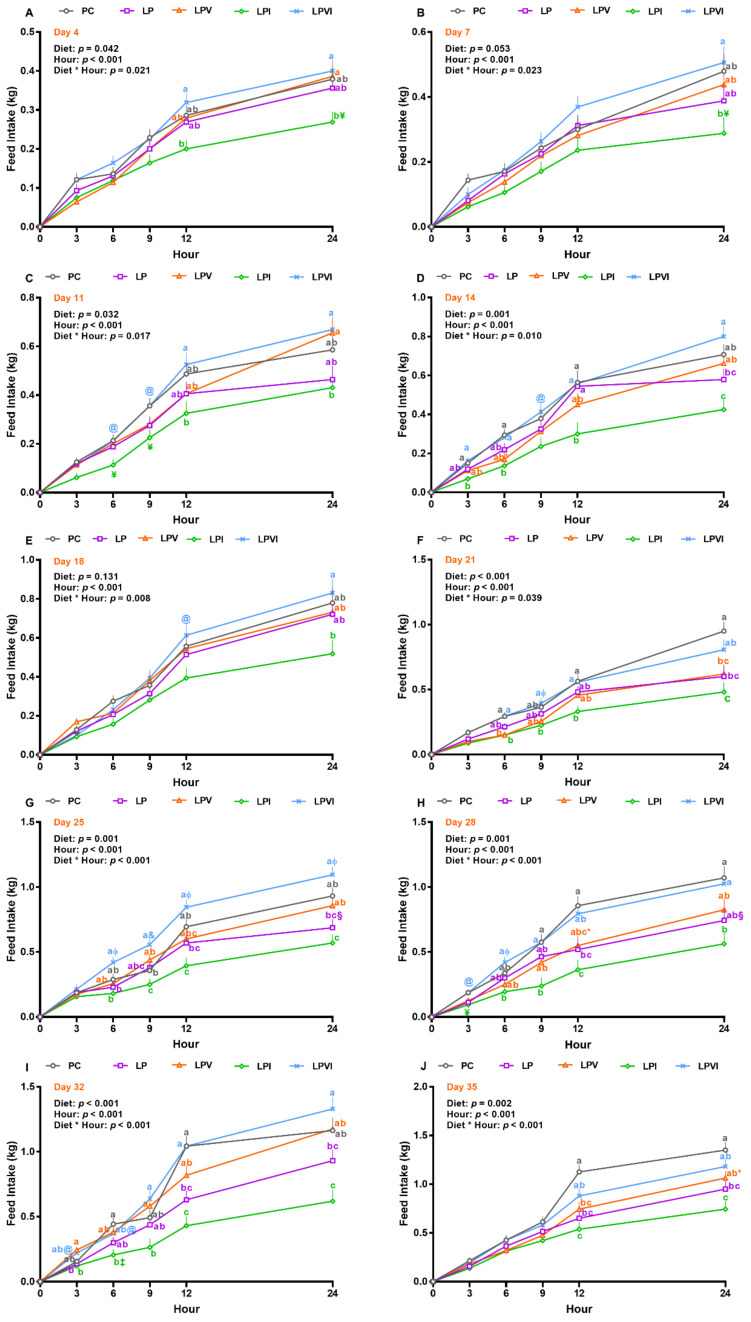
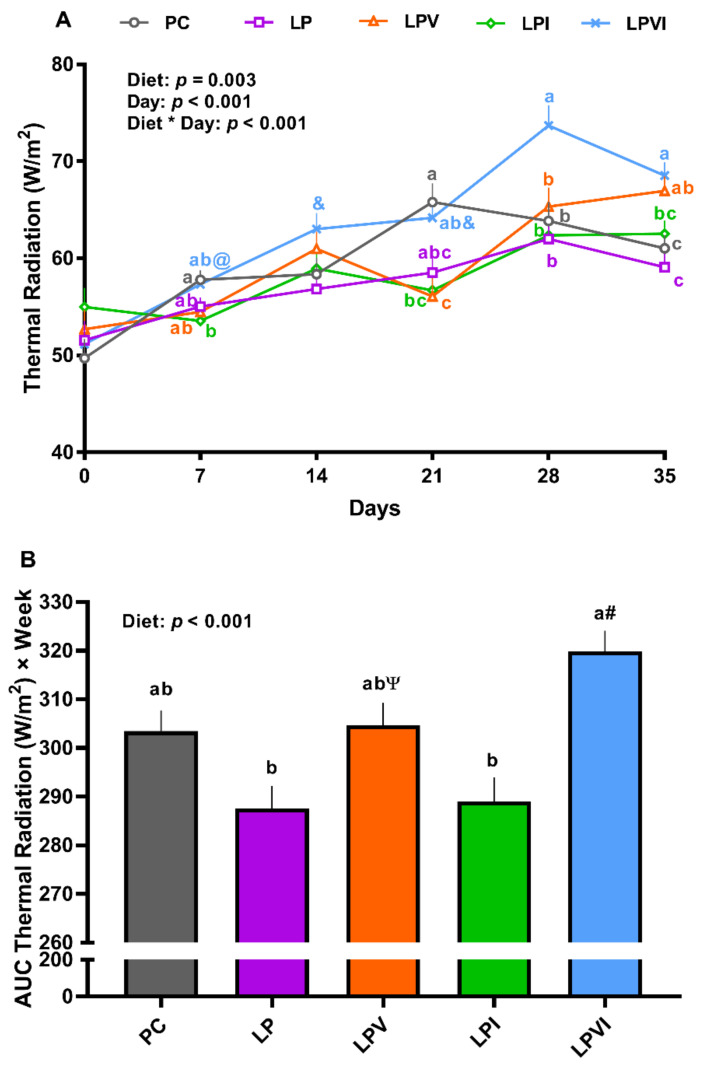
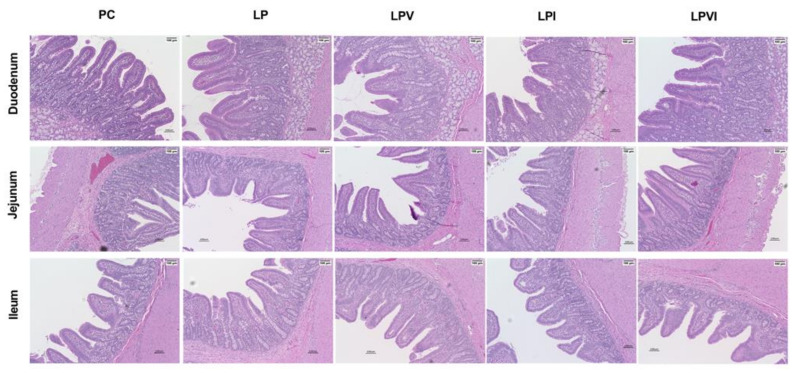
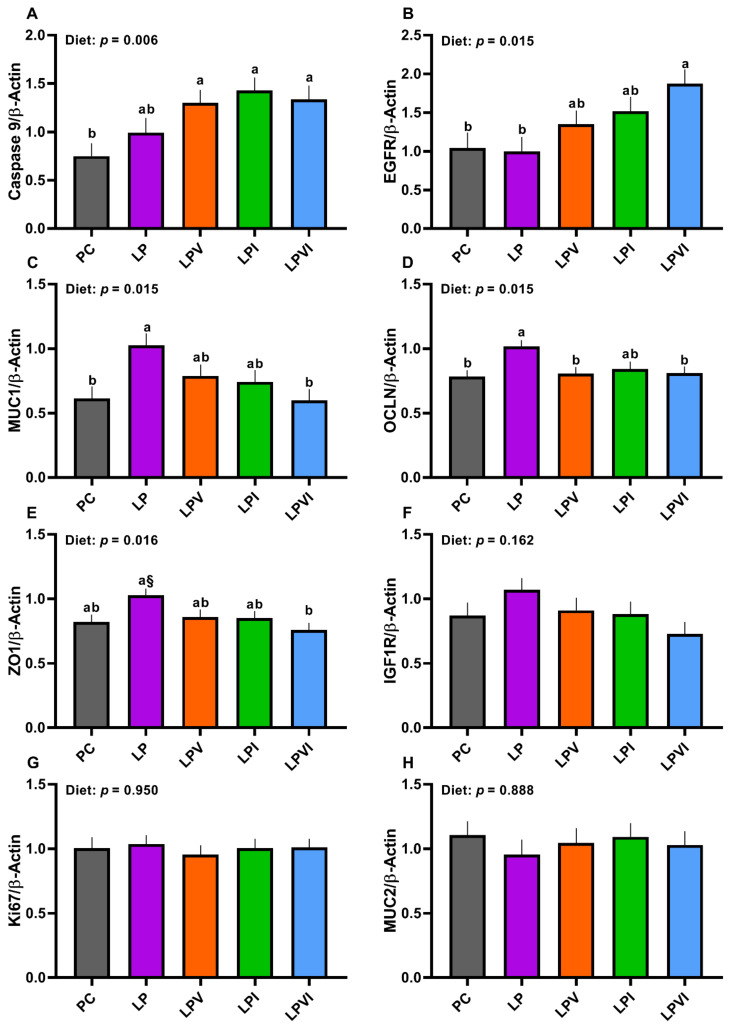
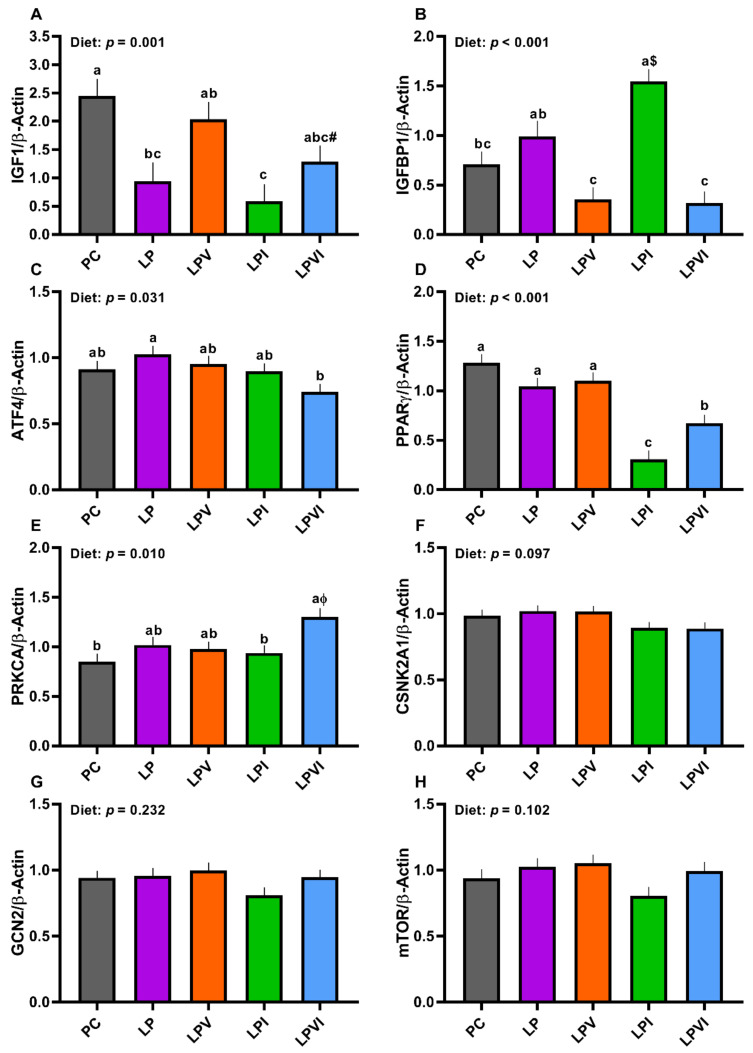
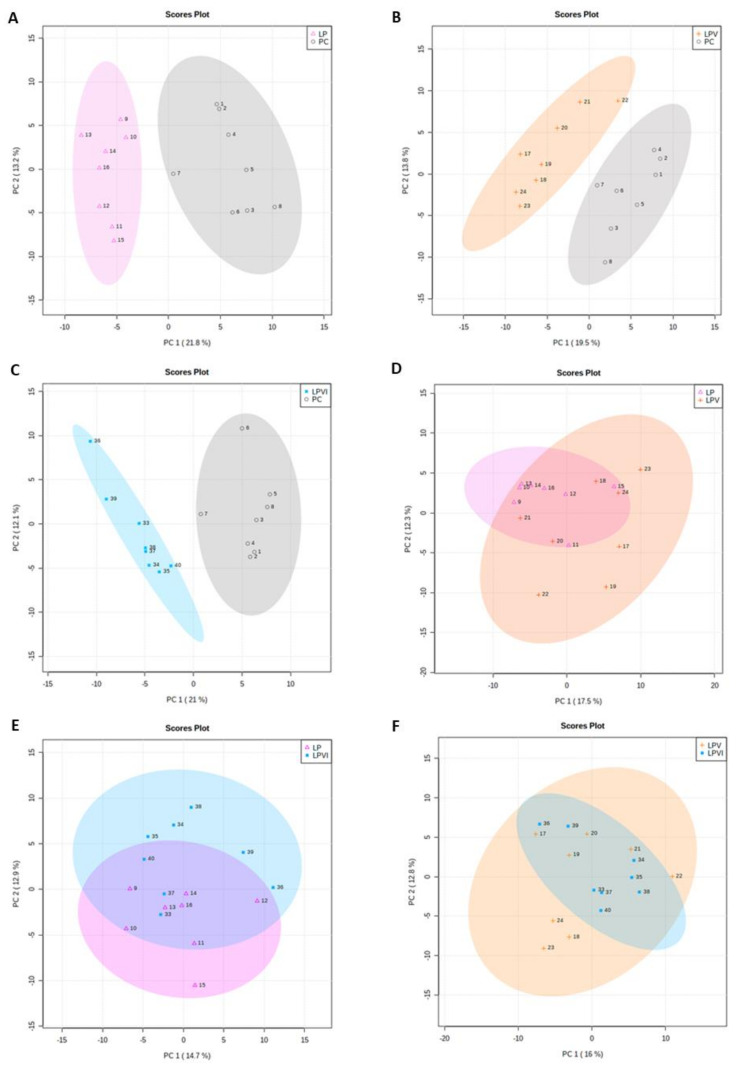
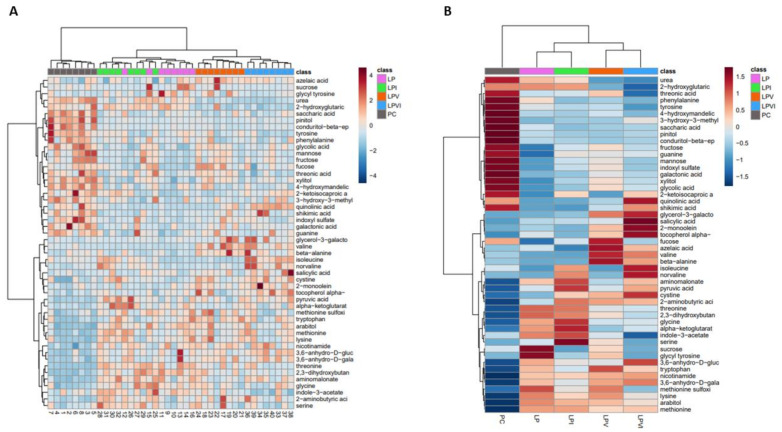
Valine (Val) alone or in combination with isoleucine (Ile) improves the growth under severe protein restriction; however, the underlying mechanisms remain unknown. In this study, we assessed whether Val/Ile-induced growth in protein-restricted pigs is associated with changes in gut development, hepatic insulin-like growth factor 1 (IGF-1) production, and blood metabolomics. Forty piglets were assigned to five dietary groups: positive control (PC) with standard protein content; low protein (LP) with very low protein content; and LP supplemented with Val (LPV), Ile (LPI), and Val and Ile (LPVI). LPVI reversed the negative effects of VLP diets on growth and gut morphology. Both LPV and LPVI restored the reduced transcript of IGF-1 while decreasing the transcript of insulin-like growth factor binding protein 1 (IGFBP1) in the liver. LPV and LPVI recovered the reduced plasma Val, glycine, and leucine concentrations, which were positively correlated with improved gut morphology and the hepatic IGF-1 gene expression and negatively correlated with hepatic IGFBP1 mRNA abundance. In conclusion, supplementation with a combination of Val and Ile into the VLP diets restored the decreased growth performance of pigs fed with these diets likely through improved gut development, hepatic IGF-1 expression and bioavailability, and plasma metabolomics profile.

Keywords: growth; gut development; insulin-like growth factor 1; isoleucine; low protein; metabolomics; pig; valine.


Conflict of interest statement

The authors declare no conflict of interest. The funders had no role in the design of the study; in the collection, analyses, or interpretation of data; in the writing of the manuscript, or in the decision to publish the results.

Figures

Figure 1
Figure 1
(A) Feed intake, (B) water intake, and (C) body weight of nursery pigs fed with very-low-protein diets supplemented with Ile, Val, or combination of both. PC (positive control): standard-protein diet; LP (negative control): low-protein diet containing limiting amino acids (i.e., Lys, Met, Thr and Trp) at NRC (2012) levels; LPV: LP containing Val at NRC level; LPI: LP containing Ile at NRC level; LPVI: LP containing Val and Ile at NRC levels. The values are means ± standard error of the mean. n = 8. a,b,c Among groups, the means with different superscript letter(s) are different (p ≤ 0.05). & p ≤ 0.1 LPVI vs. LP, * p ≤ 0.1 LPV vs. PC.
Figure 2
Figure 2
Feed intake at (A) Day 4, (B) Day 7, (C) Day 11 (D) Day 14, (E) Day 18, (F) Day 21, (G) Day 25, (H) Day 28, (I) Day 32, (J) Day 35 in nursery pigs fed with very-low-protein diets supplemented with Ile, Val, or combination of both. PC (positive control): standard-protein diet; LP (negative control): low-protein diet containing limiting amino acids (i.e., Lys, Met, Thr and Trp) at NRC (2012) levels; LPV: LP containing Val at NRC level; LPI: LP containing Ile at NRC level; LPVI: LP containing Val and Ile at NRC levels. The values are means ± standard error of the mean. n = 8. a,b,c Among groups, the means with different superscript letter(s) are different (p ≤ 0.05). § p ≤ 0.1 LP vs. PC, * p ≤ 0.1 LPV vs. PC, ¥ p ≤ 0.1 LPI vs. PC, & p ≤ 0.1 LPVI vs. LP,  p ≤ 0.1 LPI vs. LPV, ɸ p ≤ 0.1 LPVI vs. LPV, @ p ≤ 0.1 LPVI vs. LPI.
Figure 3
Figure 3
(A) Thermal radiation and (B) area under the curve (AUC) thermal radiation of nursery pigs fed with very-low-protein diets supplemented with Ile, Val, or combination of both. PC (positive control): standard-protein diet; LP (negative control): low-protein diet containing limiting amino acids (i.e., Lys, Met, Thr and Trp) at NRC (2012) levels; LPV: LP containing Val at NRC level; LPI: LP containing Ile at NRC level; LPVI: LP containing Val and Ile at NRC levels. The values are means ± standard error of the mean. n = 8. a,b,c Among groups, the means with different superscript letter(s) are different (p ≤ 0.05). # p ≤ 0.1 LPVI vs. PC, Ψ p ≤ 0.1 LPV vs. LP, & p ≤ 0.1 LPVI vs. LP, @ p ≤ 0.1 LPVI vs. LPI.
Figure 4
Figure 4
Representative intestinal hematoxylin and eosin-stained sections (×10 magnification) micrographs of duodenum, jejunum, and ileum in pigs fed with very-low-protein diets supplemented with Ile, Val, or combination of both. PC (positive control): standard-protein diet; LP (negative control): low-protein diet containing limiting amino acids (i.e., Lys, Met, Thr and Trp) at NRC (2012) levels; LPV: LP containing Val at NRC level; LPI: LP containing Ile at NRC level; LPVI: LP containing Val and Ile at NRC levels. n = 8.
Figure 5
Figure 5
Duodenal mRNA abundance of (A) caspase-9, (B) epidermal growth factor receptor (EGFR), (C) mucin 1 (MUC1), (D) occludin (OCLN), (E) zonula occludens 1 (ZO1), (F) insulin-like growth factor-1 receptor (IGF1R), (G) Ki-67, and (H) mucin 2 (MUC2), in nursery pigs fed with very-low-protein diets supplemented with Ile, Val, or combination of both. PC (positive control): standard-protein diet; LP (negative control): low-protein diet containing limiting amino acids (i.e., Lys, Met, Thr and Trp) at NRC (2012) levels; LPV: LP containing Val at NRC level; LPI: LP containing Ile at NRC level; LPVI: LP containing Val and Ile at NRC levels. The values are means ± standard error of the mean. n = 8. a,b Among groups, the means with different superscript letter(s) are different (p ≤ 0.05). § p ≤ 0.1 LP vs. PC.
Figure 6
Figure 6
Hepatic mRNA abundance of (A) insulin-like growth factor-1 (IGF1), (B) insulin-like growth factor binding protein 1 (IGFBP1), (C) activating transcription factor 4 (ATF4), (D) peroxisome proliferator-activated receptor gamma (PPARγ), (E) protein kinase C alpha (PRKCA), (F) casein kinase 2 alpha 1 (CSNK2A1), (G) general control non-derepressible-2 (GCN2), and (H) mechanistic target of rapamycin (mTOR), in nursery pigs fed with very-low-protein diets supplemented with Ile, Val, or combination of both. PC (positive control): standard-protein diet; LP (negative control): low-protein diet containing limiting amino acids (i.e., Lys, Met, Thr and Trp) at NRC (2012) levels; LPV: LP containing Val at NRC level; LPI: LP containing Ile at NRC level; LPVI: LP containing Val and Ile at NRC levels. The values are means ± standard error of the mean. n = 8. a,b,c Among groups, the means with different superscript letter(s) are different (p ≤ 0.05). # p ≤ 0.1 LPVI vs. PC, ɸ p ≤ 0.1 LPVI vs. LPV, $ p ≤ 0.1 LPI vs. LP.
Figure 7
Figure 7
Principal component analysis (PCA) score plots of plasma metabolites in nursery pigs fed with very-low-protein diets supplemented with Ile, Val, or combination of both. (A) LP vs. PC, (B) LPV vs. PC, (C) LPVI vs. PC, (D) LPV vs. LP, (E) LPVI vs. LP, and (F) LPVI vs. LPV. PC (positive control): standard-protein diet; LP (negative control): low-protein diet containing limiting amino acids (i.e., Lys, Met, Thr and Trp) at NRC (2012) levels; LPV: LP containing Val at NRC level; LPI: LP containing Ile at NRC level; LPVI: LP containing Val and Ile at NRC levels. Each shape represents a pig. n = 8.
Figure 8
Figure 8
Heatmap analysis of plasma metabolites in nursery pigs fed with very-low-protein diets supplemented with Ile, Val, or combination of both. Hierarchical clustering of the top 50 significant plasma metabolites among: (A) individual pigs and (B) pigs fed with PC, LP, LPI, LPV, and LPVI. PC (positive control): standard-protein diet; LP (negative control): low-protein diet containing limiting amino acids (i.e., Lys, Met, Thr and Trp) at NRC (2012) levels; LPV: LP containing Val at NRC level; LPI: LP containing Ile at NRC level; LPVI: LP containing Val and Ile at NRC levels. The metabolites are shown in rows, and pigs or experimental groups are shown in columns (Figure 8A,B, respectively). The dark red or blue is corresponding to the magnitude of difference when compared with the average value. The dendrogram on the left side of the heatmap shows both the similarity and the order that the clusters were formed. n = 8.
Figure 9
Figure 9
Pathway analysis map of plasma metabolites in nursery pigs fed with very-low-protein diets supplemented with Ile, Val, or combination of both. (A) LP vs. PC, (B) LPV vs. PC, (C) LPVI vs. PC, (D) LPV vs. LP, (E) LPVI vs. LP, and (F) LPVI vs. LPV. PC (positive control): standard-protein diet; LP (negative control): low-protein diet containing limiting amino acids (i.e., Lys, Met, Thr and Trp) at NRC (2012) levels; LPV: LP containing Val at NRC level; LPI: LP containing Ile at NRC level; LPVI: LP containing Val and Ile at NRC levels. Each circle is obtained from topology analysis representing a metabolic pathway with the scores. The x-axis indicates the pathway impact, and the y-axis shows the pathway enrichment. The circle size depends on its impact while its color is based on its p value (i.e., greater circle size shows higher pathway impact, while darker color circles demonstrate more significant changes of metabolites and pathway enrichment). n = 8.
Figure 10
Figure 10
Pearson correlation analysis between significantly changed plasma metabolites, growth performance, gut morphology, and gene expression of markers associated with gut development and hepatic IGF-1 signaling pathway in nursery pigs fed with very-low-protein diets supplemented with Ile, Val, or combination of both. The color of the squares is based on the Pearson coefficient distribution: red represents a positive correlation (p ≤ 0.05), blue represents a negative correlation (p ≤ 0.05), and white is indicative of a non-significant correlation (p > 0.05). IGFBP1: insulin-like growth factor binding protein 1; ATF4: activating transcription factor 4; PPARγ: peroxisome proliferator-activated receptor gamma; PRKCA: protein kinase C alpha; EGFR: epidermal growth factor receptor; MUC1: mucin 1; OCLN: occludin; ZO1: zonula occludens 1. n = 8.

Similar articles

Cited by

References

    1. Wang Y., Zhou J., Wang G., Cai S., Zeng X., Qiao S. Advances in low-protein diets for swine. J. Anim. Sci. Biotechnol. 2018;9:1–14. doi: 10.1186/s40104-018-0276-7. - DOI - PMC - PubMed
    1. Figueroa J., Lewis A., Miller P.S., Fischer R., Gómez R., Diedrichsen R. Nitrogen metabolism and growth performance of gilts fed standard corn-soybean meal diets or low-crude protein, amino acid-supplemented diets. J. Anim. Sci. 2002;80:2911–2919. doi: 10.2527/2002.80112911x. - DOI - PubMed
    1. Portejoie S., Dourmad J.Y., Martinez J., Lebreton Y. Effect of lowering dietary crude protein on nitrogen excretion, manure composition and ammonia emission from fattening pigs. Livest. Prod. Sci. 2004;91:45–55. doi: 10.1016/j.livprodsci.2004.06.013. - DOI
    1. Habibi M., Shili C., Sutton J., Goodarzi P., Maylem E.R., Spicer L., Pezeshki A. Branched-chain amino acids partially recover the reduced growth of pigs fed with protein-restricted diets through both central and peripheral factors. Anim. Nutr. 2021;7:868–882. doi: 10.1016/j.aninu.2021.02.002. - DOI - PMC - PubMed
    1. Spring S., Premathilake H., DeSilva U., Shili C., Carter S., Pezeshki A. Low protein-high carbohydrate diets alter energy balance, gut microbiota composition and blood metabolomics profile in young pigs. Sci. Rep. 2020;10:3318. doi: 10.1038/s41598-020-60150-y. - DOI - PMC - PubMed