. 2022 Mar 18;23(6):3311.
doi: 10.3390/ijms23063311.

Elongation and Contraction of Scallop Sarcoplasmic Reticulum (SR): ATP Stabilizes Ca2+-ATPase Crystalline Array Elongation of SR Vesicles

Affiliations

Elongation and Contraction of Scallop Sarcoplasmic Reticulum (SR): ATP Stabilizes Ca2+-ATPase Crystalline Array Elongation of SR Vesicles

Jun Nakamura et al. Int J Mol Sci. .

Abstract

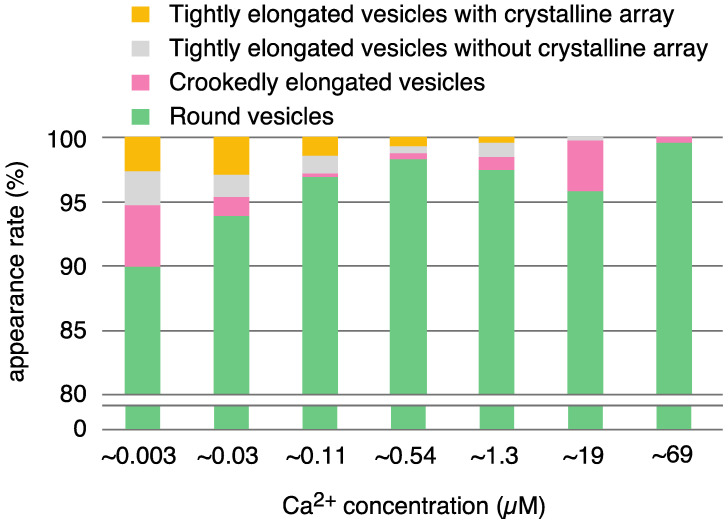
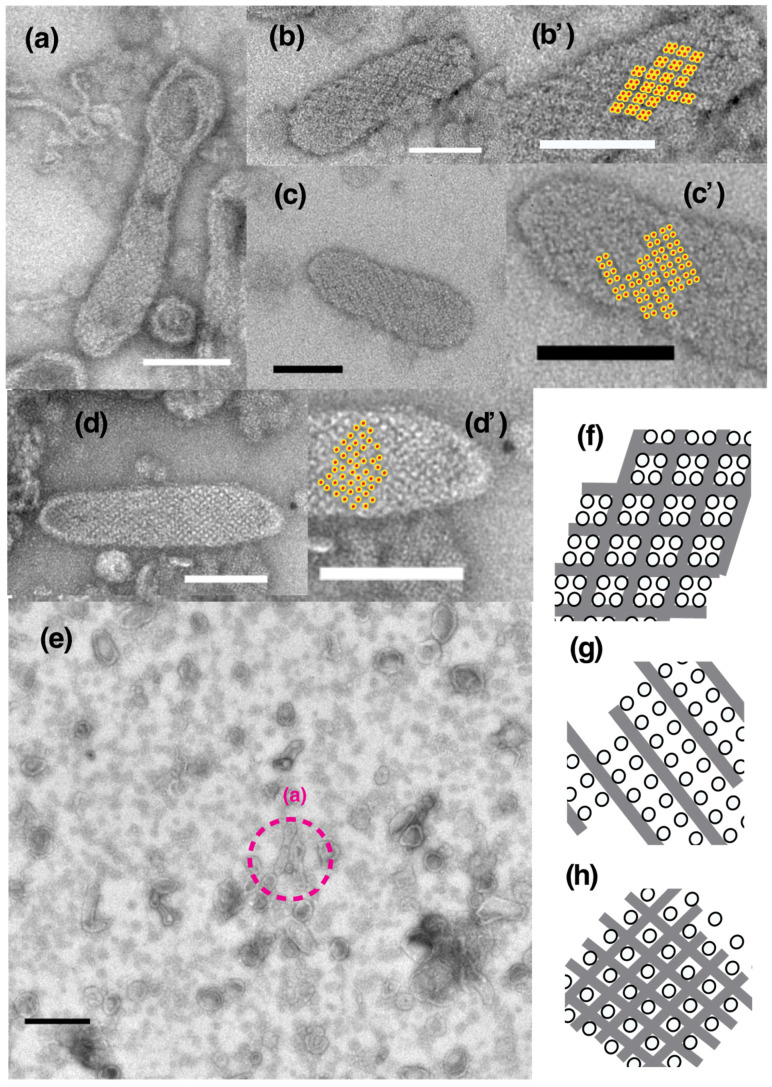
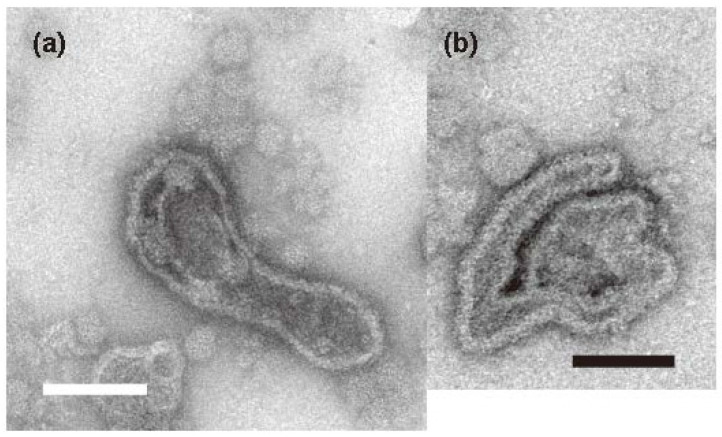
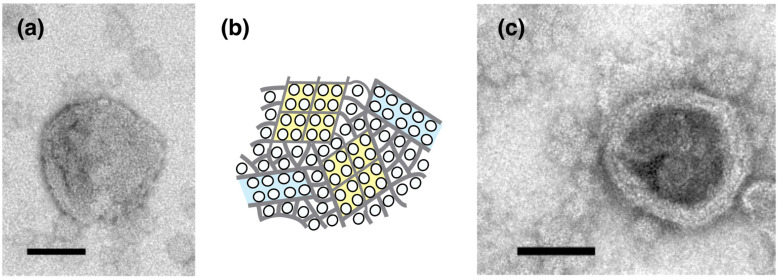
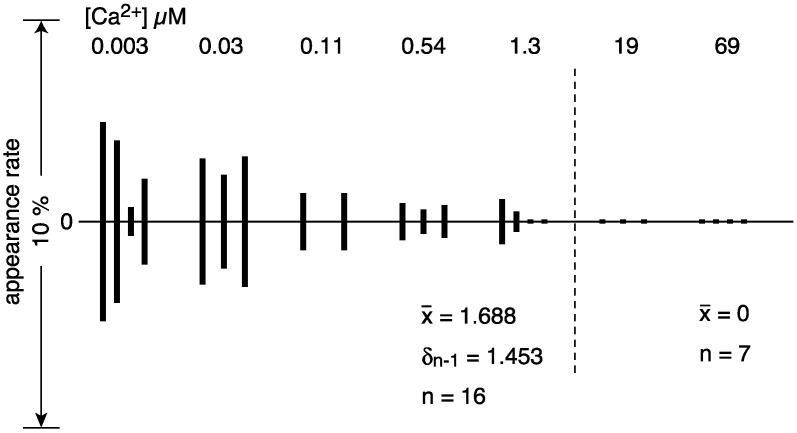
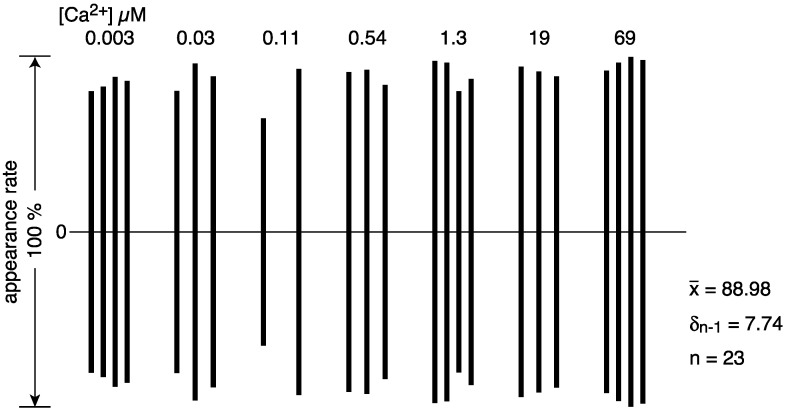
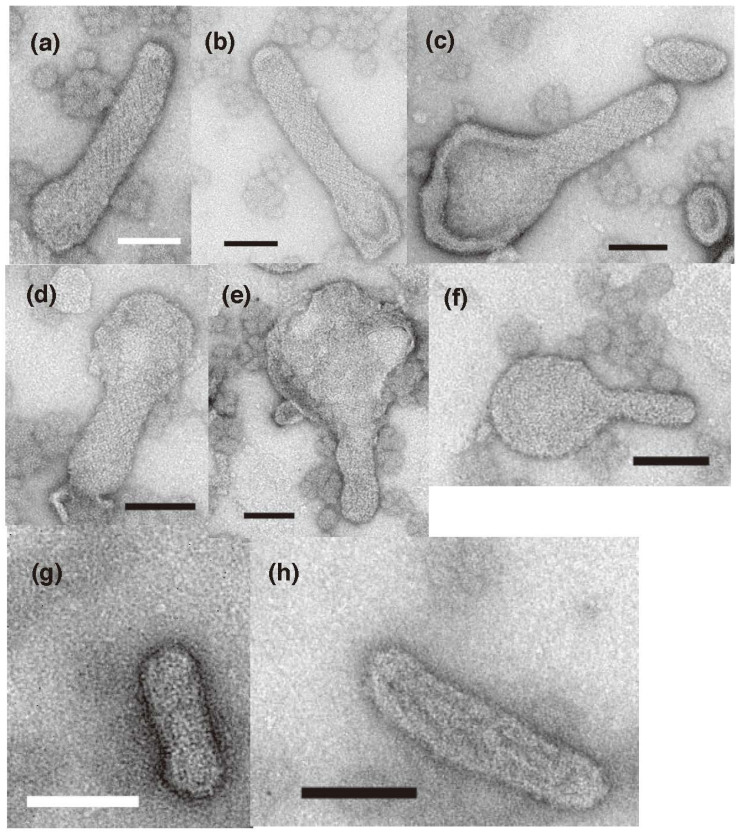
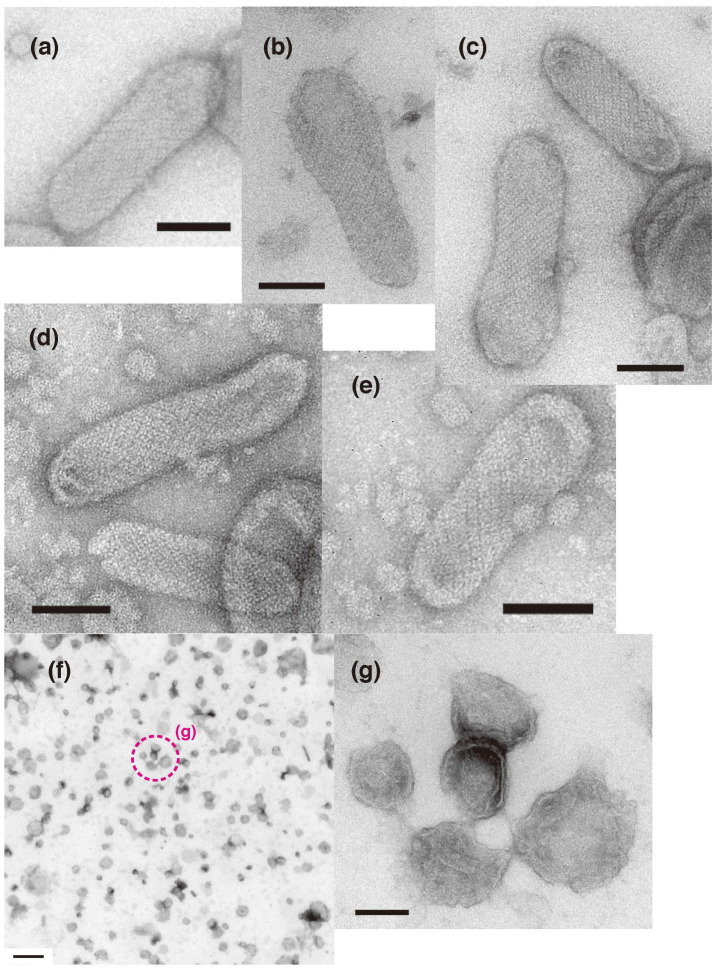
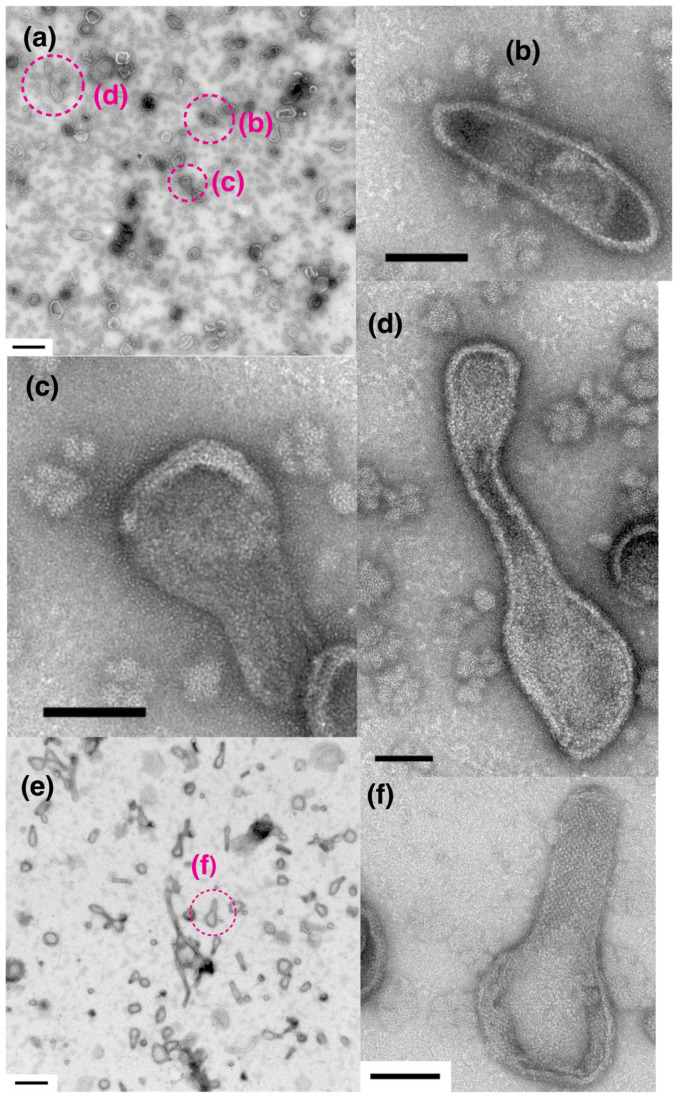
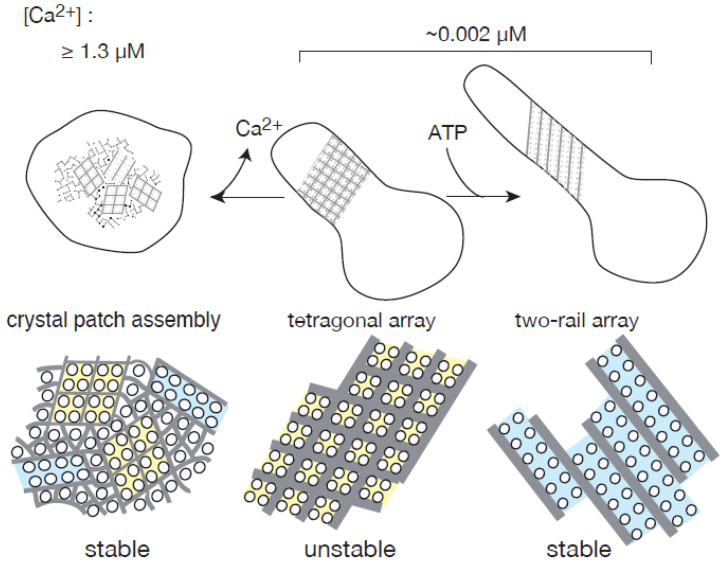
The Ca2+-ATPase is an integral transmembrane Ca2+ pump of the sarcoplasmic reticulum (SR). Crystallization of the cytoplasmic surface ATPase molecules of isolated scallop SR vesicles was studied at various calcium concentrations by negative stain electron microscopy. In the absence of ATP, round SR vesicles displaying an assembly of small crystalline patches of ATPase molecules were observed at 18 µM [Ca2+]. These partly transformed into tightly elongated vesicles containing ATPase crystalline arrays at low [Ca2+] (≤1.3 µM). The arrays were classified as ''tetramer'', "two-rail" (like a railroad) and ''monomer''. Their crystallinity was low, and they were unstable. In the presence of ATP (5 mM) at a low [Ca2+] of ~0.002 µM, "two-rail" arrays of high crystallinity appeared more frequently in the tightly elongated vesicles and the distinct tetramer arrays disappeared. During prolonged (~2.5 h) incubation, ATP was consumed and tetramer arrays reappeared. A specific ATPase inhibitor, thapsigargin, prevented both crystal formation and vesicle elongation in the presence of ATP. Together with the second part of this study, these data suggest that the ATPase forms tetramer units and longer tetramer crystalline arrays to elongate SR vesicles, and that the arrays transform into more stable "two-rail" forms in the presence of ATP at low [Ca2+].

Keywords: ATP; Ca2+-ATPase; cell dynamics; cell morphology; membrane endoskeleton; sarcoplasmic reticulum; scallop; thapsigargin; transmission microscopy; two-dimensional crystallization.


Conflict of interest statement

The authors declare no conflict of interest.

Figures

Figure 1
Figure 1
Diagram of a cross-striated adductor muscle cell of scallop in the resting state. The illustrations are based on the data of Castellani et al. (1989) [8], Sanger and Sanger (1985) [9], Loesser et al. (1992) [16] and Quinn et al. (1998) [17]. An illustration of the feet-like structure of the vertebrate cross-striated muscle can be found in [18].
Figure 2
Figure 2
Overview showing the appearance rates of different types of SR vesicle relative to the total number of vesicles at ~0.003–69.0 µM Ca2+. The five-type classification of the vesicles shown in Table S1 was simplified to four types: tightly elongated vesicles with crystalline arrays (yellow), tightly elongated vesicles without a crystalline array, but including vesicles with an assembly of crystal patches or unclear arrays (gray), crookedly elongated vesicles (pink) and round vesicles (green). The crookedly elongated vesicles and round vesicles also sometimes had an assembly of crystal patches or unclear arrays. The rates employed are the average percentages (see Table S1) of the number of each vesicular type to the total number of vesicles at the respective calcium concentrations. For convenience, the rates axis has been truncated; the region below 80% is not completely shown for the round vesicles.
Figure 3
Figure 3
Typical images of tightly elongated SR vesicles, predominantly displaying one of the three different crystalline arrays: tetragonal, “two-rail” and monomer arrays of 40 Å particles. (a,b,b’) Vesicles with the tetragonal array. (b’) Higher magnification image of the vesicle in (b). The four particles within the tetragons observed in (b) are marked with the dotted circles in (b’) (see text for details). A darker trench was observed between the tetragonal units. (c) Vesicles with the “two-rail” array. (c’) Higher magnification image of the vesicle in (c). Each “two-rail” array was separated by a darker trench. (d) Vesicles with a monomer array. (d’) Higher magnification image of the vesicle in panel (d). Each monomer is surrounded by a darker trench. (e) An overview picture of the vesicle populations. The dotted-circle (a) shown in (e) indicates the vesicle with a tetragonal array shown in (a). (fh) Illustrations of the tetragonal, two-rail and monomer arrays, respectively. The SR vesicle preparations were incubated at about 0.003 (d), 0.03 (a,b,e) and 0.11 (c) µM Ca2+ in the absence of ATP for 1 min after the addition of DDW (see “Section 4. Materials and Methods”). Scale bars in (ad): 100 nm. Scale bar in (e): 0.5 µm.
Figure 4
Figure 4
Typical images of crookedly elongated SR vesicles. SR vesicles were incubated at 0.002 (a) and 0.026 (b) µM Ca2+ in the absence of ATP for 1 min. Scale bar: 100 nm.
Figure 5
Figure 5
Typical images of the crystal patch assembly and unclear dispositions of the 40 Å particles. (a) vesicle containing crystal patch assembly. (b) Illustration of the crystal patch assembly. (c) Unclear disposition. SR vesicles were incubated at 0.026 (a) and 0.11 (c) μM Ca2+ in the absence of ATP for 1 min. Scale bar:100 nm.
Figure 6
Figure 6
Percentage (%) of the number of tightly elongated vesicles with an ATPase crystalline array relative to the total number of vesicles in each of the four views recorded at the respective calcium concentration in the absence of ATP (see text for details). Vesicles with tetragon, two-rail or monomer crystals or a mixture of these crystal types, were included. Vesicles with crystalline arrays predominantly appeared at ~1.3 µM Ca2+ or less.
Figure 7
Figure 7
Percentages (%) of the number of round vesicles with a crystal patch assembly of ATPase relative to the total number of vesicles present in each of the four views recorded at the respective calcium concentration in the absence of ATP (see text for details).
Figure 8
Figure 8
Time course of the morphology of SR vesicles during incubation at a low calcium concentration (~0.002 µM) in the absence of ATP. (ac) SR vesicles after a 37-min incubation. (df) SR vesicles after 93 min. (g,h) SR vesicles after overnight incubation. Orderly arrays were degraded after 93 min and had disappeared after overnight incubation. The incubation was started by the addition of water. Before the addition of water, the SR preparation was incubated in the buffer solution for 5–9 min (see “Section 4. Materials and Methods”). Scale bar: 100 nm.
Figure 9
Figure 9
Time course of the morphology of SR vesicles during incubation at a low calcium concentration (~0.002 µM) with 5 mM ATP. (ac) SR vesicles after 1 min. (d,e) SR vesicles after about 2.5 h. Because all ATP present was consumed during the 2.5 h incubation (see main text), “two-rail” arrays degraded, and tetragon arrays dominated. In (ae), before the addition of ATP, the SR preparation was preincubated at a low [Ca2+] (~0.002 µM) for 5–9 min (see “Section 4. Materials and Methods”). (f,g) SR vesicles reacted with ATP for 1 min after overnight incubation at the low [Ca2+] in the absence of ATP. Panel (g) is a higher magnification image of the dotted circle (g) in panel (f). Crystalline arrays were not observed. Scale bar in (ae,g): 100 nm. Scale bar in panel (f) 0.5 µm.
Figure 10
Figure 10
Effect of thapsigargin (TG) on the crystallization of 40 Å ATPase particles of SR vesicles in the presence of ATP. (ad) SR vesicles with TG (2 µM) and dimethylsulfoxide (DMSO) (0.12% (v/v)). (bd) are higher magnification images of the dotted circles (bd) in (a), respectively. (e,f) Vesicles treated with DMSO alone. (f) Higher magnification image of the dotted circle (f) in panel (e). In (ad), TG was added to the reaction mixture at the ratio of 6.7 nmol/mg SR protein, assuming that 40–50% of the total protein present was Ca2+-ATPase [15]. The ratio of TG to the scallop Ca2+-ATPase protein (13.4–16.8 nmol TG/mg of the ATPase protein) was higher than that (10 mmol/mg Ca2+-ATPase protein of the rabbit SR) [23] required for the complete inhibition of the Ca2+-ATPase activity of the Ca2+-ATPase rich (~90%) rabbit SR. After the TG treatment, the SR was reacted with ATP for 1 min. Scale bar in panels (a,e): 0.5 µm. Scale bar in panels (be): 100 nm.
Figure 11
Figure 11
Schematic representation of the formation and development of a crystalline array of Ca2+-ATPase molecules in scallop SR. ATP stabilizes the vesicle’s crystalline array to elongate the vesicle.

Similar articles

Cited by

References

    1. De Meis L., Inesi G. The transport of calcium by sarcoplasmic reticulum and various microsomal preparations. In: Carafoli E., editor. Membrane Transport of Calcium. Academic Press, Inc.; Orland, FL, USA: 1982. pp. 141–186.
    1. MacLennan D.H., Brandl C.J., Korczak B., Green N.M. Amino-acid sequence of a Ca2+ + Mg2+-dependent ATPase from rabbit muscle sarcoplasmic reticulum, deduced from its complimentary DNA sequence. Nature. 1985;316:696–700. doi: 10.1038/316696a0. - DOI - PubMed
    1. Brandl C.J., Green N.M., Korczak B., MacLennan D.H. Two Ca2+ ATPase genes: Homologies and mechanistic implications of deduced amino acid sequences. Cell. 1986;44:597–607. doi: 10.1016/0092-8674(86)90269-2. - DOI - PubMed
    1. Hasselbach W. Relaxing factor and the relaxation of muscle. In: Bupler J.A.V., Huxley H.E., editors. Progress in Biophysics and Molecular Biology. Pergamon Press; London, UK: 1964. pp. 167–222.
    1. Ebashi S., Endo M. Calcium ion and muscle contraction. In: Bupler J.A.V., Huxley H.E., editors. Progress in Biophysics and Molecular Biology. Pergamon Press; London, UK: 1968. pp. 123–183. - PubMed

MeSH terms