

Barrett's Metaplasia Progression towards Esophageal Adenocarcinoma: An Attempt to Select a Panel of Molecular Sensors and to Reflect Clinical Alterations by Experimental Models
- PMID: 35328735
- PMCID: PMC8955539
- DOI: 10.3390/ijms23063312
Barrett's Metaplasia Progression towards Esophageal Adenocarcinoma: An Attempt to Select a Panel of Molecular Sensors and to Reflect Clinical Alterations by Experimental Models
Abstract
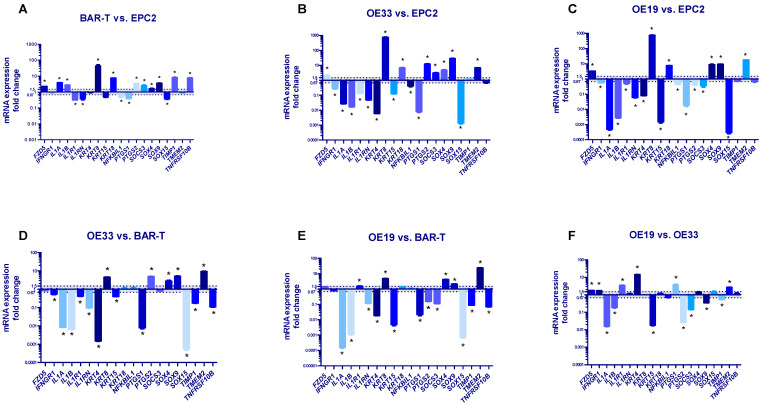
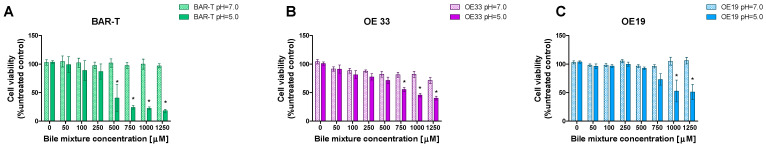
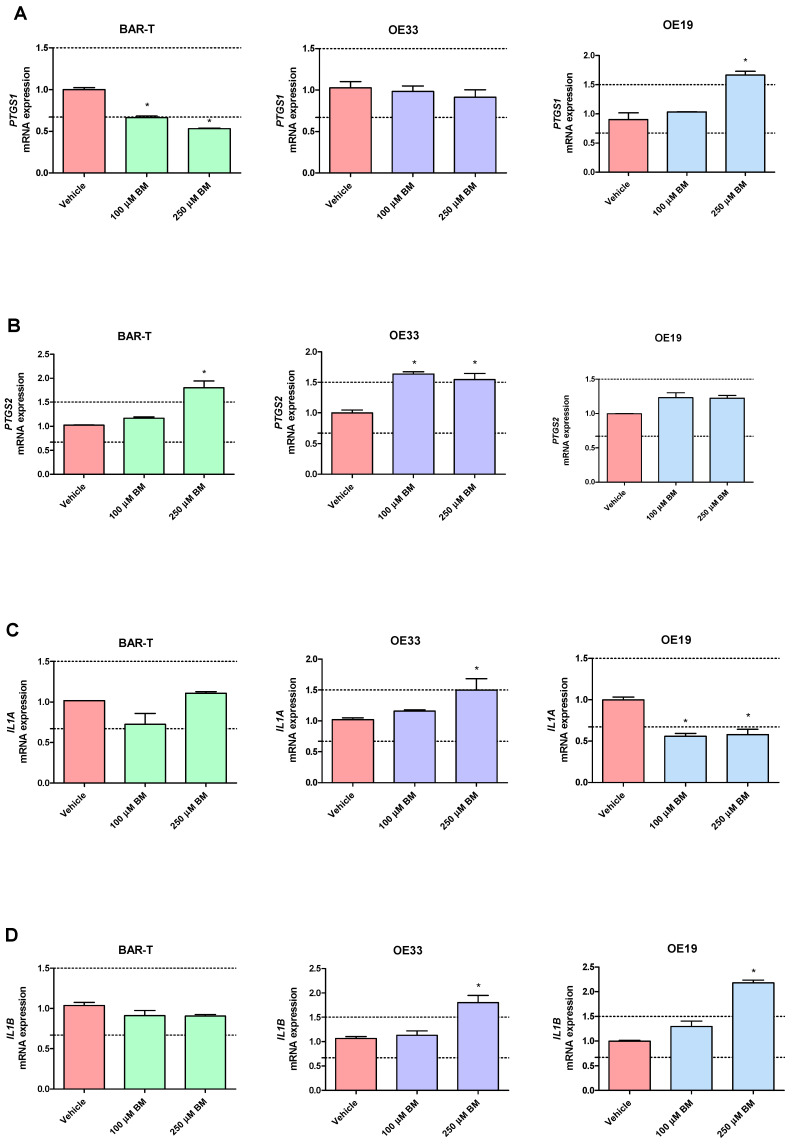
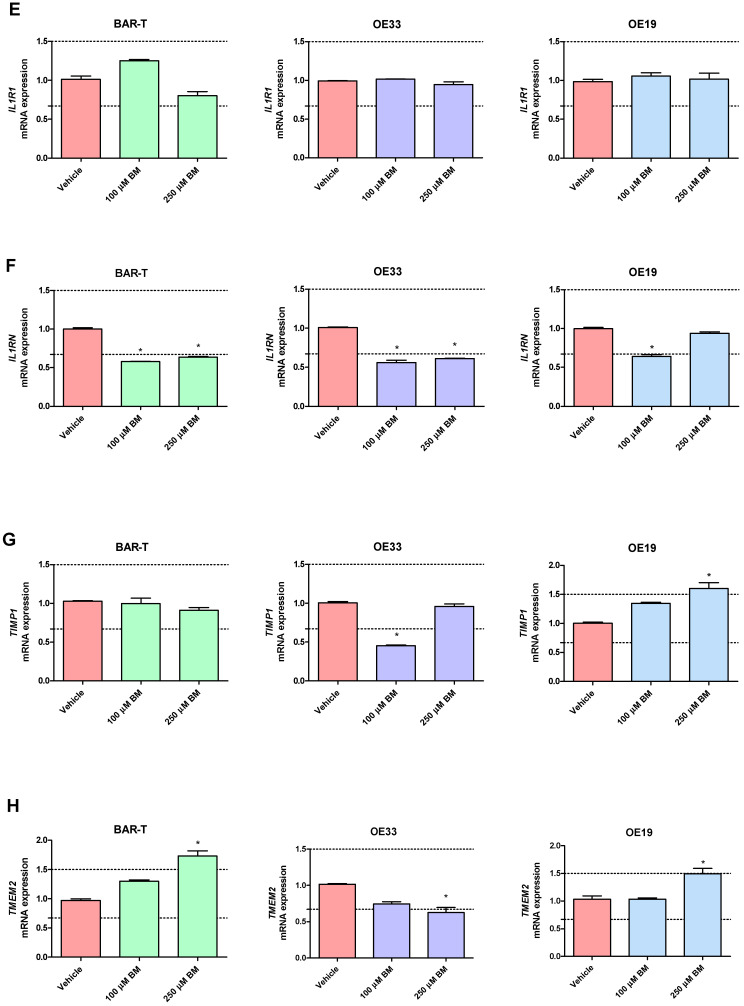
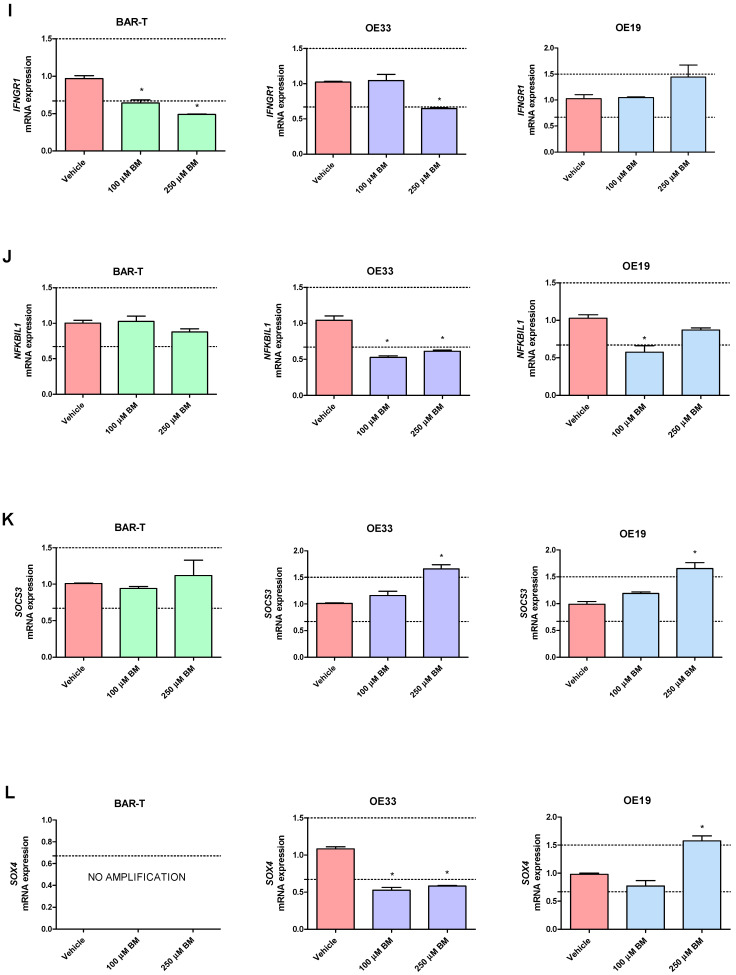
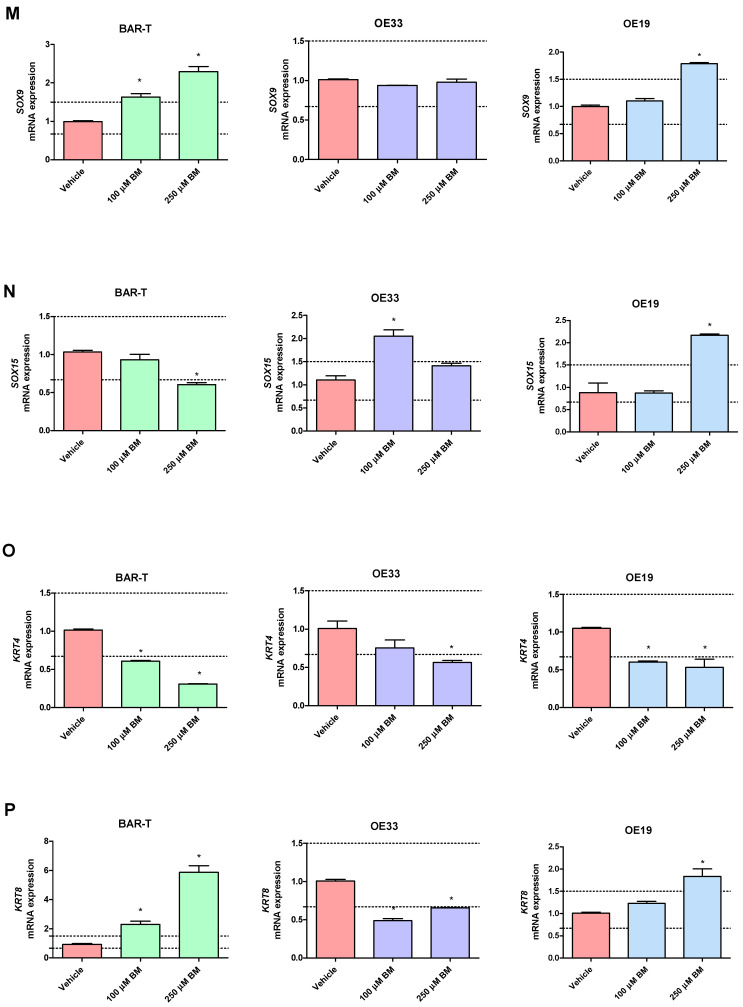
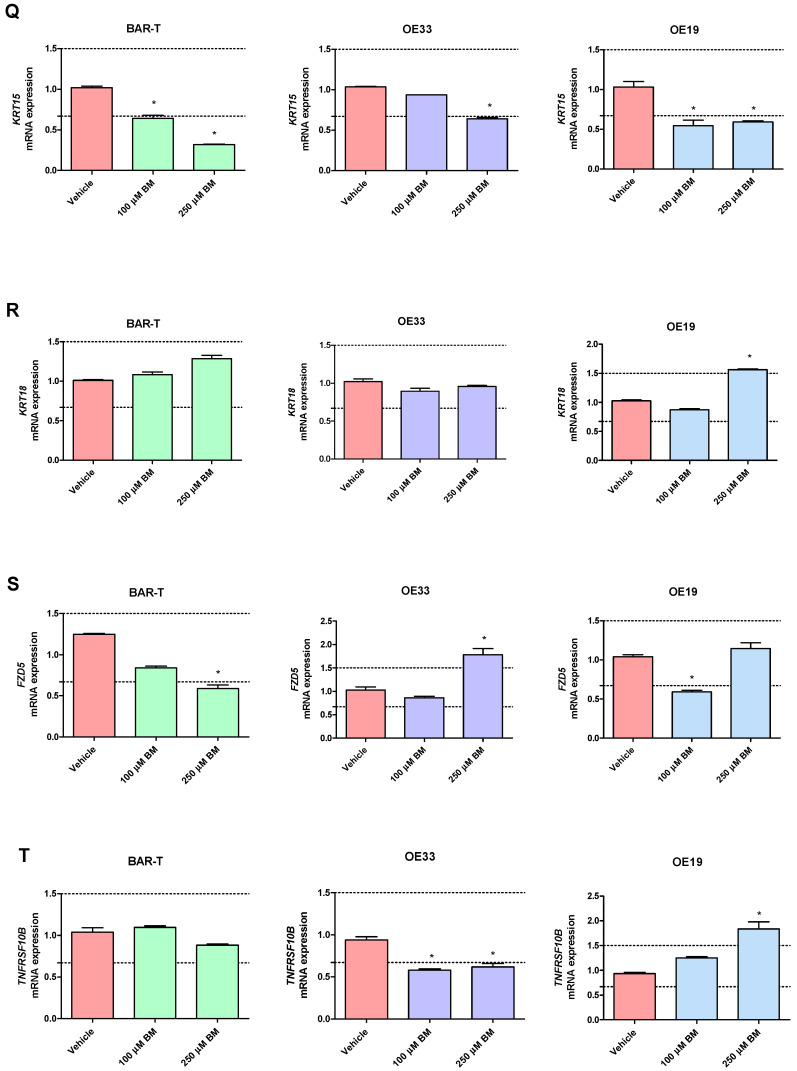
The molecular processes that predispose the development of Barrett's esophagus (BE) towards esophageal adenocarcinoma (EAC) induced by gastrointestinal reflux disease (GERD) are still under investigation. In this study, based on a scientific literature screening and an analysis of clinical datasets, we selected a panel of 20 genes covering BE- and EAC-specific molecular markers (FZD5, IFNGR1, IL1A, IL1B, IL1R1, IL1RN, KRT4, KRT8, KRT15, KRT18, NFKBIL1, PTGS1, PTGS2, SOCS3, SOX4, SOX9, SOX15, TIMP1, TMEM2, TNFRSF10B). Furthermore, we aimed to reflect these alterations within an experimental and translational in vitro model of BE to EAC progression. We performed a comparison between expression profiles in GSE clinical databases with an in vitro model of GERD involving a BE cell line (BAR-T) and EAC cell lines (OE33 and OE19). Molecular responses of cells treated with acidified bile mixture (BM) at concentration of 100 and 250 μM for 30 min per day were evaluated. We also determined a basal mRNA expression within untreated, wild type cell lines on subsequent stages of BE and EAC development. We observed that an appropriately optimized in vitro model based on the combination of BAR-T, OE33 and OE19 cell lines reflects in 65% and more the clinical molecular alterations observed during BE and EAC development. We also confirmed previous observations that exposure to BM (GERD in vitro) activated carcinogenesis in non-dysplastic cells, inducing molecular alternations in the advanced stages of BE. We conclude that it is possible to induce, to a high extent, the molecular profile observed clinically within appropriately and carefully optimized experimental models, triggering EAC development. This experimental scheme and molecular marker panel might be implemented in further research, e.g., aiming to develop and evaluate novel compounds and prodrugs targeting GERD as well as BE and EAC prevention and treatment.
Keywords: Barrett’s esophagus; bile acids; cancer transformation; esophageal adenocarcinoma; gastroesophageal reflux disease; translational model.
Conflict of interest statement
The authors declare no conflict of interest.
Figures
Similar articles
-
Disintegrin and metalloproteinases (ADAMs) expression in gastroesophageal reflux disease and in esophageal adenocarcinoma.Clin Transl Oncol. 2017 Jan;19(1):58-66. doi: 10.1007/s12094-016-1503-3. Epub 2016 Mar 30. Clin Transl Oncol. 2017. PMID: 27026568 Clinical Trial.
-
Response to TNF-α Is Increasing Along with the Progression in Barrett's Esophagus.Dig Dis Sci. 2017 Dec;62(12):3391-3401. doi: 10.1007/s10620-017-4821-6. Epub 2017 Oct 30. Dig Dis Sci. 2017. PMID: 29086334
-
In-depth characterization of the Wnt-signaling/β-catenin pathway in an in vitro model of Barrett's sequence.BMC Gastroenterol. 2019 Mar 6;19(1):38. doi: 10.1186/s12876-019-0957-5. BMC Gastroenterol. 2019. PMID: 30841855 Free PMC article.
-
From genetics to signaling pathways: molecular pathogenesis of esophageal adenocarcinoma.Biochim Biophys Acta Rev Cancer. 2019 Aug;1872(1):37-48. doi: 10.1016/j.bbcan.2019.05.003. Epub 2019 May 30. Biochim Biophys Acta Rev Cancer. 2019. PMID: 31152823 Free PMC article. Review.
-
Gastroesophageal reflux and Barrett's esophagus: a pathway to esophageal adenocarcinoma.Updates Surg. 2018 Sep;70(3):339-342. doi: 10.1007/s13304-018-0564-y. Epub 2018 Jul 23. Updates Surg. 2018. PMID: 30039277 Review.
References
-
- Kamangar F., Nasrollahzadeh D., Safiri S., Sepanlou S.G., Fitzmaurice C., Ikuta K.S., Bisignano C., Islami F., Roshandel G., Lim S.S., et al. The global, regional, and national burden of oesophageal cancer and its attributable risk factors in 195 countries and territories, 1990–2017: A systematic analysis for the Global Burden of Disease Study 2017. Lancet Gastroenterol. Hepatol. 2020;5:582–597. doi: 10.1016/S2468-1253(20)30007-8. - DOI - PMC - PubMed
-
- Global Burden of Disease Cancer Collaboration Global, regional, and national cancer incidence, mortality, years of life lost, years lived with disability, and disability-adjusted life-years for 29 cancer groups, 1990 to 2017: A systematic analysis for the global burden of disease study. JAMA Oncol. 2019;5:1749–1768. doi: 10.1001/jamaoncol.2019.2996. - DOI - PMC - PubMed
-
- Dubecz A., Solymosi N., Stadlhuber R.J., Schweigert M., Stein H.J., Peters J.H. Does the incidence of adenocarcinoma of the esophagus and gastric cardia continue to rise in the twenty-first century?—A SEER database analysis. J. Gastrointest. Surg. 2014;18:124–129. doi: 10.1007/s11605-013-2345-8. - DOI - PubMed
MeSH terms
Substances
Supplementary concepts
Grants and funding
LinkOut - more resources
Full Text Sources
Medical
Research Materials
Miscellaneous
