Identification and Characterization of Salt- and Drought-Responsive AQP Family Genes in Medicagosativa L
- PMID: 35328763
- PMCID: PMC8950044
- DOI: 10.3390/ijms23063342
Identification and Characterization of Salt- and Drought-Responsive AQP Family Genes in Medicagosativa L
Abstract
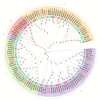
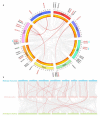
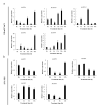
Aquaporins (AQP) are distributed ubiquitously in plants, and they play important roles in multiple aspects of plant growth and development, as well as in plant resistance to various environmental stresses. In this study, 43 MsAQP genes were identified in the forage crop Medicago sativa. All the MsAQP proteins were clustered into four subfamilies based on sequence similarity and phylogenetic relationship, including 17 TIPs, 14 NIPs, 9 PIPs and 3 SIPs. Analyses of gene structure and conserved domains indicated that the majority of the deduced MsAQP proteins contained the signature transmembrane domains and the NPA motifs. Analyses on cis-acting elements in the promoter region of MsAQP genes revealed the presence of multiple and diverse stress-responsive and hormone-responsive cis-acting elements. In addition, by analyzing the available and comprehensive gene expression data of M. truncatula, we screened ten representative MtAQP genes that were responsive to NaCl or drought stress. By analyzing the sequence similarity and phylogenetic relationship, we finally identified the corresponding ten salt- or drought-responsive AQP genes in M. sativa, including three MsTIPs, three MsPIPs and four MsNIPs. The qPCRs showed that the relative expression levels of these ten selected MsAQP genes responded differently to NaCl or drought treatment in M. sativa. Gene expression patterns showed that most MsAQP genes were preferentially expressed in roots or in leaves, which may reflect their tissue-specific functions associated with development. Our results lay an important foundation for the future characterization of the functions of MsAQP genes, and provide candidate genes for stress resistance improvement through genetic breeding in M. sativa.
Keywords: AQP genes; Medicago sativa; aquaporin; phylogenetic analysis; salt and drought stresses.
Conflict of interest statement
The authors declare no conflict of interest.
Figures


Similar articles
-
Genome-Wide Analysis of Aquaporins Gene Family in Populus euphratica and Its Expression Patterns in Response to Drought, Salt Stress, and Phytohormones.Int J Mol Sci. 2024 Sep 23;25(18):10185. doi: 10.3390/ijms251810185. Int J Mol Sci. 2024. PMID: 39337672 Free PMC article.
-
Genome-Wide Identification and Characterization of Growth Regulatory Factor Family Genes in Medicago.Int J Mol Sci. 2022 Jun 21;23(13):6905. doi: 10.3390/ijms23136905. Int J Mol Sci. 2022. PMID: 35805911 Free PMC article.
-
Comparative phylogenetic analysis of aquaporins provides insight into the gene family expansion and evolution in plants and their role in drought tolerant and susceptible chickpea cultivars.Genomics. 2020 Jan;112(1):263-275. doi: 10.1016/j.ygeno.2019.02.005. Epub 2019 Feb 28. Genomics. 2020. PMID: 30826442
-
The Role of Transmembrane Proteins in Plant Growth, Development, and Stress Responses.Int J Mol Sci. 2022 Nov 7;23(21):13627. doi: 10.3390/ijms232113627. Int J Mol Sci. 2022. PMID: 36362412 Free PMC article. Review.
-
Divergent structures and functions of the Cupin proteins in plants.Int J Biol Macromol. 2023 Jul 1;242(Pt 1):124791. doi: 10.1016/j.ijbiomac.2023.124791. Epub 2023 May 9. Int J Biol Macromol. 2023. PMID: 37164139 Review.
Cited by
-
Genome-Wide Identification and Characterization of the Msr Gene Family in Alfalfa under Abiotic Stress.Int J Mol Sci. 2023 Jun 1;24(11):9638. doi: 10.3390/ijms24119638. Int J Mol Sci. 2023. PMID: 37298589 Free PMC article.
-
Identification and characterization of cold-responsive aquaporins from the larvae of a crambid pest Agriphila aeneociliella (Eversmann) (Lepidoptera: Crambidae).PeerJ. 2023 Nov 13;11:e16403. doi: 10.7717/peerj.16403. eCollection 2023. PeerJ. 2023. PMID: 38025732 Free PMC article.
-
Seeds Priming with Melatonin Improves Root Hydraulic Conductivity of Wheat Varieties under Drought, Salinity, and Combined Stress.Int J Mol Sci. 2024 May 6;25(9):5055. doi: 10.3390/ijms25095055. Int J Mol Sci. 2024. PMID: 38732273 Free PMC article.
References
-
- Türkan I., Demiral T. Recent developments in understanding salinity tolerance. Environ. Exp. Bot. 2009;67:2–9. doi: 10.1016/j.envexpbot.2009.05.008. - DOI
-
- Sivakumar M.V.K., Das H.P., Brunini O. Impacts of present and future climate variability and change on agriculture and forestry in the arid and semi-arid tropics. Clim. Chang. 2005;70:31–72. doi: 10.1007/s10584-005-5937-9. - DOI
MeSH terms
Substances
LinkOut - more resources
Full Text Sources

