. 2022 Mar 20;23(6):3359.
doi: 10.3390/ijms23063359.

Pericentromeric Non-Coding DNA Transcription Is Associated with Niche Impairment in Patients with Ineffective or Partially Effective Multiple Myeloma Treatment

Affiliations

Pericentromeric Non-Coding DNA Transcription Is Associated with Niche Impairment in Patients with Ineffective or Partially Effective Multiple Myeloma Treatment

Natella I Enukashvily et al. Int J Mol Sci. .

Abstract

Mesenchymal stromal cells (MSC) 'educated' by tumor cells are an essential component of the multiple myeloma (MM) tumor microenvironment (TME) involved in tumor progression. Transcription of tandemly repeated (TR) non-coding DNA is often activated in many tumors and is required for tumor progression and cancer cells genome reorganization. The aim of the work was to study functional properties including the TR DNA transcription profile of MSC from the hematopoietic niche of treated MM patients. Healthy donors (HD) and patients after bortezomib-based treatment (with partial or complete response, PoCR, and non-responders, NR) were enrolled in the study. Their trephine biopsies were examined histologically to evaluate the hematopoietic niche. MSC cultures obtained from the biopsies were used for evaluation of the proliferation rate, osteogenic differentiation, presence of tumor MSC markers, resistance to bortezomib, and pericentromeric TR DNA transcription level. The MSC 'education' by multiple myeloma cells was mimicked in co-culture experiments with or without bortezomib. The TR DNA transcription profile was accessed. The histological examination revealed the persistence of the tumor microenvironment (especially of the vasculature) in treated patients. In co-culture experiments, MSC of bortezomib-treated patients were more resistant to bortezomib and protected cancer MM cells of the RPMI8226 cell line more effectively than HD-MSC did. The MSC obtained from PoCR and NR samples differed in their functional properties (proliferation capacity, osteogenic potential, and cancer-associated fibroblasts markers). Transcriptome analysis revealed activation of the TR transcription in cells of non-hematopoietic origin from NR patients' bone marrow. The pericentromeric TR DNA of HS2/HS3 families was among the most upregulated in stromal MSC but not in cancer cells. The highest level of transcription was observed in NR-MSC. Transcription of HS2/HS3 was not detected in healthy donors MSC unless they were co-cultured with MM cancer cells and acquired cancer-associated phenotype. Treatment with TNFα downregulated HS2/HS3 transcription in MSC and upregulated in MM cells. Our results suggest that the hematopoietic niche retains the cancer-associated phenotype after treatment. Pericentromeric non-coding DNA transcription is associated with the MSC cancer-associated phenotype in patients with ineffective or partially effective multiple myeloma treatment.

Keywords: human satellite 2; human satellite 3; long non-coding RNA; mesenchymal stromal cells; microvessels; multiple myeloma; non-coding DNA transcripts; tumor microenvironment.


Conflict of interest statement

The authors declare no conflict of interest. The funders had no role in the design of the study; in the collection, analyses, or interpretation of data; in the writing of the manuscript, or in the decision to publish the results.

Figures

Figure 1
Figure 1
Histopathological examination of BM from HD and NR patients. (a,b) IHC detection of PC (brown color) in BM of NR patient (a) and HD (b) with an antibody against CD138. (c,d) IHC detection of microvessels (brown color) in BM of NR patient (c) and HD (d) with an antibody against CD34. (e,f) IHC detection of α-SMA+ cell (brown color) in BM of NR patient (e) and HD (f). The scale bar–100 µm. (gi) Quantifications of corresponding IHC. The percentage of the images’ area covered by the IHC staining is plotted on Y-axis. The data are shown as mean ± SD. ** p < 0.01, *** p < 0.001. Abbreviations: BM = bone marrow; HD = healthy donors; NR = non-responder; PC = plasma cells, IHC = immunohistochemical staining. Arrows are pointing the areas of positive staining.
Figure 2
Figure 2
MSC from HD (a) or MM patients (b) supported the survival of MM cells of RPMI8226 cell line during treatment with bortezomib, a standard medication to treat MM. RPMI8226 were grown in non-contact co-culture with HD-MSC or MM-MSC in the presence of bortezomib for 48 h. Then, RPMI8226 (a,b) and MSC (c) were harvested, stained with annexin-FITC and propidium iodide and subjected to flow cytometry to reveal live and apoptotic cells. X-axis—bortezomib concentration, nM; Y-axis—the percentage of live cells defined as cells negatively stained with both annexin and propidium iodide. ** p < 0.01, * p < 0.05. Abbreviations: MSC = mesenchymal stem cells; HD-MSC = mesenchymal stem cells of healthy donors; HD = healthy donors; MM = multiple myeloma; RPMI8226 = a MM cell line (RPMI8226).
Figure 3
Figure 3
The proliferation rate of MM-MSC and HD-MSC. MSC cultures from patients were divided into groups with decreased (a) and normal proliferation capacity (b); (c) part of PoCR patients’ MSC cultures had normal proliferation rate (white column) while the majority of samples had decreased proliferation capacity (grey column); (d) all of NR proliferated at a slower rate (similar to the rate shown in (a). Abbreviations: NR = non-responders, patients with ineffective treatment; PoCR = partial or complete response, MSC = mesenchymal stem cells, HD-MSC = mesenchymal stem cells of healthy donors; MM-MSC = mesenchymal stem cells from bone marrow of patients with multiple myeloma. * p < 0.05.
Figure 4
Figure 4
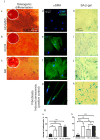
Osteogenic potential (ac), TME markers (dk), in HD-MSC (a,d,h), PoCR MSC (b,e,i), and NR-MSC (c,f,j). Fibroblasts with the drug-induced senescence were used as a positive control (g,k). Panel I: (a,b,c) Calcifications revealed by staining with Alizarin Red, insets in upper left corners of each image represent a general view of a plate well; (dg) staining with an antibody against αSMA (green), nuclei are counterstained with DAPI; (hk) activated SA-β-gal staining; nuclei are counterstained with DAPI. The scale bars for each panel are shown in the images. Panel II: The results of staining quantification: number of cells stained with (a) an anti αSMA antibody or (b) with a dye revealing activated SA-β-gal is plotted on the Y-axis. ** p < 0.01, *** p < 0.001, ns = non-significant (p > 0.05). Abbreviations: DAPI = 4’,6-diamidino-2-phenylindole; HD-MSC = mesenchymal stromal cells from healthy donors; HS2/HS3 = human satellite 2,3; MSC = mesenchymal stromal cells; NR = non-responder; PoCR = partial or complete response; SA-β-gal = senescence-associated β-galactosidase; TME = tumor microenvironment; αSMA = α-smooth muscle actin.
Figure 5
Figure 5
HS2/HS3 TR DNA transcription in MM-MSC. (a) A heatmap of TR transcripts TPM (transcripts per million) in single-cell transcriptomes of different BM populations; (b) a heatmap of TR transcripts TPM in single-cell MM transcriptomes of patients with different disease; TR DNA families abbreviations: ALR = α-satellite repeats, BSR = β-satellite repeats, GSR = γ-satellite repeats, HSR = human satellite repeats; red lines mark HS2/HS3 families. (c) qPCR of cDNA samples from NR-MSC, PoCR MSC, HD-MSC, and RPMI8226; fold change is plotted on the Y-axis, the red dashed line marks the value of transcription in RPMI8226 set as 1; GAPDH was used as a reference gene. (d) Pericentromeric HS2/HS3 transcripts revealed in BM trephines of MM patients by DNA–RNA FISH (red). Samples were co-stained (green) either with an anti αSMA (to reveal αSMA+ MSC) or anti-CD56 antibody (to reveal cancer cells). (e) After trephines examination, HS2/HS3 transcripts (red) were probed in MSC and RPMI8226 grown in vitro by DNA–RNA FISH; MSC were co-stained with an antibody against αSMA (green). (f) HS2/HS3 transcription in MM-MSC of patients with different responses to treatment. The results of quantification are given below the images. Nuclei in (df) were counterstained with DAPI. The scale bar is indicated in the images. Abbreviations: DAPI = 4’,6-diamidino-2-phenylindole; FISH = fluorescence in situ hybridization; HS2/HS3 = human satellite 2,3; MSC = mesenchymal stromal cells; PoCR = partial or complete response; αSMA = α-smooth muscle actin. ** p < 0.01, *** p < 0.001, ns = non-significant (p > 0.05).
Figure 6
Figure 6
HS2/HS3 transcription (red) and αSMA expression (green) in HD-MSC (a,c) and RPMI (b,d) before (a,b) and after (c,d) non-contact (c) and contact (d) co-culturing. In contact conditions, RPMI8226 cells tended to attach to MSC. Therefore, in (d) RPMI 8226 cells are shown with a background of MSC αSMA fibers. The scale bars are shown on the images. Abbreviations: DAPI = 4ʹ,6-diamidino-2-phenylindole; HD-MSC = mesenchymal stromal cells from healthy donors; HS2/HS3 = human satellite 2/3; MSC = mesenchymal stromal cells; αSMA = α-smooth muscle actin.
Figure 7
Figure 7
Influence of proinflammation cytokines (TNFα and IL-6) and VEGF on HS2/HS3 transcription. (a) Primers verification by PCR on genomic DNA (gDNA) and cDNA. MW marker is shown on the right sides of the gels, temperatures of annealing are shown below the images; (b) qPCR of HS2/HS3 transcripts in cells treated with TNFα, in each group transcription in untreated cells was set as 1 (red dashed line); (c) qPCR of HS2/HS3 transcripts in cells treated with IL-6 or VEGF, in each group transcription in untreated cells was set as 1 (red dashed line). * p < 0.05.

References

    1. Xu S., De Veirman K., De Becker A., Vanderkerken K., Van Riet I. Mesenchymal stem cells in multiple myeloma: A therapeutical tool or target? Leukemia. 2018;32:1500–1514. doi: 10.1038/s41375-018-0061-9. - DOI - PMC - PubMed
    1. Palumbo A., Anderson K. Multiple Myeloma. N. Engl. J. Med. 2011;364:1046–1060. doi: 10.1056/NEJMra1011442. - DOI - PubMed
    1. Bessmeltsev S.S. Multiple myeloma (pathogenesis, clinical features, diagnosis, differential diagnosis). Part I. Clin. Oncohematol. 2013;6:237–257.
    1. Wang H., Wang L., Chi P., Wang W., Chen X., Geng Q., Xia Z., Lu Y. High level of interleukin-10 in serum predicts poor prognosis in multiple myeloma. Br. J. Cancer. 2016;114:463–468. doi: 10.1038/bjc.2016.11. - DOI - PMC - PubMed
    1. Aksenova A.Y., Zhuk A.S., Lada A.G., Zotova I.V., Stepchenkova E.I., Kostroma I.I., Gritsaev S.V., Pavlov Y.I. Genome Instability in Multiple Myeloma: Facts and Factors. Cancers. 2021;13:5949. doi: 10.3390/cancers13235949. - DOI - PMC - PubMed