. 2022 Mar 21;23(6):3378.
doi: 10.3390/ijms23063378.

Rapid Identification of Pollen- and Anther-Specific Genes in Response to High-Temperature Stress Based on Transcriptome Profiling Analysis in Cotton

Affiliations

Rapid Identification of Pollen- and Anther-Specific Genes in Response to High-Temperature Stress Based on Transcriptome Profiling Analysis in Cotton

Rui Zhang et al. Int J Mol Sci. .

Abstract

Anther indehiscence and pollen sterility caused by high temperature (HT) stress have become a major problem that decreases the yield of cotton. Pollen- and anther-specific genes play a critical role in the process of male reproduction and the response to HT stress. In order to identify pollen-specific genes that respond to HT stress, a comparative transcriptome profiling analysis was performed in the pollen and anthers of Gossypium hirsutum HT-sensitive Line H05 against other tissue types under normal temperature (NT) conditions, and the analysis of a differentially expressed gene was conducted in the pollen of H05 under NT and HT conditions. In total, we identified 1111 pollen-specific genes (PSGs), 1066 anther-specific genes (ASGs), and 833 pollen differentially expressed genes (DEGs). Moreover, we found that the late stage of anther included more anther- and pollen-specific genes (APSGs). Stress-related cis-regulatory elements (CREs) and hormone-responsive CREs are enriched in the promoters of APSGs, suggesting that APSGs may respond to HT stress. However, 833 pollen DEGs had only 10 common genes with 1111 PSGs, indicating that PSGs are mainly involved in the processes of pollen development and do not respond to HT stress. Promoters of these 10 common genes are enriched for stress-related CREs and MeJA-responsive CREs, suggesting that these 10 common genes are involved in the process of pollen development while responding to HT stress. This study provides a pathway for rapidly identifying cotton pollen-specific genes that respond to HT stress.

Keywords: Gossypium hirsutum; high-temperature stress; male-sterility; pollen-specific genes.


Conflict of interest statement

The authors declare no conflict of interest.

Figures
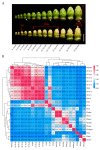
Figure 1
Figure 1
Phenotype of H05 anthers under Normal Temperature (NT) conditions and Pearson’s correlation coefficient r matrix of 22 sequenced tissues. (A) Phenotype of H05 anthers at different development stages under NT conditions. TS, tetrad stage (anther in 6–7 mm bud with tetrads). TDS, tapetal degradation stage (anther in 9–14 mm bud with uninucleate microspores or binucleate microspores). ADS, anther dehiscence stage (anther in 19–24 mm and ≥24 mm bud with mature pollen grains). The white arrow represents the nectary. Bud length: from the nectary to the top of the bud. Scale bars = 1 cm; (B) Pearson’s correlation coefficient r matrix of 22 sequenced tissues under NT conditions. TPM values for the transcripts of 70,199 genes were used to perform this correlation analysis. Pearson’s correlation coefficient r was calculated by R language and filled as numbers in this matrix. Pearson’s correlation matrix was drawn by heatmap software. Twenty-two sequenced tissues of H05: mature pollen at anthesis under NT (NTpollen), anther in 3–5 mm bud under NT (NT3-5), anther in 5–6 mm bud under NT (NT5-6), anther in 6–7 mm bud under NT (NT6-7), anther in 7–8 mm bud under NT (NT7-8), anther in 8–9 mm bud under NT (NT8-9), anther in 9–10 mm bud under NT (NT9-10), anther in 10–11 mm bud under NT (NT10-11), anther in 11–12 mm bud under NT (NT11-12), anther in 12–13 mm bud under NT (NT12-13), anther in 13–14 mm bud under NT (NT13-14), anther in 14–16 mm bud under NT (NT14-16), anther in 16–19 mm bud (NT16-19), anther in 19–24 mm bud (NT19-24), root under NT (NTroot), stem under NT (NTstem), leaf under NT (NTleaf), bract under NT (NTbract), sepal under NT (NTsepal), petal under NT (NTpetal), stigma under NT (NTstigma), and ovlue under NT (NTovlue).
Figure 2
Figure 2
The distribution of transcriptional levels, PSGs and ASGs in H05 tissues. (A) The distribution of transcriptional levels grouped by abundances in the nine selected H05 tissues under NT conditions. Very highly expressed genes (VHEGs), highly expressed genes (HEGs), medium expressed genes (MEGs), and low expressed genes (LEGs) are indicated in dark red, orange, pink, and white color, respectively. VHEGs, HEGs, MEGs, and LEGs possess the transcript levels of ≥300, 30–300, 10–30, and 1–10 TPM, respectively. The total EG number of each tissue was indicated on the top of the columns in grey color. The transcript profiles of nine selected tissues were extracted from Table S1; (B) Two-dimension scatter plot of transcript abundance in pollen vs. the max of other eight tissues under NT conditions. The x-axis indicates the max of transcript abundances in the other eight tissues (except pollen and anthers), and the y-axis indicates the transcript abundance detected in pollen, with each point representing a unique gene model. Blue points and orange points represent the pollen-specific genes (PSGs) and pollen-nonspecific genes, respectively. Pollen-abundant genes (PAGs) are located above the redline (y = log2 300); (C) The distribution of transcriptional levels grouped by abundances in the 13 selected anthers of H05 under NT conditions. Very highly expressed genes (VHEGs), highly expressed genes (HEGs), medium expressed genes (MEGs), and low expressed genes (LEGs) are indicated in dark red, orange, pink, and white color, respectively. VHEGs, HEGs, MEGs, and LEGs possess the transcript levels of ≥300, 30–300, 10–30, and 1–10 TPM, respectively. The total EG number of each tissue was indicated on the top of the columns in grey color. The transcript profiles of 13 anthers were extracted from Table S1; (D) Two-dimension scatter plot of transcript abundance in the average of anthers vs. the max of other eight tissues under NT conditions. The x-axis indicates the max of transcript abundances in the other eight tissues (except pollen and anthers), and the y-axis indicates the average of transcript abundance in the 13 anthers, with each point representing a unique gene model. Blue points and orange points represent the anther-specific genes (ASGs) and anther-nonspecific genes, respectively. Pollen-abundant genes (AAGs) are located above the redline (y = log2 300).
Figure 3
Figure 3
The expression pattern of 16 anther-specific genes (ASGs) in H05 tissues. (A) The expression pattern of 16 ASGs were verified by RNA-seq; (B) The expression pattern of 16 ASGs was verified by RT-PCR. The GhUBIQUITIN7 gene was used as a reference gene; In (A,B), the row names represent the gene ID of 16 ASGs, and the column names represent 21 tissues of H05.
Figure 4
Figure 4
Genome editing of Ghir_D12G012350 causes indehiscent anther in cotton. (A) Genome editing in the mutant of Ghir_D12G012350 is exhibited. The sgRNA target sites and the PAM (protospacer adjacent motif) regions are shown in blue and orange, respectively. TM-1—the reference genome. Jin668—the wild type (WT); (B) The WT and mutant plants are shown. Scale bars = 20 cm. (C) The flowers of WT and mutant plants are shown, with petals removed. The red arrows represent the indehiscent anthers. Scale bars = 1 cm.
Figure 5
Figure 5
Venny plot analysis of APSGs, TSSGs, TDSSGs, and ADSSGs. (A) Identification of anther- and pollen-specific genes (APSGs) by using 1111 pollen-specific genes (PSGs) and 1066 anther-specific genes (ASGs); (B) Identification of tetrad stage- and pollen-specific genes (TSSGs) by using 1111 pollen-specific genes (PSGs) and 862 tetrad stage-specific genes (TSSGs); (C) Identification of tapetal degradation stage- and pollen-specific genes (TDSSGs) by using 1111 pollen-specific genes (PSGs) and 950 tapetal degradation stage-specific genes (TDSSGs); (D) Identification of anther dehiscence stage- and pollen-specific genes (ADSSGs) by using 1111 pollen-specific genes (PSGs) and 1112 anther dehiscence stage-specific genes (ADSSGs); In (AD) the overlapped sets represent APSGs, TSSGs, TDSSGs and ADSSGs, respectively.
Figure 6
Figure 6
Gene ontology (GO) enrichment analysis of APSGs, PSGs, and ASGs in H05. (A) GO term enrichment analysis of APSGs; (B) GO term enrichment analysis of PSGs; (C) GO term enrichment analysis of ASGs; In (AC), the x-axis represents the gene number assigned to a GO term, and the y-axis is the list of significantly enriched GO terms. These significantly enriched GO terms were selected based on a p-value < 0.05 and a q-value < 0.2. GO terms of the categories of biological processes, cellular components, and molecular functions are shown in red, green, and blue, respectively.
Figure 7
Figure 7
Classification of CREs identified in the promoters of APSGS genes; the x-axis represents the 11 groups of CREs classed by function; the y-axis indicates the CRE frequency: average sites per promoter.
Figure 8
Figure 8
Volcano plot, Venny plot, and GO enrichment analysis of differentially expressed genes (DEGs). (A) Volcano plot of DEGs, the x-axis indicates the value of log2 (FoldChange) and the y-axis indicates the value of −log10 (p-value); (B) Number of up-regulated genes and down-regulated genes; (C) Venny plot of PSGs, PAGs, and DEGs; (D) GO enrichment analysis of DEGs, the x-axis represents the gene number assigned to a GO term and the y-axis is the list of significantly enriched GO terms.
Figure 9
Figure 9
The distribution of CREs in the 2-kb promoters of 10 shared genes in PSGs and DEGs. The distribution of CREs was drawn by software TBtools, and 8 CREs were shown (not including the TATA box and CAAT box).

Similar articles

Cited by

References

    1. Lobell D., Field C.B. Global scale climate–crop yield relationships and the impacts of recent warming. Environ. Res. Lett. 2007;2:014002. doi: 10.1088/1748-9326/2/1/014002. - DOI
    1. Shen H., Zhong X., Zhao F., Wang Y., Yan B., Li Q., Chen G., Mao B., Wang J., Li Y., et al. Overexpression of receptor-like kinase ERECTA improves thermotolerance in rice and tomato. Nat. Biotechnol. 2015;33:996–1003. doi: 10.1038/nbt.3321. - DOI - PubMed
    1. Seneviratne S.I., Rogelj J., Seferian R., Wartenburger R., Allen M.R., Cain M., Millar R.J., Ebi K.L., Ellis N., Hoegh-Guldberg O., et al. The many possible climates from the Paris Agreement’s aim of 1.5 degrees C warming. Nature. 2018;558:41–49. doi: 10.1038/s41586-018-0181-4. - DOI - PubMed
    1. Schauberger B., Archontoulis S., Arneth A., Balkovic J., Ciais P., Deryng D., Elliott J., Folberth C., Khabarov N., Müller C., et al. Consistent negative response of US crops to high temperatures in observations and crop models. Nat. Commun. 2017;8:13931. doi: 10.1038/ncomms13931. - DOI - PMC - PubMed
    1. Zhao C., Liu B., Piao S., Wang X., Lobell D.B., Huang Y., Huang M.T., Yao Y.T., Bassu S., Ciais P., et al. Temperature increase reduces global yields of major crops in four independent estimates. Proc. Natl. Acad. Sci. USA. 2017;114:9326–9331. doi: 10.1073/pnas.1701762114. - DOI - PMC - PubMed