

Identification of Novel Circulating miRNAs in Patients with Acute Ischemic Stroke
- PMID: 35328807
- PMCID: PMC8955546
- DOI: 10.3390/ijms23063387
Identification of Novel Circulating miRNAs in Patients with Acute Ischemic Stroke
Abstract
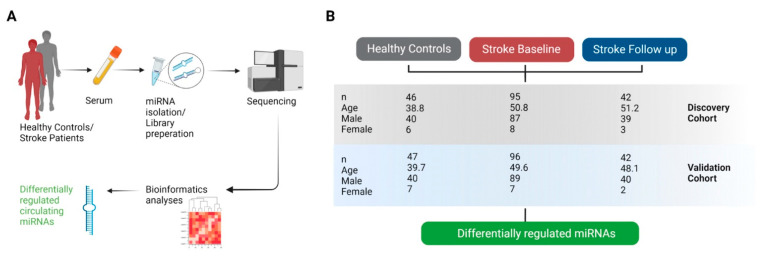
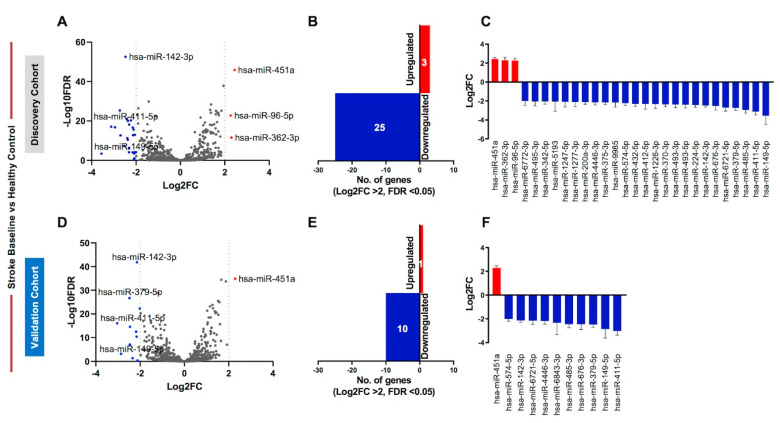
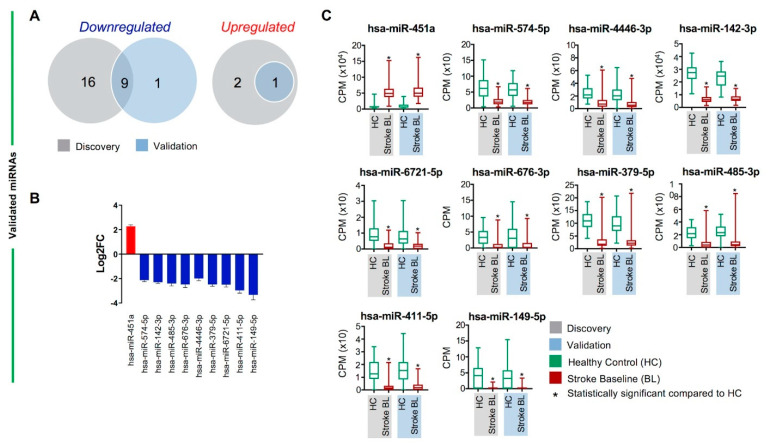
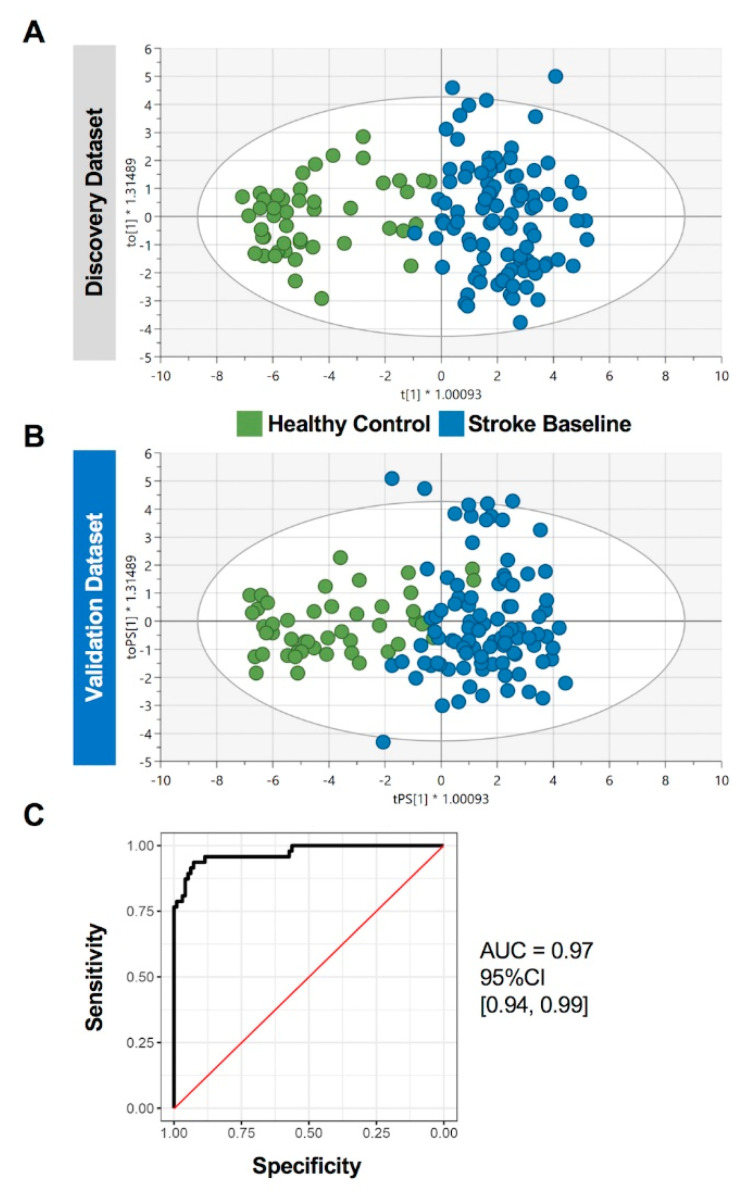
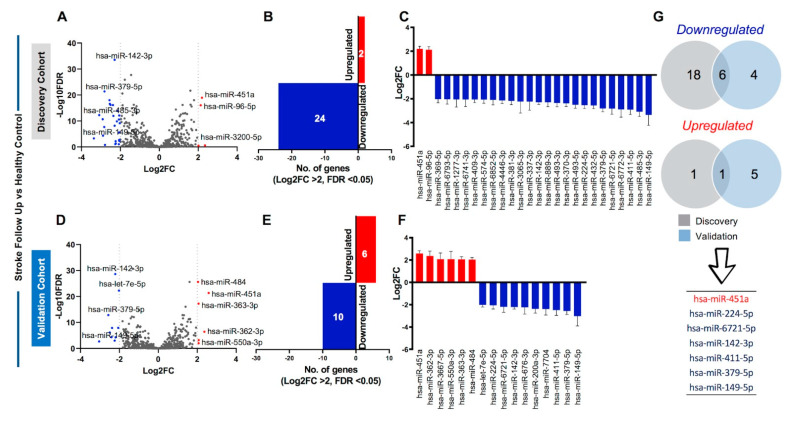
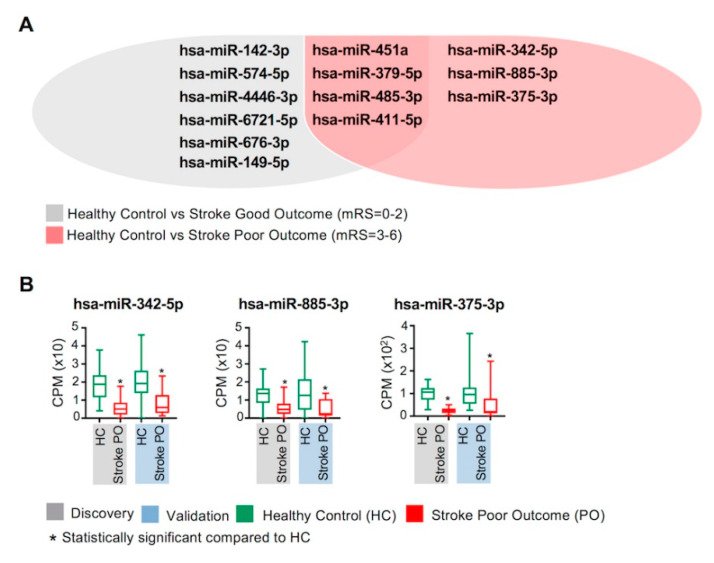
Ischemic strokes are associated with significant morbidity and mortality, but currently there are no reliable prognostic or diagnostic blood biomarkers. MicroRNAs (miRNAs) regulate various molecular pathways and may be used as biomarkers. Using RNA-Seq, we conducted comprehensive circulating miRNA profiling in patients with ischemic stroke compared with healthy controls. Samples were collected within 24 h of clinical diagnosis. Stringent analysis criteria of discovery (46 cases and 95 controls) and validation (47 cases and 96 controls) cohorts led to the identification of 10 differentially regulated miRNAs, including 5 novel miRNAs, with potential diagnostic significance. Hsa-miR-451a was the most significantly upregulated miRNA (FC; 4.8, FDR; 3.78 × 10-85), while downregulated miRNAs included hsa-miR-574-5p and hsa-miR-142-3p, among others. Importantly, we computed a multivariate classifier based on the identified miRNA panel to differentiate between ischemic stroke patients and healthy controls, which showed remarkably high sensitivity (0.94) and specificity (0.99). The area under the ROC curve was 0.97 and it is superior to other current available biomarkers. Moreover, in samples collected one month following stroke, we found sustained upregulation of hsa-miR-451a and downregulation of another 5 miRNAs. Lastly, we report 3 miRNAs that were significantly associated with poor clinical outcomes of stroke, as defined by the modified Rankin scores. The clinical translation of the identified miRNA panel may be explored further.
Keywords: biomarkers; ischemic stroke; miRNA; microRNA.
Conflict of interest statement
The authors declare no conflict of interest.
Figures
Similar articles
-
Circulating MicroRNA Profiling Identifies Distinct MicroRNA Signatures in Acute Ischemic Stroke and Transient Ischemic Attack Patients.Int J Mol Sci. 2022 Dec 21;24(1):108. doi: 10.3390/ijms24010108. Int J Mol Sci. 2022. PMID: 36613546 Free PMC article. Clinical Trial.
-
Differentially expressed miRNA profiles of serum derived extracellular vesicles from patients with acute ischemic stroke.Brain Res. 2024 Dec 15;1845:149171. doi: 10.1016/j.brainres.2024.149171. Epub 2024 Aug 19. Brain Res. 2024. PMID: 39168264
-
Identification of non-invasive biomarkers for chronic atrophic gastritis from serum exosomal microRNAs.BMC Cancer. 2019 Feb 8;19(1):129. doi: 10.1186/s12885-019-5328-7. BMC Cancer. 2019. PMID: 30736753 Free PMC article.
-
Identification of differentially expressed circulating serum microRNA for the diagnosis and prognosis of Indian non-small cell lung cancer patients.Curr Probl Cancer. 2020 Aug;44(4):100540. doi: 10.1016/j.currproblcancer.2020.100540. Epub 2020 Jan 23. Curr Probl Cancer. 2020. PMID: 32007320 Review.
-
A Systematic Review of MicroRNA Expression as Biomarker of Late-Onset Alzheimer's Disease.Mol Neurobiol. 2019 Dec;56(12):8376-8391. doi: 10.1007/s12035-019-01676-9. Epub 2019 Jun 25. Mol Neurobiol. 2019. PMID: 31240600
Cited by
-
A case-control comparison of acute-phase peripheral blood gene expression in participants diagnosed with minor ischaemic stroke or stroke mimics.Hum Genomics. 2023 Nov 25;17(1):106. doi: 10.1186/s40246-023-00551-y. Hum Genomics. 2023. PMID: 38007520 Free PMC article.
-
MiR- 142 - 3p Up-regulation Mitigates Cerebral Ischemia-reperfusion Injury by Targeting PICALM.J Mol Neurosci. 2025 Apr 24;75(2):52. doi: 10.1007/s12031-025-02351-6. J Mol Neurosci. 2025. PMID: 40272654
-
MiRNAs as potential therapeutic targets and biomarkers for non-traumatic intracerebral hemorrhage.Biomark Res. 2024 Feb 2;12(1):17. doi: 10.1186/s40364-024-00568-y. Biomark Res. 2024. PMID: 38308370 Free PMC article. Review.
-
Profiling the expression and functional roles of mRNAs and lncRNAs associated with post-stroke aphasia.Front Mol Neurosci. 2025 Apr 9;18:1513218. doi: 10.3389/fnmol.2025.1513218. eCollection 2025. Front Mol Neurosci. 2025. PMID: 40270596 Free PMC article.
-
Efficacy of Rosuvastatin Combined with rt-PA Intravenous Thrombolytic Therapy for Elderly Acute Ischemic Stroke Patients.Comput Math Methods Med. 2022 Jun 15;2022:9403693. doi: 10.1155/2022/9403693. eCollection 2022. Comput Math Methods Med. 2022. Retraction in: Comput Math Methods Med. 2023 Jun 28;2023:9807609. doi: 10.1155/2023/9807609. PMID: 35756414 Free PMC article. Retracted.
References
-
- Adams H.P., Jr., Bendixen B.H., Kappelle L.J., Biller J., Love B.B., Gordon D.L., Marsh E.E., 3rd Classification of subtype of acute ischemic stroke. Definitions for use in a multicenter clinical trial. TOAST. Trial of Org 10172 in Acute Stroke Treatment. Stroke. 1993;24:35–41. doi: 10.1161/01.STR.24.1.35. - DOI - PubMed
MeSH terms
Substances
Grants and funding
LinkOut - more resources
Full Text Sources
Medical
