

Proteomic Analysis Reveals Enzymes for β-D-Glucan Formation and Degradation in Levilactobacillus brevis TMW 1.2112
- PMID: 35328813
- PMCID: PMC8951740
- DOI: 10.3390/ijms23063393
Proteomic Analysis Reveals Enzymes for β-D-Glucan Formation and Degradation in Levilactobacillus brevis TMW 1.2112
Abstract
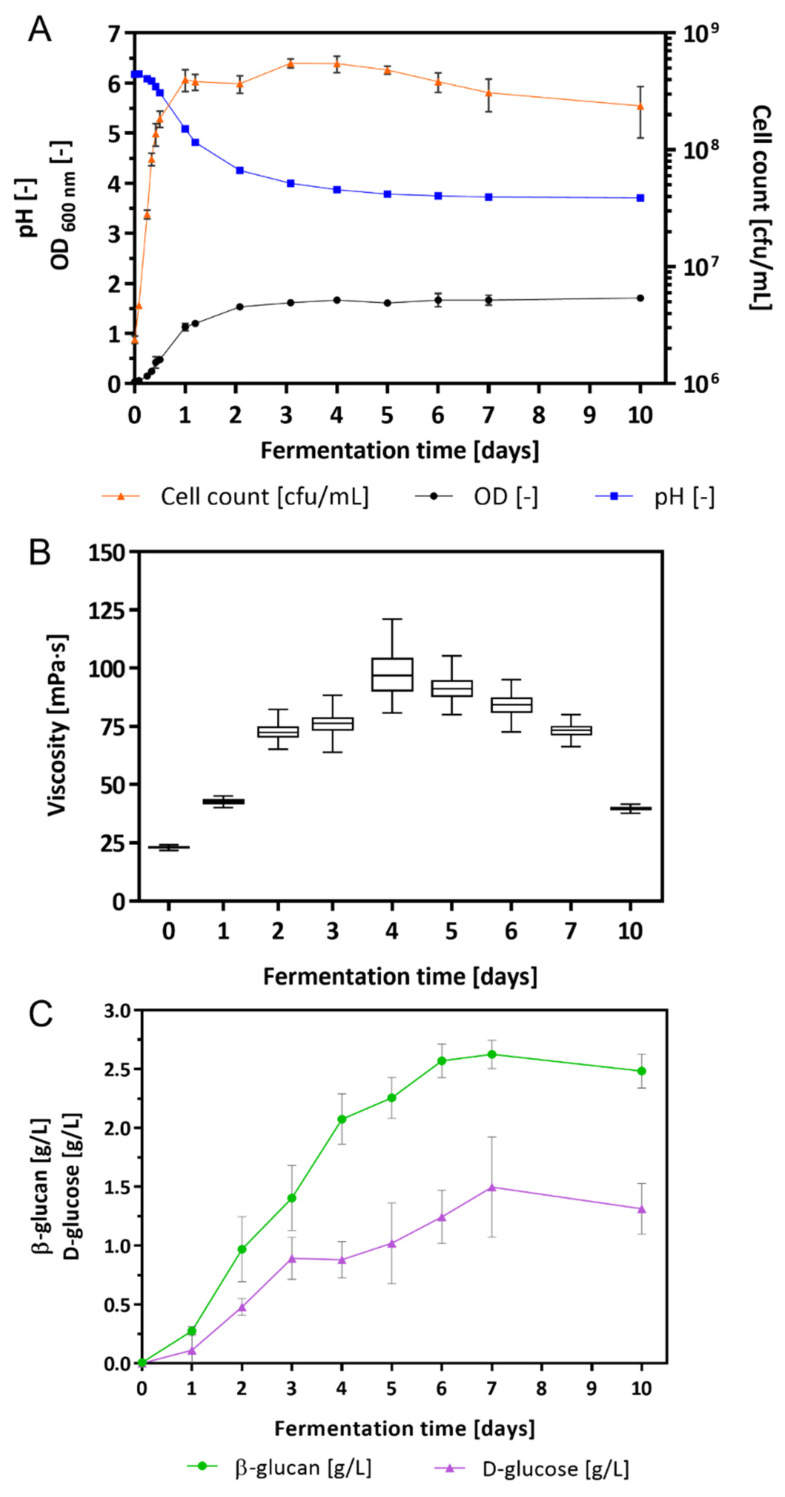
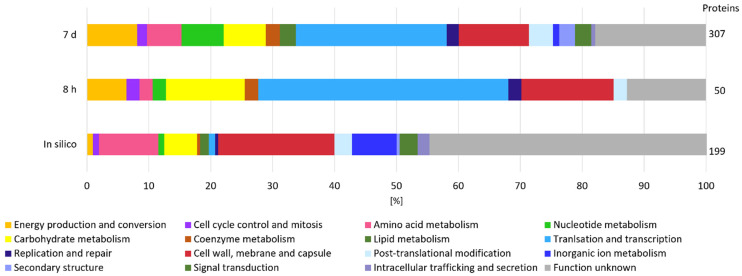
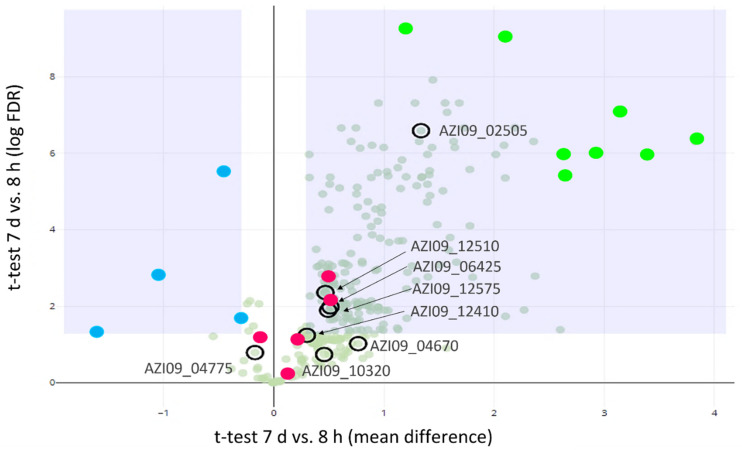
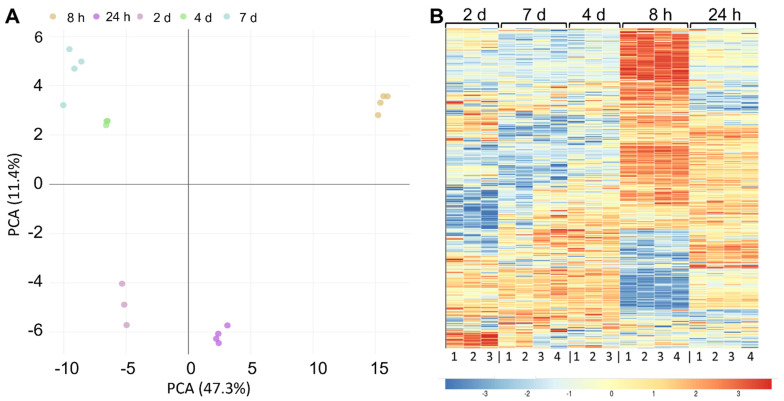
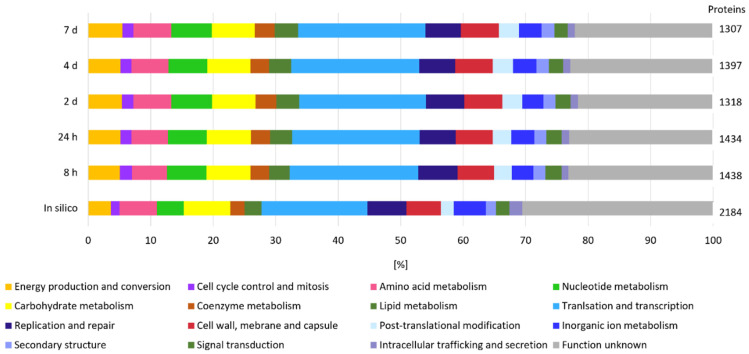
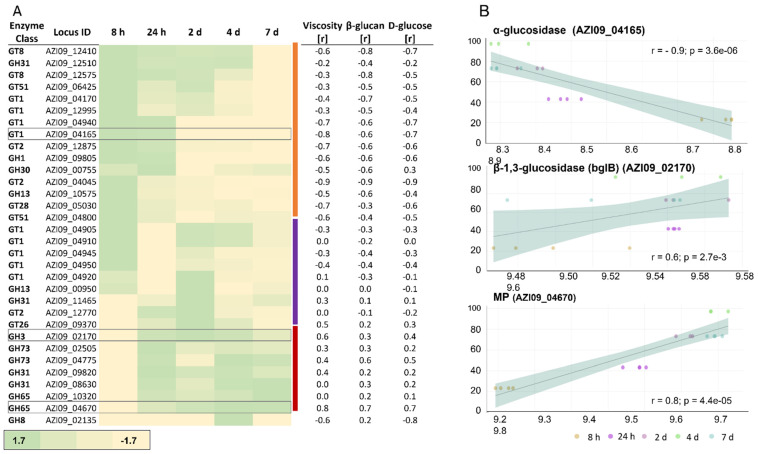
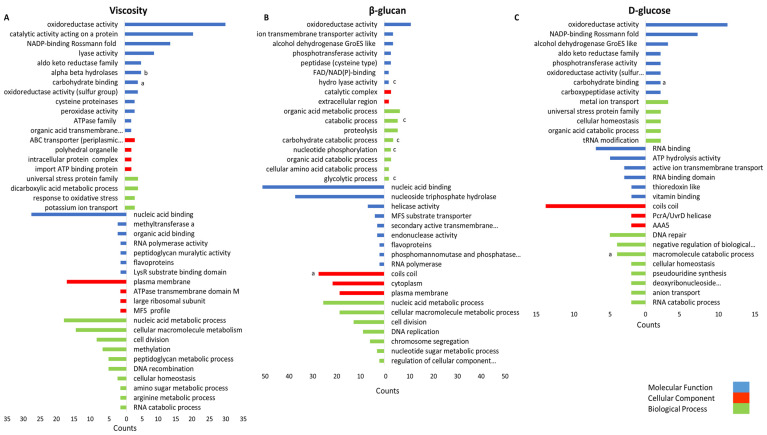
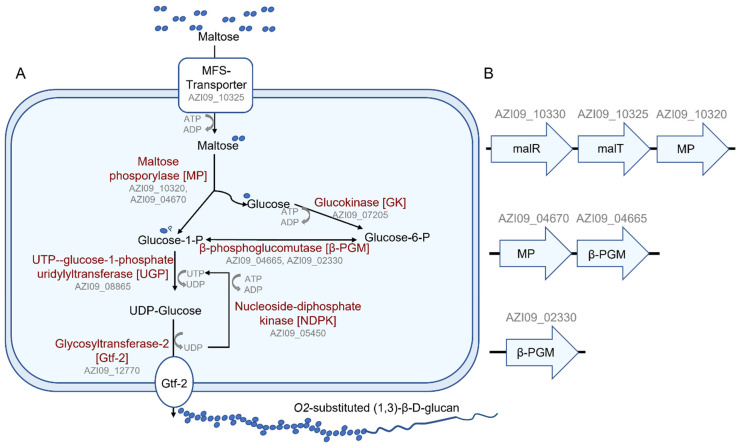
Bacterial exopolysaccharide (EPS) formation is crucial for biofilm formation, for protection against environmental factors, or as storage compounds. EPSs produced by lactic acid bacteria (LAB) are appropriate for applications in food fermentation or the pharmaceutical industry, yet the dynamics of formation and degradation thereof are poorly described. This study focuses on carbohydrate active enzymes, including glycosyl transferases (GT) and glycoside hydrolases (GH), and their roles in the formation and potential degradation of O2-substituted (1,3)-β-D-glucan of Levilactobacillus (L.) brevis TMW 1.2112. The fermentation broth of L. brevis TMW 1.2112 was analyzed for changes in viscosity, β-glucan, and D-glucose concentrations during the exponential, stationary, and early death phases. While the viscosity reached its maximum during the stationary phase and subsequently decreased, the β-glucan concentration only increased to a plateau. Results were correlated with secretome and proteome data to identify involved enzymes and pathways. The suggested pathway for β-glucan biosynthesis involved a β-1,3 glucan synthase (GT2) and enzymes from maltose phosphorylase (MP) operons. The decreased viscosity appeared to be associated with cell lysis as the β-glucan concentration did not decrease, most likely due to missing extracellular carbohydrate active enzymes. In addition, an operon was discovered containing known moonlighting genes, all of which were detected in both proteome and secretome samples.
Keywords: Levilactobacillus brevis TMW 1.2112; exopolysaccharide; glycosyl hydrolase; glycosyltransferase; moonlighting proteins; proteome; secretome; β-glucan.
Conflict of interest statement
The authors declare that there is no conflict of interest.
Figures
Similar articles
-
Characterisation of recombinant GH 3 β-glucosidase from β-glucan producing Levilactobacillus brevis TMW 1.2112.Antonie Van Leeuwenhoek. 2022 Aug;115(8):955-968. doi: 10.1007/s10482-022-01751-7. Epub 2022 Jun 4. Antonie Van Leeuwenhoek. 2022. PMID: 35661053 Free PMC article.
-
Persistence and β-glucan formation of beer-spoiling lactic acid bacteria in wheat and rye sourdoughs.Food Microbiol. 2020 Oct;91:103539. doi: 10.1016/j.fm.2020.103539. Epub 2020 May 1. Food Microbiol. 2020. PMID: 32539972
-
Influence of Different Sugars and Initial pH on β-Glucan Formation by Lactobacillus brevis TMW 1.2112.Curr Microbiol. 2018 Jul;75(7):794-802. doi: 10.1007/s00284-018-1450-z. Epub 2018 Feb 13. Curr Microbiol. 2018. PMID: 29442149
-
Enzymes that catalyze cyclization of β-1,2-glucans.Appl Microbiol Biotechnol. 2025 Feb 20;109(1):49. doi: 10.1007/s00253-025-13429-x. Appl Microbiol Biotechnol. 2025. PMID: 39976643 Free PMC article. Review.
-
β-Glucan phosphorylases in carbohydrate synthesis.Appl Microbiol Biotechnol. 2021 May;105(10):4073-4087. doi: 10.1007/s00253-021-11320-z. Epub 2021 May 10. Appl Microbiol Biotechnol. 2021. PMID: 33970317 Free PMC article. Review.
Cited by
-
Genomic Plasticity of Acid-Tolerant Phenotypic Evolution in Acetobacter pasteurianus.Appl Biochem Biotechnol. 2023 Oct;195(10):6003-6019. doi: 10.1007/s12010-023-04353-9. Epub 2023 Feb 4. Appl Biochem Biotechnol. 2023. PMID: 36738389
-
Dietary Supplementation of Crossbred Pigs with Glycerol, Vitamin C, and Niacinamide Alters the Composition of Gut Flora and Gut Flora-Derived Metabolites.Animals (Basel). 2024 Jul 28;14(15):2198. doi: 10.3390/ani14152198. Animals (Basel). 2024. PMID: 39123724 Free PMC article.
-
Characterisation of recombinant GH 3 β-glucosidase from β-glucan producing Levilactobacillus brevis TMW 1.2112.Antonie Van Leeuwenhoek. 2022 Aug;115(8):955-968. doi: 10.1007/s10482-022-01751-7. Epub 2022 Jun 4. Antonie Van Leeuwenhoek. 2022. PMID: 35661053 Free PMC article.
-
Fungal β-Glucans Enhance Lactic Acid Bacteria Growth by Shortening Their Lag Phase and Increasing Growth Rate.Microorganisms. 2025 Jun 5;13(6):1313. doi: 10.3390/microorganisms13061313. Microorganisms. 2025. PMID: 40572201 Free PMC article.
References
-
- De Vuyst L., De Vin F., Vaningelgem F., Degeest B. Recent developments in the biosynthesis and applications of heteropolysaccharides from lactic acid bacteria. Int. Dairy J. 2001;11:687–707. doi: 10.1016/S0958-6946(01)00114-5. - DOI
MeSH terms
Substances
Grants and funding
LinkOut - more resources
Full Text Sources
Miscellaneous
