. 2022 Mar 21;23(6):3411.
doi: 10.3390/ijms23063411.

Nucleobase-Derived Nitrones: Synthesis and Antioxidant and Neuroprotective Activities in an In Vitro Model of Ischemia-Reperfusion

Affiliations

Nucleobase-Derived Nitrones: Synthesis and Antioxidant and Neuroprotective Activities in an In Vitro Model of Ischemia-Reperfusion

Beatriz Chamorro et al. Int J Mol Sci. .

Abstract

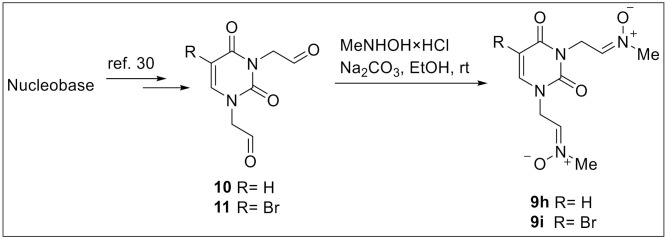
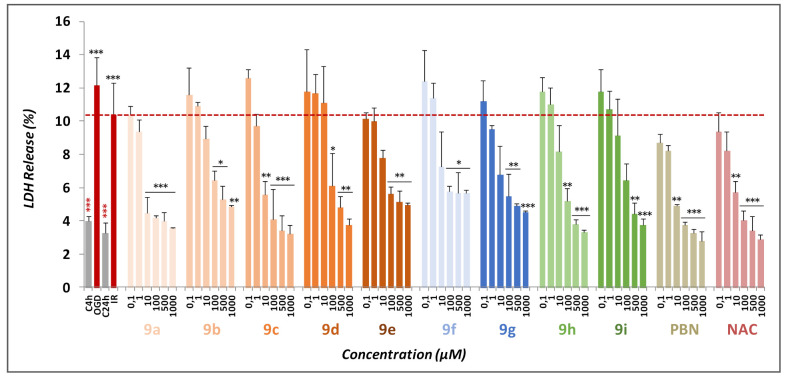
Herein, we report the synthesis, antioxidant, and neuroprotective properties of some nucleobase-derived nitrones named 9a-i. The neuroprotective properties of nitrones, 9a-i, were measured against an oxygen-glucose-deprivation in vitro ischemia model using human neuroblastoma SH-SY5Y cells. Our results indicate that nitrones, 9a-i, have better neuroprotective and antioxidant properties than α-phenyl-N-tert-butylnitrone (PBN) and are similar to N-acetyl-L-cysteine (NAC), a well-known antioxidant and neuroprotective agent. The nitrones with the highest neuroprotective capacity were those containing purine nucleobases (nitrones 9f, g, B = adenine, theophylline), followed by nitrones with pyrimidine nucleobases with H or F substituents at the C5 position (nitrones 9a, c). All of these possess EC50 values in the range of 1-6 μM and maximal activities higher than 100%. However, the introduction of a methyl substituent (nitrone 9b, B = thymine) or hard halogen substituents such as Br and Cl (nitrones 9d, e, B = 5-Br and 5-Cl uracil, respectively) worsens the neuroprotective activity of the nitrone with uracil as the nucleobase (9a). The effects on overall metabolic cell capacity were confirmed by results on the high anti-necrotic (EC50's ≈ 2-4 μM) and antioxidant (EC50's ≈ 0.4-3.5 μM) activities of these compounds on superoxide radical production. In general, all tested nitrones were excellent inhibitors of superoxide radical production in cultured neuroblastoma cells, as well as potent hydroxyl radical scavengers that inhibit in vitro lipid peroxidation, particularly, 9c, f, g, presenting the highest lipoxygenase inhibitory activity among the tested nitrones. Finally, the introduction of two nitrone groups at 9a and 9d (bis-nitronas 9g, i) did not show better neuroprotective effects than their precursor mono-nitrones. These results led us to propose nitrones containing purine (9f, g) and pyrimidine (9a, c) nucleobases as potential therapeutic agents for the treatment of cerebral ischemia and/or neurodegenerative diseases, leading us to further investigate their effects using in vivo models of these pathologies.

Keywords: antioxidants; apoptosis; brain ischemia; necrosis; neuroprotection; nucleobase-derived nitrones; oxidative stress.


Conflict of interest statement

The authors declare no conflict of interest.

Figures

Figure 1
Figure 1
Structures of nitrones 18.
Figure 2
Figure 2
Structures of the nucleobase derived nitrones 9ai investigated in this work.
Scheme 1
Scheme 1
Synthesis of mono-nitrones 9ag.
Scheme 2
Scheme 2
Synthesis of bis-nitrones 9h, i.
Figure 3
Figure 3
Neuroprotective effect of nitrones 9ai, α-phenyl-N-tert-butylnitrone (PBN), and N-acetyl-L-cysteine (NAC) on SH-SY5Y human neuroblastoma metabolic activity after OGD treatment (4 h) followed by OGR (24 h) (IR). Bars show percent cell viability at the indicated concentrations of nitrones 9ai, PBN, and NAC. Values represent the mean ± SEM of three experiments, each one performed in triplicate. The statistics compare the differences with IR condition alone (red dotted line) at * p < 0.05, ** p < 0.01, and *** p < 0.001 (one-way ANOVA, followed by Holm−Sidak analysis as a test post hoc).
Figure 4
Figure 4
Neuroprotective effects of nitrones 9a9i, PBN, and NAC against metabolic cell damage induced by IR treatment in SHSY5Y human neuroblastoma cells. (A,B) Concentration-response curves indicating the percent of neuroprotection of different nitrones, 9ae (A), and nitrones 9fi, PBN, and NAC (B) at the specified concentrations. The curve fittings and calculations of EC50′s and Maximal Activities were performed as described [21]. The data are in terms of the mean ± SEM of the four experiments, each one performed in triplicate. (C) EC50 and Maximal Activity data for the indicated compounds. Statistical comparisons of all data were carried out against PBN and nitrone 9a at * p < 0.05, ** p < 0.01, and y *** p < 0.001 (ANOVA one way); ns—not significant.
Figure 5
Figure 5
Antinecrotic effect of nitrones 9ai, PBN, and NAC in SH-SY5Y cells after OGD-OGR (IR). Bars represent cell percent LDH release after OGDR (IR) in cells treated in the absence or presence of indicated compounds and concentrations. Values represent the mean ± SEM of three experiments, carried out in triplicate, and compare the effect of OGD and IR versus their respective controls (red ***) or the effect of the different compounds after IR (24 h) with IR (24 h) alone (red dotted line) in the absence of these compounds (black ***). Statistical analysis was performed as indicated in Figure 3. * p < 0.05, ** p < 0.01, and *** p < 0.001.
Figure 6
Figure 6
Neuroprotective effects of nitrones 9ai, PBN, and NAC against necrotic cell death induced by IR treatment in SHSY5Y cells. (A,B) Concentration-response curves showing the percent antinecrotic effect of different compounds (nitrones 9a–e (A) and nitrones 9f–i, PBN and NAC (B)) at the specified concentrations. (C) IC50 and Maximal Activity data for the indicated compounds Data representation, curve fitting, and statistical analysis of the data was performed as shown in Figure 4. Statistical differences were performed vs. PBN, or nitrone 9a at * p < 0.05, ** p < 0.01 y *** p < 0.001 (ANOVA one way); ns—not significant.
Figure 7
Figure 7
Anti-apoptotic effects of nitrones 9a9i, PBN, and NAC against IR treatment in SHSY5Y cells. Bars show caspase 3 activity (ΔAFU/min/μg protein) after OGDR (IR) treatment, in the absence or presence of 9ai, PBN, and NAC, at the specified concentrations. Data presentation, curve fitting, and statistical analysis of the data was performed as indicated in Figure 5. UAF = arbitrary fluorescent units. * p < 0.05, ** p < 0.01, and *** p < 0.001.
Figure 8
Figure 8
Effect of nitrones 9a9i, PBN, and NAC on human neuroblastoma SH-SY5Y cell viability under basal conditions. Bars show percent of cell viability in the presence of the compounds at the specified concentrations. The untreated cells (C24h) were considered 100% (100 ± 9.96%). Values represent the mean ± SEM of six experiments, performed in triplicate. Statistics was performed by one-way ANOVA test. There were no significant differences with respect to control. Analysis of results above 100% is not shown.
Figure 9
Figure 9
Inhibitory effects of nitrones 9ai, PBN, and NAC on superoxide production in SHSY5Y cell cultures exposed to OGD (4 h) and 3 h OGR (IR). Bars represent the percentage of ROS formed after OGD and OGR (IR), in the absence and presence of nitrones 9ai or PBN and NAC, at the specified concentrations. Values are mean ± SEM of at least four experiments, each one performed in triplicate. Data for ROS in basal conditions were of 0.101 ± 0.022 AFU/min/100,000 cells. Data presentation, curve fitting and statistical analysis of the data was performed as shown in Figure 3. The statistics compares the effect of IR versus controls or the effect of the different compounds vs. IR alone. * p < 0.05, ** p < 0.01, and *** p < 0.001.
Figure 10
Figure 10
Antioxidant effect of nitrones 9ai, PBN and NAC after OGDR (IR) in human neuroblastoma SH-SY5Y cells. (A,B) Dose–response curves showing the percentage of antioxidant effect of different compounds at the specified concentrations. (C) EC50 values and maximal antioxidant activities for the indicated compounds. Data representation, curve fitting, and statistical analysis of the data was performed as shown in Figure 4. The statistics compare the differences between EC50 or maximal activities values for different compounds studied versus PBN or nitrone 9a. * p < 0.05, ** p < 0.01, and *** p < 0.001; ns—not significant.

Similar articles

Cited by

References

    1. Jenner P. Oxidative stress in Parkinson’s disease. Ann. Neurol. 2003;53:S26–S36. doi: 10.1002/ana.10483. - DOI - PubMed
    1. Lyras L., Cairns N.J., Jenner A., Jenner P., Halliwell B. An assessment of oxidative damage to proteins, lipids, and DNA in brain from patients with Alzheimer’s disease. J. Neurochem. 1997;68:2061–2069. doi: 10.1046/j.1471-4159.1997.68052061.x. - DOI - PubMed
    1. Sayre L.M., Smith M.A., Perry G. Chemistry and biochemistry of oxidative stress in neurodegenerative disease. Curr. Med. Chem. 2001;8:721–738. doi: 10.2174/0929867013372922. - DOI - PubMed
    1. Toshniwal P.K., Zarling E.J. Evidence for increased lipid peroxidation in multiple sclerosis. Neurochem. Res. 1992;17:205–207. doi: 10.1007/BF00966801. - DOI - PubMed
    1. Dhalla N.S., Temsah R.M., Netticadan T. Role of oxidative stress in cardiovascular diseases. J. Hypertens. 2000;18:655–673. doi: 10.1097/00004872-200018060-00002. - DOI - PubMed