

Nicotine Exposure in the U.S. Population: Total Urinary Nicotine Biomarkers in NHANES 2015-2016
- PMID: 35329347
- PMCID: PMC8955498
- DOI: 10.3390/ijerph19063660
Nicotine Exposure in the U.S. Population: Total Urinary Nicotine Biomarkers in NHANES 2015-2016
Abstract
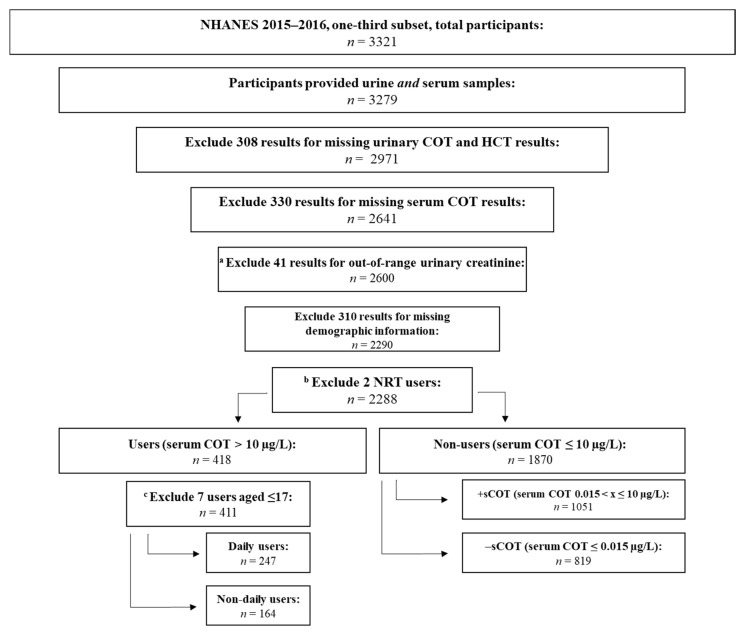
We characterize nicotine exposure in the U.S. population by measuring urinary nicotine and its major (cotinine, trans-3′-hydroxycotinine) and minor (nicotine 1′-oxide, cotinine N-oxide, and 1-(3-pyridyl)-1-butanol-4-carboxylic acid, nornicotine) metabolites in participants from the 2015−2016 National Health and Nutrition Examination Survey. This is one of the first U.S. population-based urinary nicotine biomarker reports using the derived total nicotine equivalents (i.e., TNEs) to characterize exposure. Serum cotinine data is used to stratify tobacco non-users with no detectable serum cotinine (−sCOT), non-users with detectable serum cotinine (+sCOT), and individuals who use tobacco (users). The molar concentration sum of cotinine and trans-3′-hydroxycotinine was calculated to derive the TNE2 for non-users. Additionally, for users, the molar concentration sum of nicotine and TNE2 was calculated to derive the TNE3, and the molar concentration sum of the minor metabolites and TNE3 was calculated to derive the TNE7. Sample-weighted summary statistics are reported. We also generated multiple linear regression models to analyze the association between biomarker concentrations and tobacco use status, after adjusting for select demographic factors. We found TNE7 is positively correlated with TNE3 and TNE2 (r = 0.99 and 0.98, respectively), and TNE3 is positively correlated with TNE2 (r = 0.98). The mean TNE2 concentration was elevated for the +sCOT compared with the −sCOT group (0.0143 [0.0120, 0.0172] µmol/g creatinine and 0.00188 [0.00172, 0.00205] µmol/g creatinine, respectively), and highest among users (33.5 [29.6, 37.9] µmol/g creatinine). Non-daily tobacco use was associated with 50% lower TNE7 concentrations (p < 0.0001) compared with daily use. In this report, we show tobacco use frequency and passive exposure to nicotine are important sources of nicotine exposure. Furthermore, this report provides more information on non-users than a serum biomarker report, which underscores the value of urinary nicotine biomarkers in extending the range of trace-level exposures that can be characterized.
Keywords: NHANES; exposure; nicotine biomarkers; nicotine metabolites; non-user; tobacco user; total nicotine equivalents (TNE); urine.
Conflict of interest statement
The authors declare no conflict of interest.
Figures

Similar articles
-
Simultaneous Measurement and Distribution Analysis of Urinary Nicotine, Cotinine, Trans-3'-Hydroxycotinine, Nornicotine, Anabasine, and Total Nicotine Equivalents in a Large Korean Population.Molecules. 2023 Nov 21;28(23):7685. doi: 10.3390/molecules28237685. Molecules. 2023. PMID: 38067415 Free PMC article.
-
Urinary Nicotine Metabolites and Self-Reported Tobacco Use Among Adults in the Population Assessment of Tobacco and Health (PATH) Study, 2013-2014.Nicotine Tob Res. 2022 Mar 26;24(5):768-777. doi: 10.1093/ntr/ntab206. Nicotine Tob Res. 2022. PMID: 35348786 Free PMC article.
-
Urinary Cotinine and Cotinine + Trans-3'-Hydroxycotinine (TNE-2) Cut-points for Distinguishing Tobacco Use from Nonuse in the United States: PATH Study (2013-2014).Cancer Epidemiol Biomarkers Prev. 2021 Jun;30(6):1175-1184. doi: 10.1158/1055-9965.EPI-20-0997. Epub 2021 Apr 7. Cancer Epidemiol Biomarkers Prev. 2021. PMID: 33827982 Free PMC article.
-
Nicotine and Toxicant Exposure among U.S. Smokeless Tobacco Users: Results from 1999 to 2012 National Health and Nutrition Examination Survey Data.Cancer Epidemiol Biomarkers Prev. 2015 Dec;24(12):1829-37. doi: 10.1158/1055-9965.EPI-15-0376. Cancer Epidemiol Biomarkers Prev. 2015. PMID: 26582044 Free PMC article.
-
Biomarkers of Exposure to Tobacco-Related Toxicants and Oxidative Stress among Cancer Survivors.Nicotine Tob Res. 2025 May 7:ntaf099. doi: 10.1093/ntr/ntaf099. Online ahead of print. Nicotine Tob Res. 2025. PMID: 40331779
Cited by
-
Environmental and dietary factors associated with urinary OH-PAHs in mid-pregnancy in a large multi-site study.Environ Res. 2025 Feb 1;266:120516. doi: 10.1016/j.envres.2024.120516. Epub 2024 Dec 2. Environ Res. 2025. PMID: 39631646
-
Distinguishing Exposure to Secondhand and Thirdhand Tobacco Smoke among U.S. Children Using Machine Learning: NHANES 2013-2016.Environ Sci Technol. 2023 Feb 7;57(5):2042-2053. doi: 10.1021/acs.est.2c08121. Epub 2023 Jan 27. Environ Sci Technol. 2023. PMID: 36705578 Free PMC article.
References
-
- US Department of Health and Human Services . The Health Consequences of Smoking—50 Years of Progress: A Report of the Surgeon General. Centers for Disease Control and Prevention; Atlanta, GA, USA: 2014. Reports of the Surgeon General; pp. 40–41. - PubMed
-
- Smoking is Down, but Almost 38 Million American Adults Still Smoke. [(accessed on 18 January 2018)]; Available online: https://www.cdc.gov/media/releases/2018/p0118-smoking-rates-declining.html.
-
- National Center for Chronic Disease Prevention and Health Promotion, Office on Smoking and Health . E-Cigarette Use Among Youth and Young Adults: A Report of the Surgeon General. Centers for Disease Control and Prevention (US); Atlanta, GA, USA: 2016. Publications and Reports of the Surgeon General. - PubMed
MeSH terms
Substances
LinkOut - more resources
Full Text Sources
