

Softened Microstructure and Properties of 12 μm Thick Rolled Copper Foil
- PMID: 35329714
- PMCID: PMC8955122
- DOI: 10.3390/ma15062249
Softened Microstructure and Properties of 12 μm Thick Rolled Copper Foil
Abstract
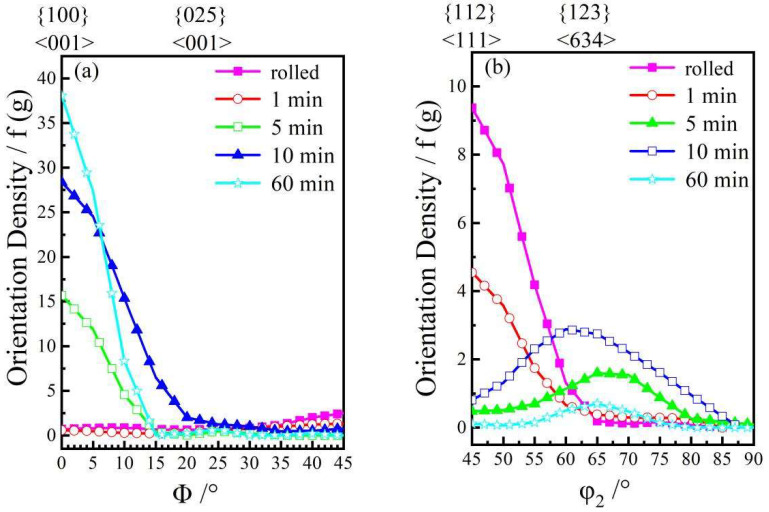
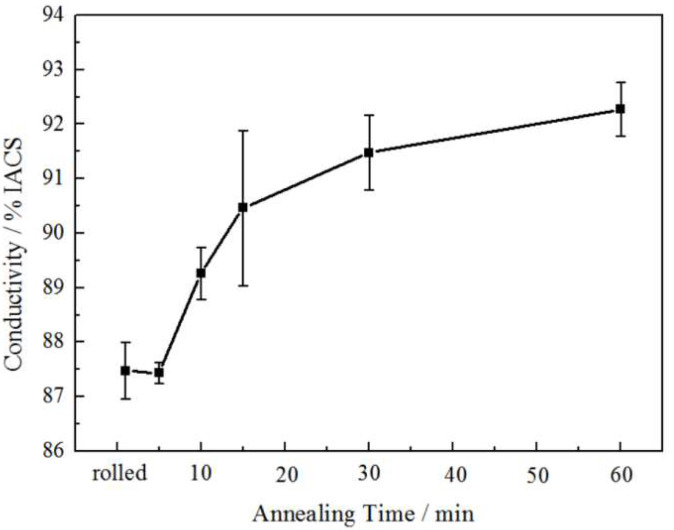
Up to now, 12 μm thick rolled copper foil is the thinnest rolled copper foil that can be stably produced. The softened microstructure and properties of 12 μm thick rolled copper foil were systematically studied in this paper. The softened process consists of thermal treatment at 180 °C for different times. The results show that the softened annealing texture is mainly cubic texture, and the cubic texture fraction increases with the increase in annealing time. The cubic texture fraction reaches the highest (34.4%) after annealing for 60 min. After annealing for 1-5 min, the tensile strength and the bending times decrease significantly. After annealing for 10-60 min, the tensile strength tends to be stable, and the bending times increase slightly. With the increase in annealing time, the electrical conductivity increases gradually, reaching 92% International Annealed Copper Standard (IACS) after annealing for 60 min. Electrical conductivity can be used as a fast and effective method to analyze the microstructure of metals.
Keywords: electrical properties; microstructure; properties; rolled copper foil; texture.
Conflict of interest statement
The authors declare no conflict of interest.
Figures


Similar articles
-
High-temperature annealing behavior of cold-rolled electrolytic tough-pitch copper.Heliyon. 2024 Jun 21;10(12):e33276. doi: 10.1016/j.heliyon.2024.e33276. eCollection 2024 Jun 30. Heliyon. 2024. PMID: 39027440 Free PMC article.
-
Microstructure and Texture Evolution in Cold-Rolled and Annealed Oxygen-Free Copper Sheets.Materials (Basel). 2024 May 8;17(10):2202. doi: 10.3390/ma17102202. Materials (Basel). 2024. PMID: 38793268 Free PMC article.
-
Effects of Deep Cryogenic Treatment on the Microstructure and Properties of Rolled Cu Foil.Materials (Basel). 2021 Sep 23;14(19):5498. doi: 10.3390/ma14195498. Materials (Basel). 2021. PMID: 34639896 Free PMC article.
-
Investigation of Electrically-Assisted Rolling Process of Corrugated Surface Microstructure with T2 Copper Foil.Materials (Basel). 2019 Dec 11;12(24):4144. doi: 10.3390/ma12244144. Materials (Basel). 2019. PMID: 31835646 Free PMC article.
-
Texture evolution in grain-oriented electrical steel during hot band annealing and cold rolling.J Microsc. 2008 Jun;230(Pt 3):414-23. doi: 10.1111/j.1365-2818.2008.02001.x. J Microsc. 2008. PMID: 18503668 Review.
References
-
- Wang W., Liu X., Xie J. Double-coating and porous treatments and evaluation of rolled copper foil surface. Surf. Coat. Technol. 2014;254:284–290. doi: 10.1016/j.surfcoat.2014.06.034. - DOI
-
- Li J.K., Ren X.P., Zhang Y.L., Hou H.L., Yan Q. Microstructural response of copper foil to a novel double-cross rolling process. J. Mater. Res. Technol. 2020;9:15153–15163. doi: 10.1016/j.jmrt.2020.11.003. - DOI
-
- Hatano T., Kurosawa Y., Miyake J. Effect of material processing on fatigue of FPC rolled copper foil. J. Electron. Mater. 2000;29:611–616. doi: 10.1007/s11664-000-0054-z. - DOI
-
- Sharma K.P., Mahyavanshi R.D., Kalita G., Tanemura M. Influence of copper foil polycrystalline structure on graphene anisotropic etching. Appl. Surf. Sci. 2017;393:428–433. doi: 10.1016/j.apsusc.2016.10.018. - DOI
Grants and funding
LinkOut - more resources
Full Text Sources
