. 2022 Mar 10;12(3):404.
doi: 10.3390/life12030404.

Possible Ribose Synthesis in Carbonaceous Planetesimals

Affiliations

Possible Ribose Synthesis in Carbonaceous Planetesimals

Klaus Paschek et al. Life (Basel). .

Abstract

The origin of life might be sparked by the polymerization of the first RNA molecules in Darwinian ponds during wet-dry cycles. The key life-building block ribose was found in carbonaceous chondrites. Its exogenous delivery onto the Hadean Earth could be a crucial step toward the emergence of the RNA world. Here, we investigate the formation of ribose through a simplified version of the formose reaction inside carbonaceous chondrite parent bodies. Following up on our previous studies regarding nucleobases with the same coupled physico-chemical model, we calculate the abundance of ribose within planetesimals of different sizes and heating histories. We perform laboratory experiments using catalysts present in carbonaceous chondrites to infer the yield of ribose among all pentoses (5Cs) forming during the formose reaction. These laboratory yields are used to tune our theoretical model that can only predict the total abundance of 5Cs. We found that the calculated abundances of ribose were similar to the ones measured in carbonaceous chondrites. We discuss the possibilities of chemical decomposition and preservation of ribose and derived constraints on time and location in planetesimals. In conclusion, the aqueous formose reaction might produce most of the ribose in carbonaceous chondrites. Together with our previous studies on nucleobases, we found that life-building blocks of the RNA world could be synthesized inside parent bodies and later delivered onto the early Earth.

Keywords: RNA world; astrobiology; astrochemistry; carbonaceous chondrites; formose reaction; gas chromatography; meteorites; origin of life; prebiotic chemistry; thermodynamics.


Conflict of interest statement

The authors declare no conflict of interest.

Figures

Figure 1
Figure 1
Temperature evolution inside a small- and early-formed model planetesimal over time. The temperature curves are given for different distances from the center inside the planetesimal. Properties of the planetesimal: Radius=4 km, porosity ϕ=0.2, and time of formation after calcium-aluminium-rich inclusions (CAI)=1 Myr. Reproduced from a simplified and adapted version of the model by Lange et al. [85]. The temperature evolution for the other available model planetesimals was described in the previous study [31].
Figure 2
Figure 2
Temperature evolution inside a large- and late-formed model planetesimal over time. The temperature curves are given for different distances from the center inside the planetesimal. Properties of the planetesimal: Radius=150 km, porosity ϕ=0.2, and time of formation after CAI=3.5 Myr. Reproduced from a simplified and adapted version of the model by Lange et al. [85]. The temperature evolution for the other available model planetesimals was described in the previous study [31].
Figure 3
Figure 3
Gibbs free energies of formation of different molecules plotted against temperature at 100 bar. The energies for glycolaldehyde were estimated values calculated (a,b) either by the technique developed by Emberson [88] and Fernandes [89], and used in Cobb et al. [52] (denoted in figure legend as “weighted”, plotted as solid lines with filled symbols), (c) or by using the computational quantum chemistry software Gaussian [91] (denoted in figure legend as “Gaussian”, plotted as solid lines with hollow symbols). Data taken from the CHNOSZ database are plotted as solid and dashed lines without symbols.
Figure 4
Figure 4
Fraction of ribose (R) in all pentoses (5Cs) synthesized over time in lab experiments. The reaction started with concentrations for formaldehyde of 1.34 mol L−1, for glycolaldehyde of 0.269 mol L−1 or 20 mol%, and for the respective catalyst of 10 mol%, in a solution volume of 1 mL, with samples taken over time in volumes of 50 μL each. The temperature of the solution was kept constant over time at the values denoted in the figure legend for each catalyst run.
Figure 5
Figure 5
Lower bound theoretical ribose abundances from simulations of formose reaction pathway in Equation (1). Properties of planetesimal: Radius=150 km, densities ρrock=3 g/cm3, ρice=0.917 g/cm3, porosity ϕ=0.2, and time of formation after CAI=3.5 Myr. The experimentally found yields of ribose within 5Cs for each catalyst (see Table 2) were multiplied with the theoretically calculated 5C abundance to obtain the ribose abundances (dashed lines with symbols). This simulation was run with the lower (opposite to Figure 6) bound of the initial concentration of glycolaldehyde of 5×10⁶mol·molH2O1 (see Table 1). All simulations were run at 100 bar. In both panels (a) and (b) the left vertical axis corresponds to the abundances (dashed lines with symbols) and the right vertical axis corresponds to the temperatures from the planetesimal model (solid and dotted lines). The shaded part of the abundance axis represents the range of ribose abundances measured in CM2 (Mighei-type, Murchison, upper limit) and CR2 (Renazzo-type, NWA 801, lower limit) meteorites [1], and has no correlation to the radial location inside the object or the point in time (horizontal axes). (a) Distribution of abundances for the maximum temperature Tmax (solid line) reached at a specific distance from the center inside the planetesimal (center at the left and surface at the right). Ribose was synthesized at and below 138 km distance from the center. (b) Evolution of abundances at temperatures Tcore (dotted line) in the center of the planetesimal over time (the same temperature evolution curve can be found in Figure 2). Ribose synthesis started at 2 Myr after formation.
Figure 6
Figure 6
Upper bound theoretical ribose abundances from simulations of formose reaction pathway in Equation (1). Properties of planetesimal: Radius=150 km, densities ρrock=3 g/cm3, ρice=0.917 g/cm3, porosity ϕ=0.2, and time of formation after CAI=3.5 Myr. The experimentally found yields of ribose within 5Cs for each catalyst (see Table 2) were multiplied with the theoretically calculated 5C abundance to obtain the ribose abundances (dashed lines with symbols). This simulation was run with the upper (opposite to Figure 5) bound of the initial concentration of glycolaldehyde of 4×10⁴mol·molH2O1 (see Table 1). All simulations were run at 100 bar. In both panels (a) and (b) the left vertical axis corresponds to the abundances (dashed lines with symbols) and the right vertical axis corresponds to the temperatures from the planetesimal model (solid and dotted lines). The shaded part of the abundance axis represents the range of ribose abundances measured in CM2 (Murchison, upper limit) and CR2 (NWA 801, lower limit) meteorites [1], and has no correlation to the radial location inside the object or the point in time (horizontal axes). (a) Distribution of abundances for the maximum temperature Tmax (solid line) reached at a specific distance from the center inside the planetesimal (center at the left and surface at the right). Ribose was synthesized at and below 138 km distance from the center. (b) Evolution of abundances at temperatures Tcore (dotted line) in the center of the planetesimal over time (the same temperature evolution curve can be found in Figure 2). Ribose synthesis started at 2 Myr after formation.
Figure 7
Figure 7
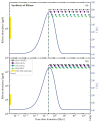
Theoretical ribose abundances in an outer shell at 2.76 km distance from the center of the 4 km-sized planetesimal model. The whole planetesimal model is shown in Figure 1. Properties of planetesimal: Radius=4 km, densities ρrock=3 g/cm3, ρice=0.917 g/cm3, porosity ϕ=0.2, and time of formation after CAI=1 Myr. The formose reaction pathway in Equation (1) was used in the simulations. The experimentally found yields of ribose within 5Cs for each catalyst (see Table 2) were multiplied with the theoretically calculated 5C abundance to obtain the ribose abundances (dashed lines with symbols). Ribose synthesis started at ∼210,000 yr after formation. All simulations were run at 100 bar. In both panels (a,b), the left vertical axis corresponds to the abundances (dashed lines with symbols) and the right vertical axis corresponds to the temperatures T (solid lines) in the outer shell of the planetesimal model. The shaded part of the abundance axis represents the range of ribose abundances measured in CM2 (Murchison, upper limit) and CR2 (NWA 801, lower limit) meteorites [1], and has no correlation to the point in time (horizontal axis). (a) Time evolution of lower bound abundances simulated using the lower (opposite to panel (b)) bound of the initial concentration of glycolaldehyde of 5×10⁶mol·molH2O1 (see Table 1). (b) Time evolution of upper bound abundances simulated using the upper (opposite to panel (a)) bound of the initial concentration of glycolaldehyde of 4×10⁴mol·molH2O1.
Figure 8
Figure 8
Theoretical ribose abundances in an outer shell at 138 km distance from the center of the 150 km-sized planetesimal model. The whole planetesimal model is shown in Figure 2. Properties of planetesimal: Radius=150 km, densities ρrock=3 g/cm3, ρice=0.917 g/cm3, porosity ϕ=0.2, and time of formation after CAI=3.5 Myr. The formose reaction pathway in Equation (1) was used in the simulations. The experimentally found yields of ribose within 5Cs for each catalyst (see Table 2) were multiplied with the theoretically calculated 5C abundance to obtain the ribose abundances (dashed lines with symbols). Ribose synthesis started at ∼2.1 Myr after formation. All simulations were run at 100 bar. In both panels (a,b), the left vertical axis corresponds to the abundances (dashed lines with symbols) and the right vertical axis corresponds to the temperatures T (solid lines) in the outer shell of the planetesimal model. The shaded part of the abundance axis represents the range of ribose abundances measured in CM2 (Murchison, upper limit) and CR2 (NWA 801, lower limit) meteorites [1], and has no correlation to the point in time (horizontal axis). (a) Time evolution of lower bound abundances simulated using the lower (opposite to panel (b)) bound of the initial concentration of glycolaldehyde of 5×10⁶mol·molH2O1 (see Table 1). (b) Time evolution of upper bound abundances simulated using the upper (opposite to panel (a)) bound of the initial concentration of glycolaldehyde of 4×10⁴mol·molH2O1.

References

    1. Furukawa Y., Chikaraishi Y., Ohkouchi N., Ogawa N.O., Glavin D.P., Dworkin J.P., Abe C., Nakamura T. Extraterrestrial ribose and other sugars in primitive meteorites. Proc. Natl. Acad. Sci. USA. 2019;116:24440–24445. doi: 10.1073/pnas.1907169116. - DOI - PMC - PubMed
    1. Chyba C.F., Thomas P.J., Brookshaw L., Sagan C. Cometary delivery of organic molecules to the early earth. Science. 1990;249:366–373. doi: 10.1126/science.11538074. - DOI - PubMed
    1. Chyba C., Sagan C. Endogenous production, exogenous delivery and impact-shock synthesis of organic molecules: An inventory for the origins of life. Nature. 1992;355:125–132. doi: 10.1038/355125a0. - DOI - PubMed
    1. Gomes R., Levison H.F., Tsiganis K., Morbidelli A. Origin of the cataclysmic Late Heavy Bombardment period of the terrestrial planets. Nature. 2005;435:466–469. doi: 10.1038/nature03676. - DOI - PubMed
    1. van Kooten E., Schiller M., Moynier F., Johansen A., Haugbølle T., Bizzarro M. Hybrid Accretion of Carbonaceous Chondrites by Radial Transport across the Jupiter Barrier. Astrophys. J. 2021;910:70. doi: 10.3847/1538-4357/abd9c8. - DOI

LinkOut - more resources