Deciphering the Association among Pathogenicity, Production and Polymorphisms of Capsule/Melanin in Clinical Isolates of Cryptococcus neoformans var. grubii VNI
- PMID: 35330247
- PMCID: PMC8950468
- DOI: 10.3390/jof8030245
Deciphering the Association among Pathogenicity, Production and Polymorphisms of Capsule/Melanin in Clinical Isolates of Cryptococcus neoformans var. grubii VNI
Abstract
Background: Cryptococcus neoformans is an opportunistic fungal pathogen that can cause meningitis in immunocompromised individuals. The objective of this work was to study the relationship between the phenotypes and genotypes of isolates of clinical origin from different cities in Colombia.
Methods: Genome classification of 29 clinical isolates of C. neoformans var. grubii was performed using multilocus sequence typing (MLST), and genomic sequencing was used to genotype protein-coding genes. Pathogenicity was assessed in a larval model, and melanin production and capsule size were evaluated in vitro and in vivo.
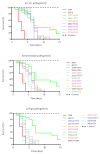
Results: Eleven MLST sequence types (STs) were found, the most frequent being ST69 (n = 9), ST2, ST93, and ST377 (each with n = 4). In the 29 isolates, different levels of pigmentation, capsule size and pathogenicity were observed. Isolates classified as highly pathogenic showed a tendency to exhibit larger increases in capsule size. In the analysis of polymorphisms, 48 non-synonymous variants located in the predicted functional domains of 39 genes were found to be associated with capsule size change, melanin, or pathogenicity.
Conclusions: No clear patterns were found in the analysis of the phenotype and genotype of Cryptococcus. However, the data suggest that the increase in capsule size is a key variable for the differentiation of pathogenic isolates, regardless of the method used for its induction.
Keywords: Cryptococcus neoformans; MLST; capsule; melanin; polymorphism.
Conflict of interest statement
The authors declare no conflict of interest.
Figures


Similar articles
-
MLST-Based Population Genetic Analysis in a Global Context Reveals Clonality amongst Cryptococcus neoformans var. grubii VNI Isolates from HIV Patients in Southeastern Brazil.PLoS Negl Trop Dis. 2017 Jan 18;11(1):e0005223. doi: 10.1371/journal.pntd.0005223. eCollection 2017 Jan. PLoS Negl Trop Dis. 2017. PMID: 28099434 Free PMC article.
-
Comparative genomics of Cryptococcus neoformans var. grubii associated with meningitis in HIV infected and uninfected patients in Vietnam.PLoS Negl Trop Dis. 2017 Jun 14;11(6):e0005628. doi: 10.1371/journal.pntd.0005628. eCollection 2017 Jun. PLoS Negl Trop Dis. 2017. PMID: 28614360 Free PMC article.
-
Molecular epidemiology of Italian clinical Cryptococcus neoformans var. grubii isolates.Med Mycol. 2013 Jul;51(5):499-506. doi: 10.3109/13693786.2012.751642. Epub 2013 Jan 4. Med Mycol. 2013. PMID: 23286351
-
Identification of novel hybrids between Cryptococcus neoformans var. grubii VNI and Cryptococcus gattii VGII.Mycopathologia. 2012 Jun;173(5-6):337-46. doi: 10.1007/s11046-011-9491-x. Epub 2011 Nov 13. Mycopathologia. 2012. PMID: 22081254
-
A unique chromosomal rearrangement in the Cryptococcus neoformans var. grubii type strain enhances key phenotypes associated with virulence.mBio. 2012 Feb 28;3(2):e00310-11. doi: 10.1128/mBio.00310-11. Print 2012. mBio. 2012. PMID: 22375073 Free PMC article.
Cited by
-
A Landscape of the Genomic Structure of Cryptococcus neoformans in Colombian Isolates.J Fungi (Basel). 2023 Jan 18;9(2):135. doi: 10.3390/jof9020135. J Fungi (Basel). 2023. PMID: 36836249 Free PMC article.
-
Unbiased discovery of natural sequence variants that influence fungal virulence.Cell Host Microbe. 2023 Nov 8;31(11):1910-1920.e5. doi: 10.1016/j.chom.2023.10.002. Epub 2023 Oct 27. Cell Host Microbe. 2023. PMID: 37898126 Free PMC article.
-
Screening for cryptococcal antigenemia and meningeal cryptococcosis, genetic characterization of Cryptococcus neoformans in asymptomatic patients with advanced HIV disease in Kinshasa, Democratic Republic of Congo.Sci Rep. 2024 Dec 2;14(1):29959. doi: 10.1038/s41598-024-80772-w. Sci Rep. 2024. PMID: 39622937 Free PMC article.
-
Riboflavin inhibits growth and reduces virulence of Cryptococcus neoformans in vitro by membrane disruption and excessive accumulation of reactive oxygen species and exhibits efficacy against pulmonary cryptococcosis and meningitis.Virulence. 2025 Dec;16(1):2543064. doi: 10.1080/21505594.2025.2543064. Epub 2025 Aug 7. Virulence. 2025. PMID: 40754661 Free PMC article.
-
Synergistic antifungal interaction of N-(butylcarbamothioyl) benzamide and amphotericin B against Cryptococcus neoformans.Front Microbiol. 2023 Mar 7;14:1040671. doi: 10.3389/fmicb.2023.1040671. eCollection 2023. Front Microbiol. 2023. PMID: 36960287 Free PMC article.
References
-
- Vázquez O., Martínez I. Criptococosis. Historia natural y estado actual del tratamiento. Acta Pediatr. Mex. 2005;26:18–28.
Grants and funding
LinkOut - more resources
Full Text Sources

