. 2022 Mar 15:14:100238.
doi: 10.1016/j.mtbio.2022.100238. eCollection 2022 Mar.

In situ injectable hydrogel-loaded drugs induce anti-tumor immune responses in melanoma immunochemotherapy

Affiliations

In situ injectable hydrogel-loaded drugs induce anti-tumor immune responses in melanoma immunochemotherapy

Jiehan Li et al. Mater Today Bio. .

Abstract

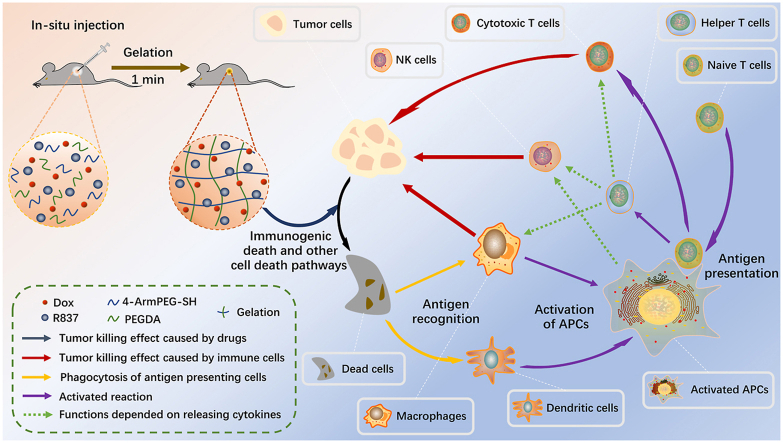
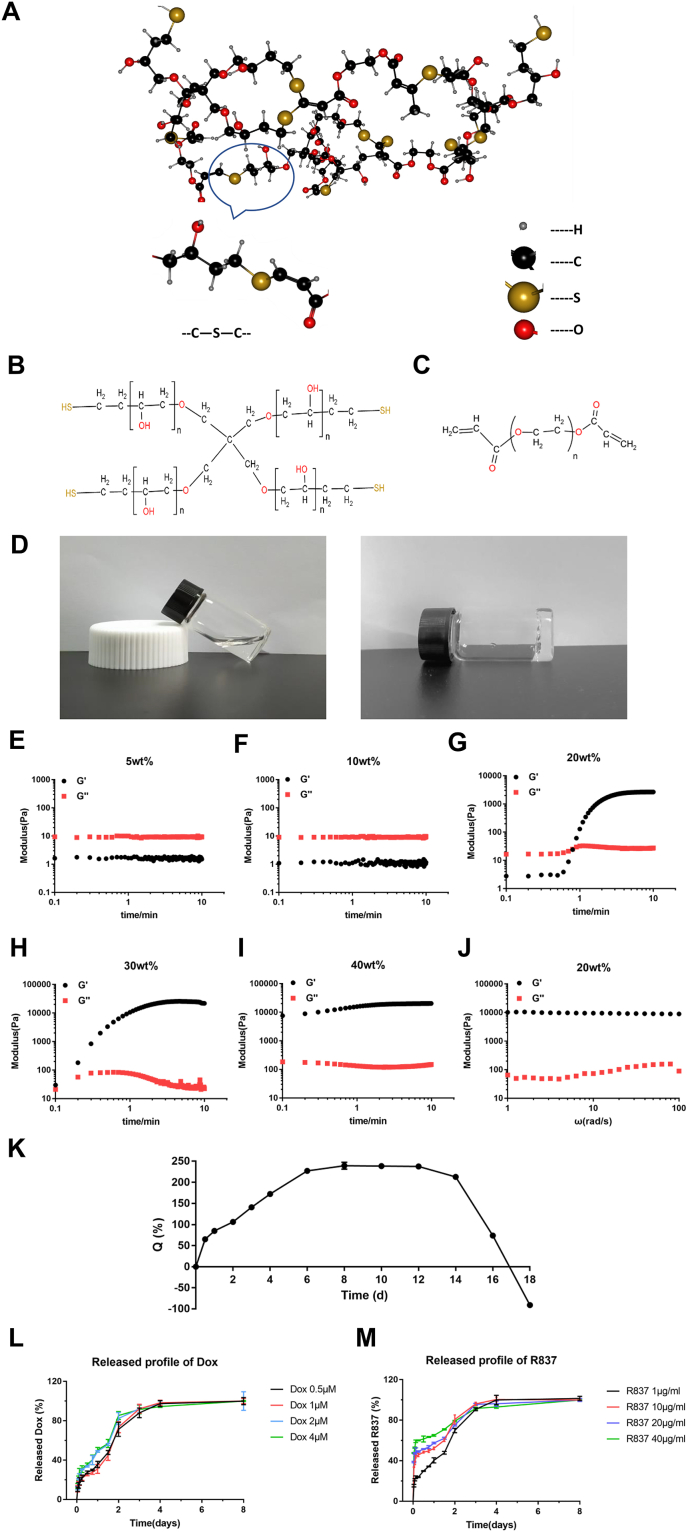
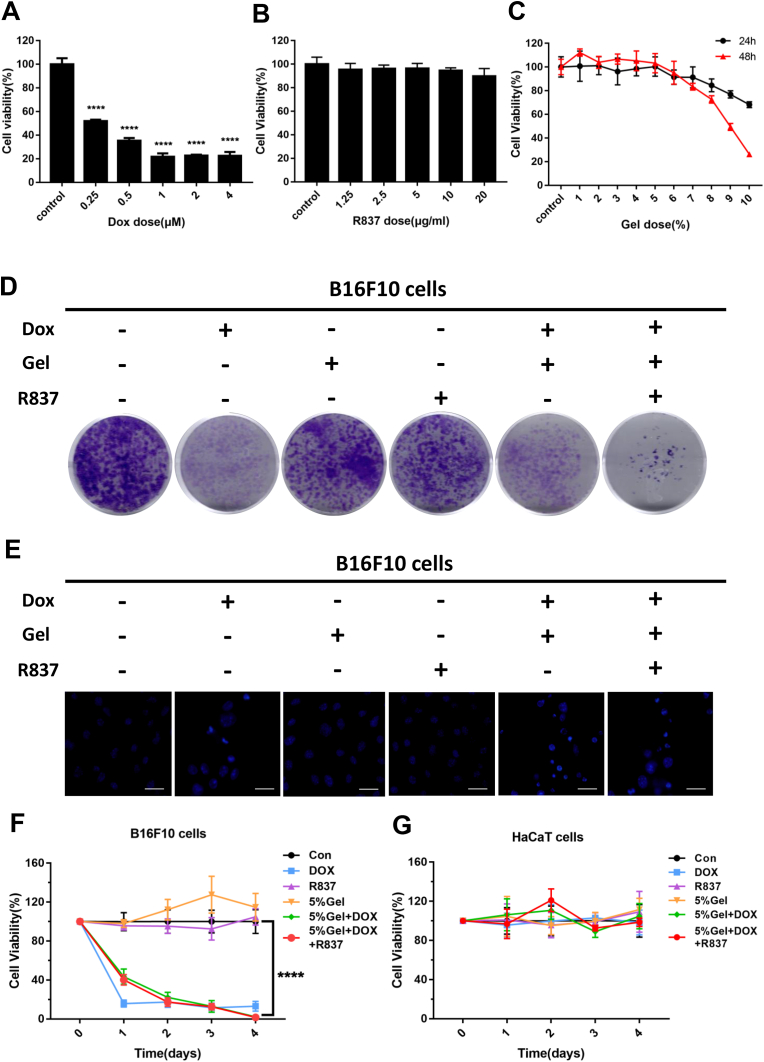
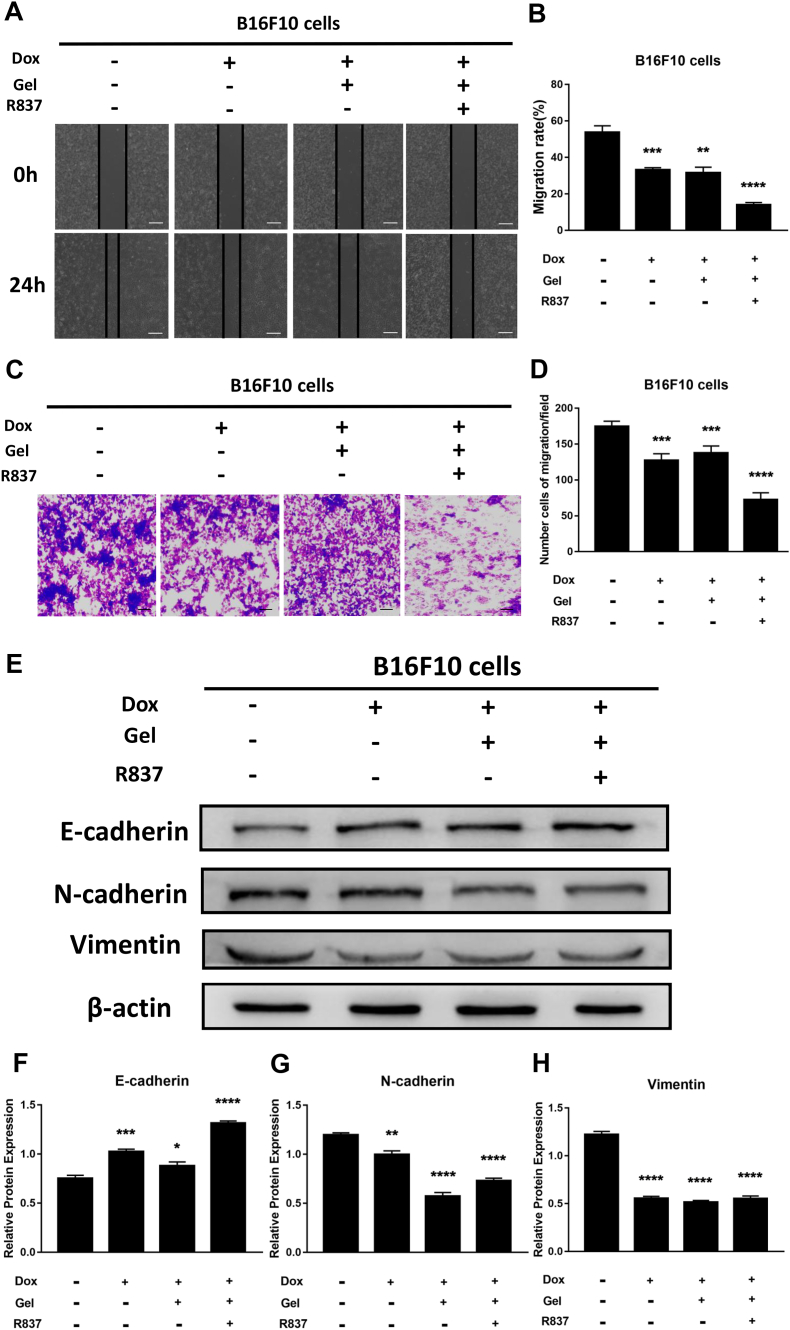
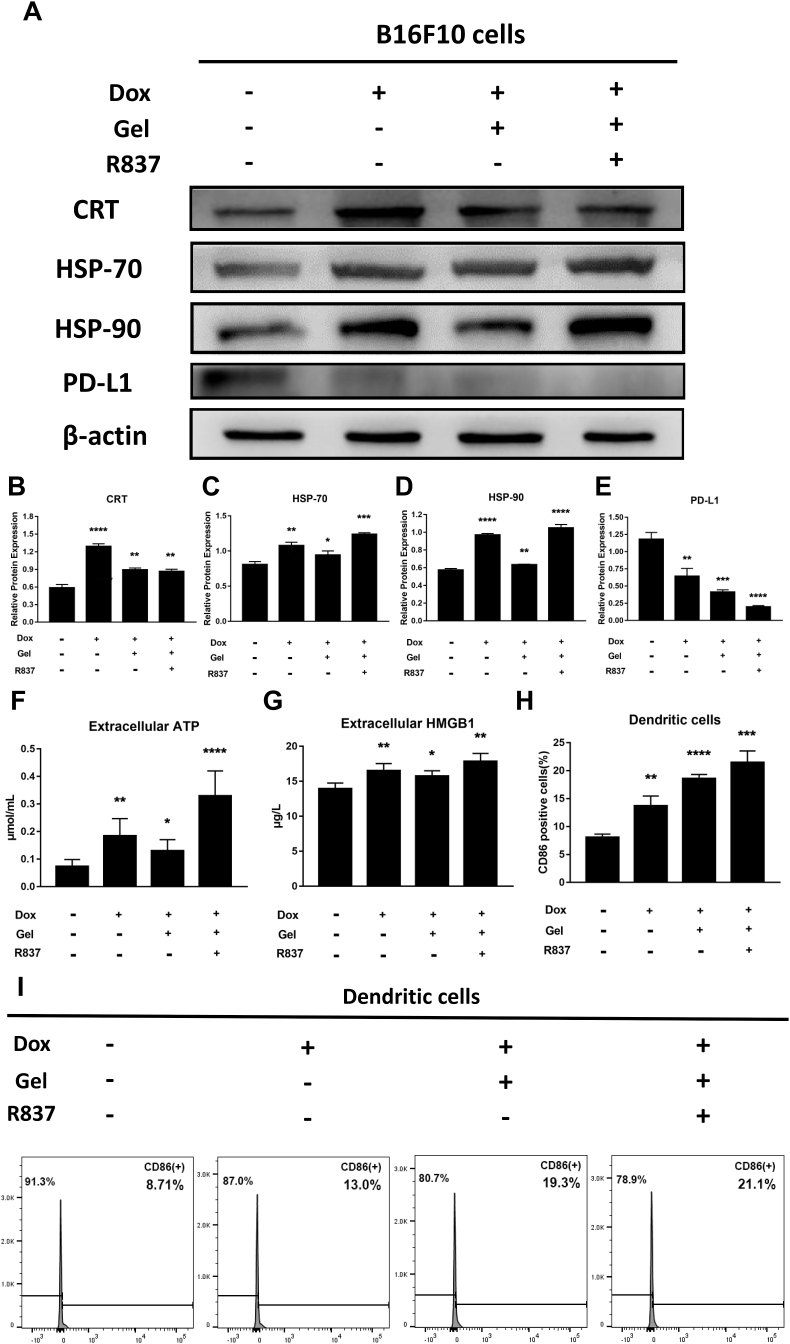
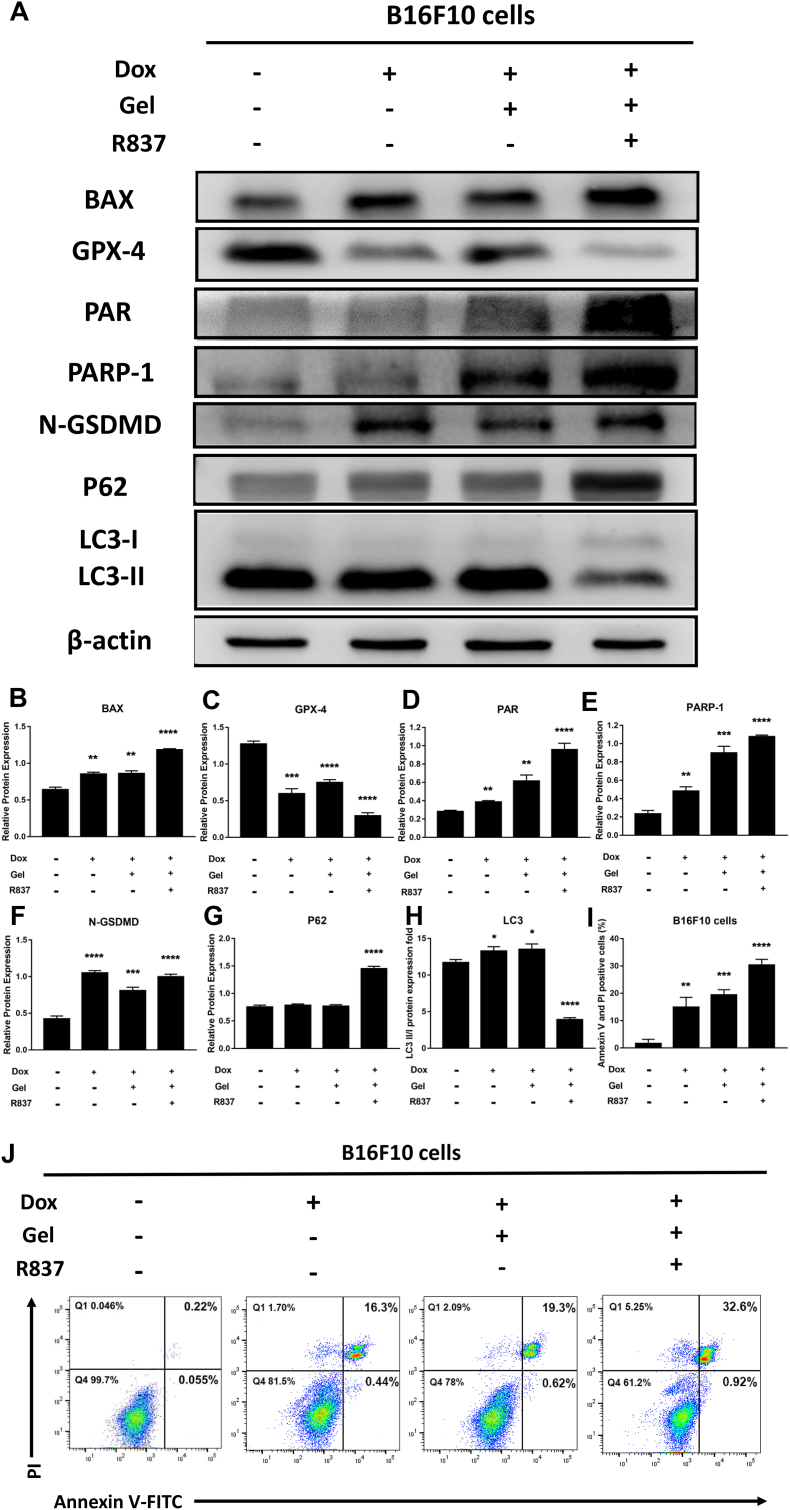
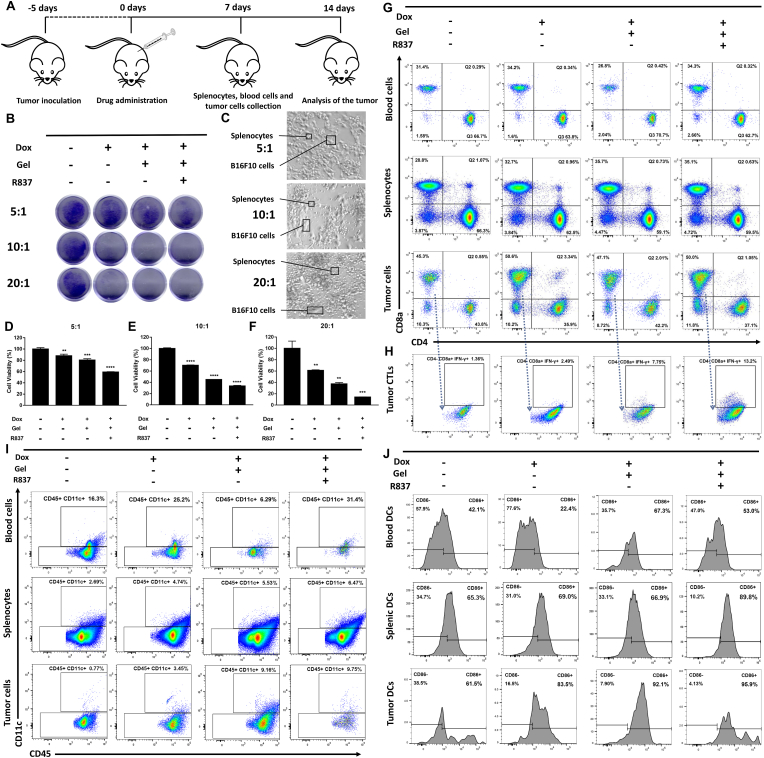
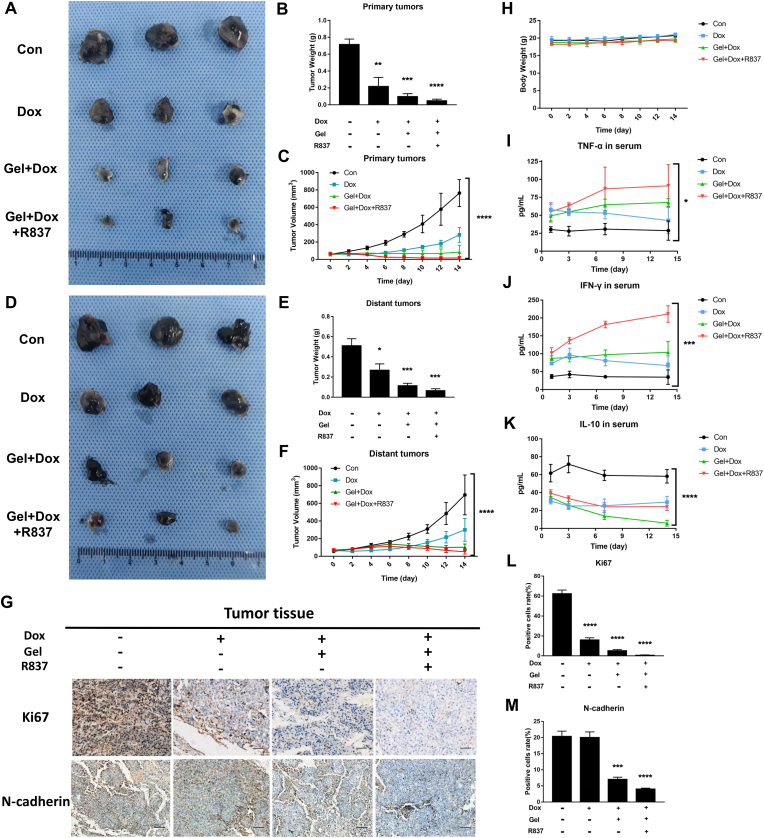
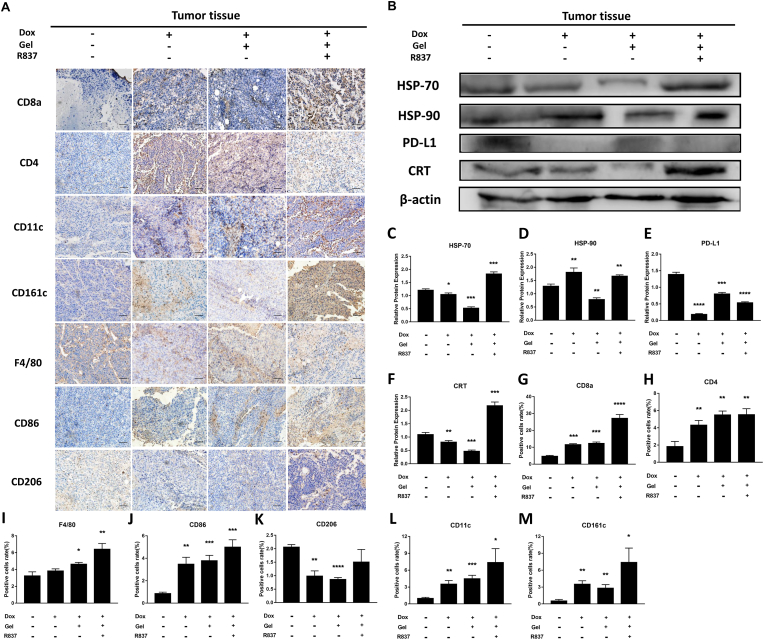
Melanoma is a highly aggressive tumor located in the skin, with limited traditional therapies. In order to reduce the side effects caused by traditional administration method and amplify the killing effect of immune system against tumor cells, an in situ injectable hydrogel drug delivery system is developed for the first time which co-delivers doxorubicin (Dox) and imiquimod (R837) for the synergistic therapy of melanoma. The mechanical properties and stability of the hydrogel are characterized and the optimal doses of hydrogel and drugs are also identified. As a result, the co-delivery system effectively suppresses melanoma growth and metastatic progression both in vitro and in vivo. Further studies show that the co-delivery system causes immunogenic cell death, activation of antigen presenting cells, comprising dendritic cells and M1 macrophages, and secretion of related cytokines consisted of tumor necrosis factor-α (TNF-α) and interferon-γ (IFN-γ), subsequently with the activation of T lymphocytes and natural killer cells in spleen and tumor area. The co-delivery system also decreases the suppressive immune responses, including infiltration of M2 macrophages and secretion of interleukin-10 (IL-10), in vivo. Besides, other death modes are induced by the co-delivery system, including apoptosis and non-apoptotic cell death. In a word, this co-delivery system induces melanoma cell death directly and activates immune system for further tumor killing simultaneously, which shows probability for precise targeted tumor therapy.

Keywords: Anti-tumor immune response; Cell death; Immunogenic cell death; Injectable hydrogel; Melanoma.


Conflict of interest statement

The authors declare that they have no conflict of interests or personal relationships that could have appeared to influence the work reported in this paper.

Figures

Image 1
Graphical abstract
Fig. 1
Fig. 1
Preparation and characterization of the hydrogel. (A) The three-dimensional network structure of the hydrogel. (B) The structure of 4-ArmPEG-SH molecule. (C) The structure of PEGDA molecule. (D) Photographs showing that after the two solutions were mixed together at room temperature, they could change from liquid to solid within a few minutes in vitro. (E-I) Rheology properties of the formation of the 5 wt% (E), 10 wt% (F), 20 wt% (G), 30 wt% (H) and 40 wt% (I) hydrogels. G′ means elastic modulus and G″ means viscous modulus. (J) Rheology properties of the toughness and stability of hydrogel. G′ means storage modulus and G″ means loss modulus. (K) Swelling ratios (Q) of hydrogels were measured at different time points of 0.5 day, 1 day, 2 days, 3 days, 4 days, 6 days, 8 days, 10 days, 12 days, 14 days, 16 days and 18 days after immersing in the PBS. (L-M) Cumulative release profiles of different doses of Dox (L) and R837 (L) from the hydrogel (5%) incubated in PBS at the time points of 1 h,2 h,3 h,6 h,12 h,18 h,24 h,36 h,48 h,3 d,4 d, 8 d. Data are presented as means ± SEM (n = 5).
Fig. 2
Fig. 2
Dox/R837/PEGDA-PEGSH suppressed melanoma cells growth and induced apoptosis. (A) Cell viability was detected by CCK-8 assay after administration of 0.25–4 μM Dox for 24 h to determine the optimal concentration of Dox. (B) Cell viability was measured by CCK-8 assay after administration of 1.25–20 μg/mL R837 for 24 h to determine the optimal concentration of R837. (C) CCK-8 assay analyzed the cytotoxicity of the different concentrations of the hydrogel (1%–10%) after treatment for 24 h and 48 h to evaluate its cytocompatibility. (D) Colony formation experiment showed Dox/R837/PEGDA-PEGSH co-delivering treatment significantly inhibited colony formation compared with other groups. (E) B16F10 cells were stained with Hoechst33258 after grouping for different treatments. Scale bar = 100 μm. (F-G) The proliferation of B16F10 cells (F) and HaCaT cells (G) was detected by CCK-8 assay after different treatments at the time points of 1 day, 2 days, 3 days and 4 days. Data are present as means ± SEM (n = 5). ∗∗∗∗P < 0.0001.
Fig. 3
Fig. 3
Dox/R837/PEGDA-PEGSH inhibited the metastatic progression in vitro. (A) Wound healing assay of B16F10 cells with different treatments for imaging at 0,24 h. Scale bar = 200 μm. (B) The migration area of the wound healing assay was calculated by Image J. (C) Transwell assay of B16F10 cells with different treatments after 24 h for evaluating the migration. Scale bar = 200 μm. (D) The number of migrated cells from the transwell assay was counted by Image J. (E) Western blotting analysis of E-cadherin, N-cadherin and Vimentin expression in B16F10 cells after different treatments for 24 h. (F–H) Relative protein expression levels of E-cadherin (F), N-cadherin (G) and Vimentin (H) in B16F10 cells after different treatments analyzed from Western blotting were shown in each bar. Data are present as means ± SEM (n ≥ 3). Statistical significance: ∗P < 0.05; ∗∗P < 0.01; ∗∗∗P < 0.001; ∗∗∗∗P < 0.0001 vs the control group.
Fig. 4
Fig. 4
Dox/R837/PEGDA-PEGSH induced tumor immunogenic cell death and activated the immune system in vitro. (A) Western blotting analysis of HSP-70, HSP-90, CRT and PD-L1 expression in B16F10 cells after the different treatment for 24 h. (B-E) Relative protein expression levels of CRT (B), HSP-70 (C), HSP-90 (D) and PD-L1 (E) in B16F10 cells after different treatments analyzed from Western blotting were shown in each bar. (F-G) Extracellular levels of ATP (F) and HMGB1 (G) after different treatments were shown in each bar. (H) CD86 positive cells rates of dendritic cells after different treatments were shown in each bar. (I) Representative flow cytometry analysis of the maturation of dendritic cells which were co-cultured with the B16F10 cells after grouped treatment. Data are present as means ± SEM (n ≥ 3). Statistical significance: ∗P < 0.05; ∗∗P < 0.01; ∗∗∗P < 0.001; ∗∗∗∗P < 0.0001 vs the control group.
Fig. 5
Fig. 5
Dox/R837/PEGDA-PEGSH not only triggered apoptosis, but also triggered non-apoptotic cell death methods. (A) Western blotting analysis of BAX, GPX-4, PAR, PARP-1, N-GSDMD, P62, and LC-3 expression in B16F10 cells after the different treatment for 24 h. (B–H) Relative protein expression levels of BAX (B), GPX-4 (C), PAR (D), PARP-1 (E), N-GSDMD (F) and P62 (G) and LC-3II/I protein expression fold (H) in B16F10 cells after different treatment analyzed from Western blotting were shown in each bar. (I) Annexin V and PI positive cells rates of B16F10 cells after the different treatment were shown in each bar. (J) Flow cytometry analysis of Annexin V-FITC/PI staining of the B16F10 cells after different treatment. Data are present as means ± SEM (n ≥ 3). Statistical significance: ∗P < 0.05; ∗∗P < 0.01; ∗∗∗P < 0.001; ∗∗∗∗P < 0.0001 vs the control group.
Fig. 6
Fig. 6
Antitumor immune response induced by Dox/R837/PEGDA-PEGSH in spleen, blood and tumors. (A) The flow chart of the animal experiment. (B) The extracted splenocytes were co-cultured with melanoma cells at the proportion of 1:5, 1:10 and 1:20. Then the crystal violet experiment showed inhibitory effects of splenocytes on the growth of melanoma cells. (C) The schematic diagram of the co-culture between splenocytes and melanoma cells in different ratios. (D-F) CCK-8 assay proved the inhibitory effect of splenocytes on the cell viability of melanoma cells at the co-culture proportion of 1:5 (D), 1:10 (E) and 1:20 (F). (G) Cell flow cytometry analysis of the percentage of CD8+ cells in blood, spleens and tumors after different treatments. (H) Cell flow cytometry analysis of the percentage of IFN-γ+ cells in tumor CTLs after different treatments. (I) Cell flow cytometry analysis of the percentage of CD11c + CD45+ cells in spleens, blood and tumors after different treatments. (J) Cell flow cytometry analysis of the percentage of CD86+ cells in splenic dendritic cells, blood dendritic cells and dendritic cells in tumors after different treatments. Data are present as means ± SEM (n ≥ 3). Statistical significance: ∗P < 0.05; ∗∗P < 0.01; ∗∗∗P < 0.001; ∗∗∗∗P < 0.0001 vs the control group.
Fig. 7
Fig. 7
Anti-tumor effects and systemic immune responses induced by the local chemoimmunotherapy in vivo. (A) Representative primary tumors at the end of the experiment in vivo. (B–C) Tumor weight (B) and tumor volume (C) at indicated time points after treatment were calculated for primary tumors. (D) Representative distant tumors at the end of the experiment in vivo. (E-F) Tumor weight (E) and tumor volume (F) at indicated time points after treatment were calculated for distant tumors. (G) IHC staining analyzed of Ki67 and N-cadherin from paraffin-embedded sections of the tumor tissues. Scale bar = 200 μm. (H) Body weights of the mice after the treatments. (I–K) TNF-α (I), IFN-γ (J) and IL-10 (K) levels in mouse serum 1, 3, 7 and 14 days after treatments. (L-M) Ki67 (L) and N-GSDMD (M) positive cells rates of the tumor tissues after different treatments were shown in each bar. Data are present as means ± SEM (n ≥ 3). Statistical significance: ∗P < 0.05; ∗∗P < 0.01; ∗∗∗P < 0.001; ∗∗∗∗P < 0.0001 vs the control group.
Fig. 8
Fig. 8
Immune cells infiltration and immunogenic cell death activation in the primary tumor sites. (A) IHC staining analyzed of CD8a (marker for CTLs), CD4 (marker for helper T cells), CD11c (marker for dendritic cells), CD161c (marker for NK cells), F4/80 (marker for macrophages), CD86 (marker for M1 macrophages) and CD206 (marker for M2 macrophages) from paraffin-embedded sections of the tumor tissues. Scale bar = 200 μm. (B) Western blotting analysis of HSP-70, HSP-90, CRT and PD-L1 expression in tumor tissues after the different treatment in vivo. (C–F) The protein levels of HSP-70 (C), HSP-90 (D), PD-L1 (E) and CRT (F) of the tumor tissues after different treatments were shown in each bar. (G-M) CD8a (G), CD4 (H), F4/80 (I), CD86 (J), CD206 (K), CD11c (L) and CD161c (M) positive cells rates of the tumor tissues after different treatments were shown in each bar. Data are present as means ± SEM (n ≥ 3). Statistical significance: ∗P < 0.05; ∗∗P < 0.01; ∗∗∗P < 0.001; ∗∗∗∗P < 0.0001 vs the control group.

Similar articles

Cited by

References

    1. Holmes D. The cancer that rises with the sun. Nature. 2014;515:S110–S111. - PubMed
    1. Davis L.E., Shalin S.C., Tackett A.J. Current state of melanoma diagnosis and treatment. Cancer Biol. Ther. 2019;20:1366–1379. - PMC - PubMed
    1. Ambrosi L., Khan S., Carvajal R.D., Yang J. Novel targets for the treatment of melanoma. Curr. Oncol. Rep. 2019;21:97. - PubMed
    1. Deng Y., Zhang Q., Li Y., Wang L., Yang S., Chen X., Gan C., He F., Ye T., Yin W. Pectolinarigenin inhibits cell viability, migration and invasion and induces apoptosis via a ROS-mitochondrial apoptotic pathway in melanoma cells. Oncol. Lett. 2020;20:116. - PMC - PubMed
    1. Wada-Ohno M., Ito T., Furue M. Adjuvant therapy for melanoma. Curr. Treat. Options Oncol. 2019;20:63. - PubMed