. 2022 Mar 7:13:833928.
doi: 10.3389/fgene.2022.833928. eCollection 2022.

A Necroptosis-Related lncRNA-Based Signature to Predict Prognosis and Probe Molecular Characteristics of Stomach Adenocarcinoma

Affiliations

A Necroptosis-Related lncRNA-Based Signature to Predict Prognosis and Probe Molecular Characteristics of Stomach Adenocarcinoma

Lianghua Luo et al. Front Genet. .

Abstract

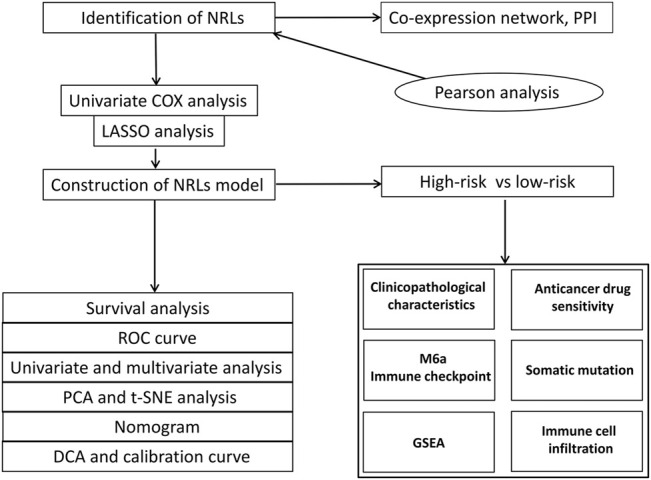
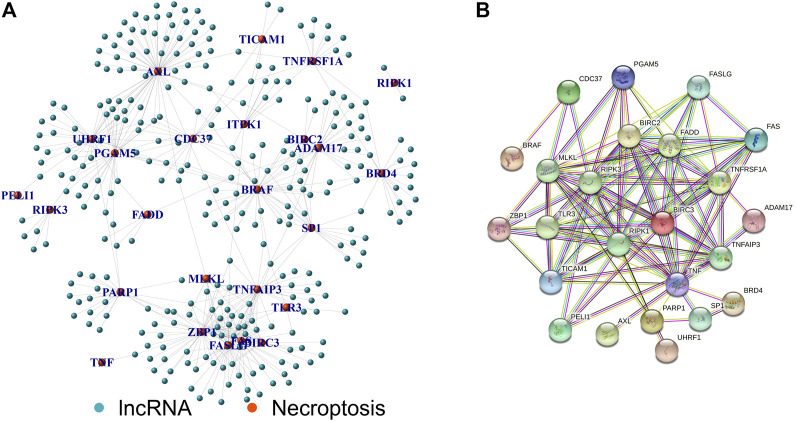
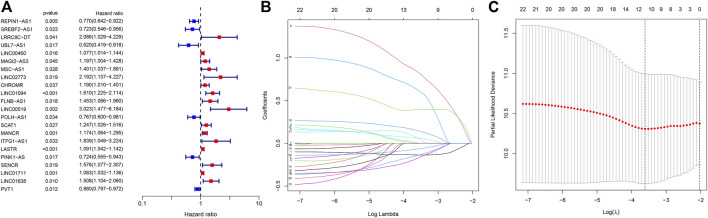
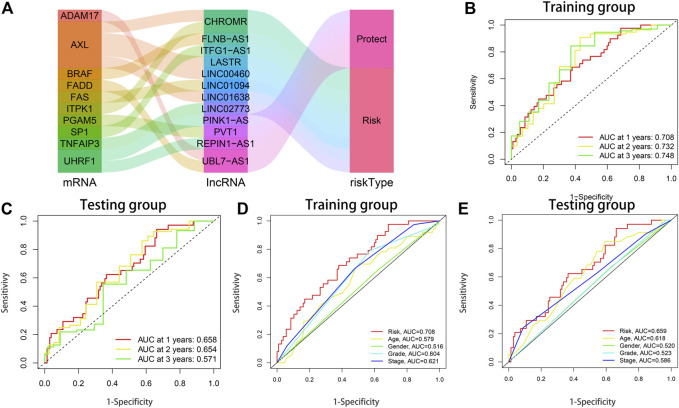
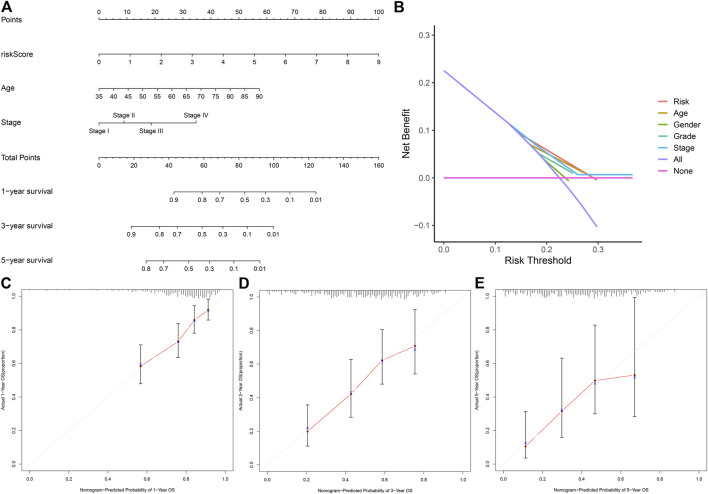
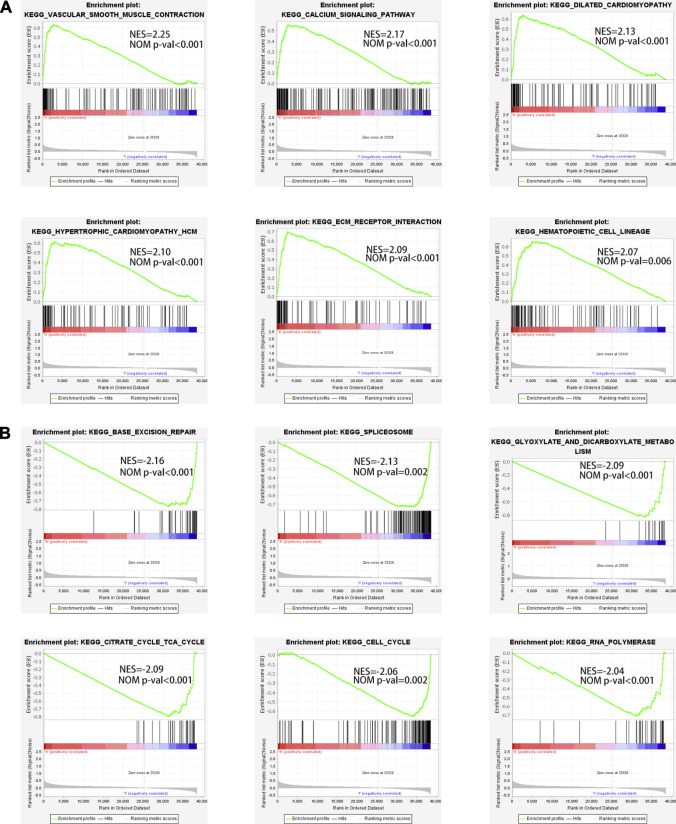
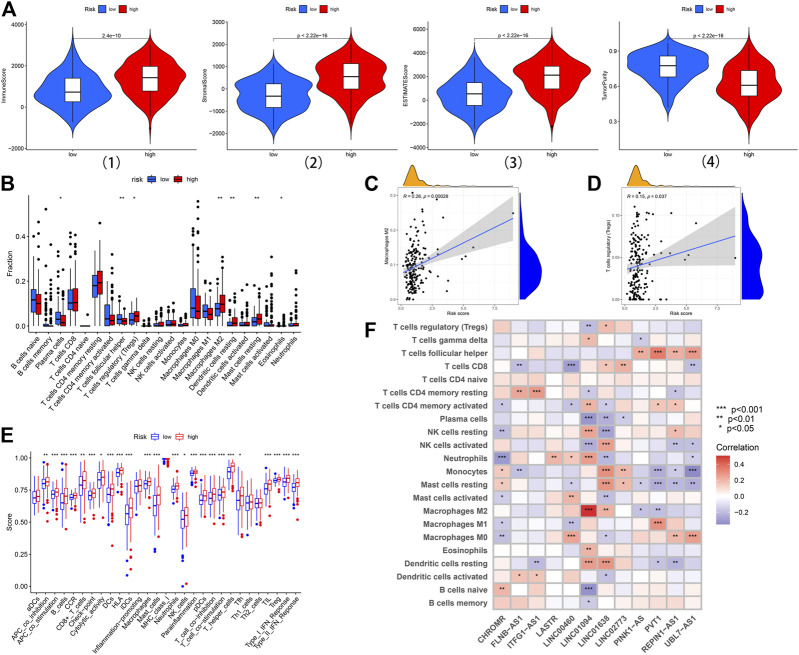
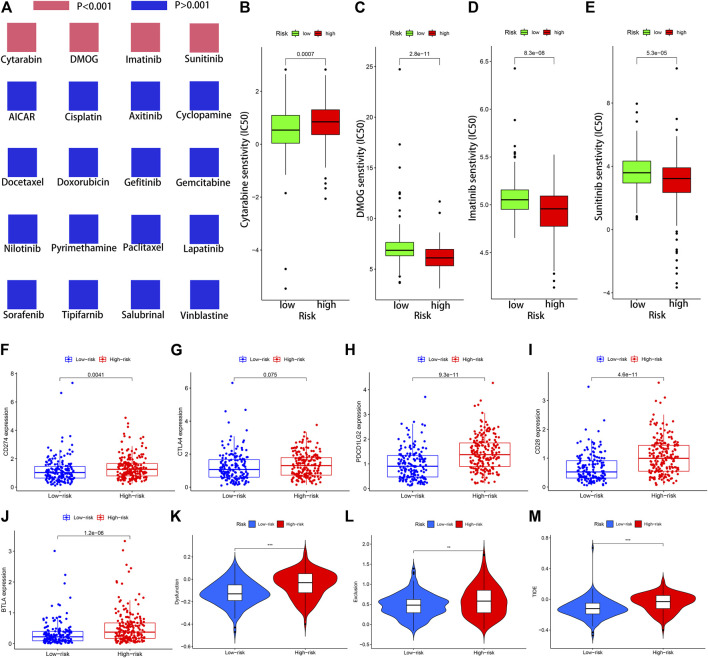
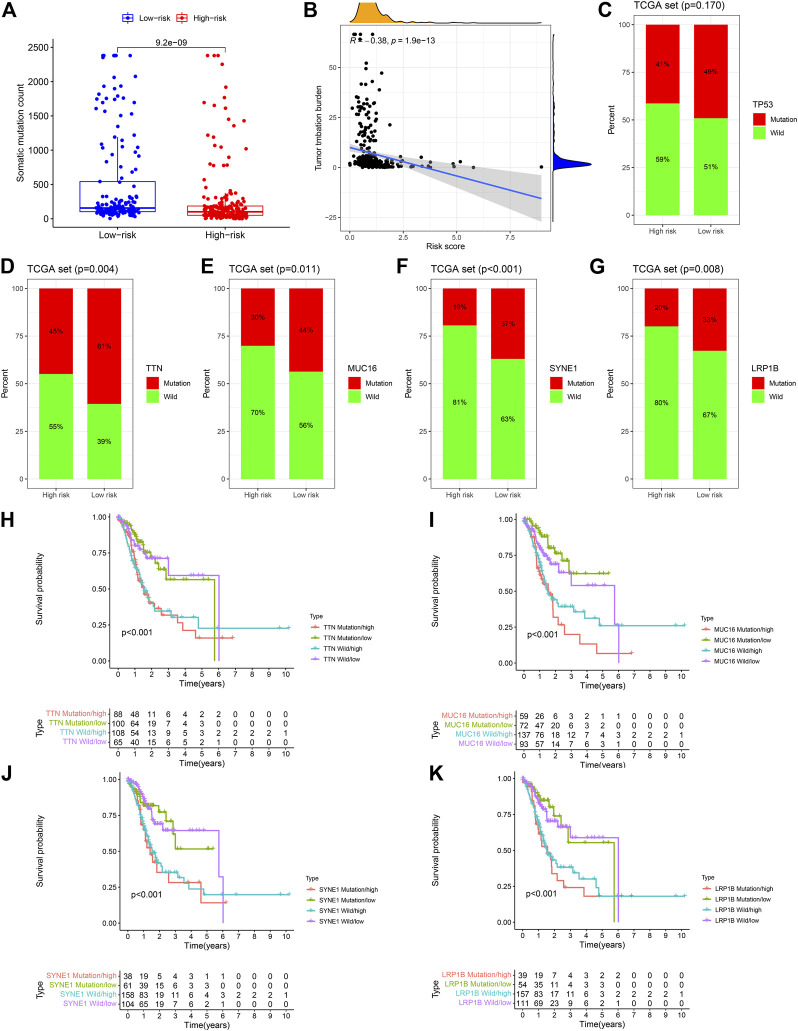
Background: As a caspase-independent type of cell death, necroptosis plays a significant role in the initiation, and progression of gastric cancer (GC). Numerous studies have confirmed that long non-coding RNAs (lncRNAs) are closely related to the prognosis of patients with GC. However, the relationship between necroptosis and lncRNAs in GC remains unclear. Methods: The molecular profiling data (RNA-sequencing and somatic mutation data) and clinical information of patients with stomach adenocarcinoma (STAD) were retrieved from The Cancer Genome Atlas (TCGA) database. Pearson correlation analysis was conducted to identify the necroptosis-related lncRNAs (NRLs). Subsequently, univariate Cox regression and LASSO-Cox regression were conducted to establish a 12-NRLs signature in the training set and validate it in the testing set. Finally, the prognostic power of the 12-NRLs signature was appraised via survival analysis, nomogram, Cox regression, clinicopathological characteristics correlation analysis, and the receiver operating characteristic (ROC) curve. Furthermore, correlations between the signature risk score (RS) and immune cell infiltration, immune checkpoint molecules, somatic gene mutations, and anticancer drug sensitivity were analyzed. Results: In the present study, a 12-NRLs signature comprising REPIN1-AS1, UBL7-AS1, LINC00460, LINC02773, CHROMR, LINC01094, FLNB-AS1, ITFG1-AS1, LASTR, PINK1-AS, LINC01638, and PVT1 was developed to improve the prognosis prediction of STAD patients. Unsupervised methods, including principal component analysis and t-distributed stochastic neighbor embedding, confirmed the capability of the present signature to separate samples with RS. Kaplan-Meier and ROC curves revealed that the signature had an acceptable predictive potency in the TCGA training and testing sets. Cox regression and stratified survival analysis indicated that the 12-NRLs signature were risk factors independent of various clinical parameters. Additionally, immune cell infiltration, immune checkpoint molecules, somatic gene mutations, and half-inhibitory concentration differed significantly among different risk subtypes, which implied that the signature could assess the clinical efficacy of chemotherapy and immunotherapy. Conclusion: This 12-NRLs risk signature may help assess the prognosis and molecular features of patients with STAD and improve treatment modalities, thus can be further applied clinically.

Keywords: lncRNA; molecular characteristics; necroptosis; prognosis; signature; stomach adenocarcinoma.


Conflict of interest statement

The authors declare that the research was conducted in the absence of any commercial or financial relationships that could be construed as a potential conflict of interest.

Figures

FIGURE 1
FIGURE 1
Research flow chart.
FIGURE 2
FIGURE 2
Establishment of lncRNA-mRNA co-expression and PPI network. (A) Necroptosis-related lncRNA-mRNA co-expression network diagram. (B) PPI network of necroptosis-related genes.
FIGURE 3
FIGURE 3
Univariate regression analysis and LASSO regression analysis. (A) The forest plot of prognostic-related lncRNAs. (B) LASSO coefficient profiles of necroptosis-associated lncRNAs. (C) The partial likelihood deviance with changing of log(λ). *:p < 0.05 **:p < 0.01 ***:p < 0.001.
FIGURE 4
FIGURE 4
The prognostic performance of the 12-lncRNAs signature in the training and testing sets. (A) The Sankey diagram shows the connection degree between the necroptosis-related lncRNAs and necroptosis-associated genes. (B) AUC of time-dependent ROC curves at 1-, 2-, and 3-years OS in the training set. (C) AUC of time-dependent ROC curves at 1-, 2-, and 3-years OS in the testing set. (D) ROC curve analysis of clinicopathological parameters and risk score in the training set. (E) ROC curve analysis of clinicopathological parameters and risk score in the testing set.
FIGURE 5
FIGURE 5
The nomogram for predicting the OS of STAD patients at 1, 3, and 5 years. (A) Construction of the nomogram comprising independent prognostic factors (age, stage, and RS). (B) DCA curves for assessment of the clinical utility of the nomogram. (C–E) The Calibration curves of the nomogram for predicting the probability of OS at 1, 3, and 5 years.
FIGURE 6
FIGURE 6
The enriched pathways in high-risk and low-risk subsets obtained using the 12-NRLs signature. (A) Top 6 significantly enriched KEGG pathways in the high-risk subset. (B) Top 6 significantly enriched KEGG pathways in the low-risk subset.
FIGURE 7
FIGURE 7
The landscape of immune infiltration in the high-risk and low-risk subsets. (A) Comparison of the immune score, stromal score, ESTIMATE score, and tumor purity in the low-risk and high-risk subsets. (B) Difference analysis of 22 immune cells infiltration between the high-risk and low-risk subsets. (C, D) Correlation analysis between infiltrating level of macrophages M2, and Tregs and risk score. (E) Immune functional differences between the low-risk and high-risk subsets based on the ssGSEA scores. (F) The correlation analysis between the risk signature and infiltration immune cells. *:p < 0.05 **: p < 0.01 ***:p < 0.001.
FIGURE 8
FIGURE 8
The significance of the NRLs-based signature in chemotherapy and immunotherapy. (A) Sensitivity performance of 20 common chemotherapy agents in the high-risk and low-risk subsets. (B) Cytarabine, (C) DMOG, (D) Imatinib, (E) Sunitinib. (F–J) Scatter plots visualizing markedly differential expression of the immune checkpoint genes CD274, BTLA, CD28, CTLA4, and PDCD1LG2 between the high-risk and low-risk patients. Correlation of risk score and other immune-related prognostic scores. (K–M) T cell dysfunction, T cell exclusion, and TIDE score in different risk subsets. *:p < 0.05 **:p < 0.01 ***:p < 0.001.
FIGURE 9
FIGURE 9
The mutant landscape of the high-risk and low-risk STAD patients. (A) Comparative analysis of mutation events between the high-risk and low-risk subsets. (B) Mutation events are negatively correlated with RS. (C–G) Difference analysis of the top 5 mutant genes between the low-risk and high-risk subsets. (H–K) Survival analysis based on the risk classification and mutation status of TTN, MUC16, SYNE1, and LRP1B.

Similar articles

Cited by

References

    1. Bhan A., Soleimani M., Mandal S. S. (2017). Long Noncoding RNA and Cancer: A New Paradigm. Cancer Res. 77 (15), 3965–3981. 10.1158/0008-5472.can-16-2634 - DOI - PMC - PubMed
    1. Brumatti G., Ma C., Lalaoui N., Nguyen N. Y., Navarro M., Tanzer M. C., et al. (2016). The Caspase-8 Inhibitor Emricasan Combines with the SMAC Mimetic Birinapant to Induce Necroptosis and Treat Acute Myeloid Leukemia. Sci. Transl Med. 8 (339), 339ra69. 10.1126/scitranslmed.aad3099 - DOI - PubMed
    1. Chalmers Z. R., Connelly C. F., Fabrizio D., Gay L., Ali S. M., Ennis R., et al. (2017). Analysis of 100,000 Human Cancer Genomes Reveals the Landscape of Tumor Mutational burden. Genome Med. 9 (1), 34. 10.1186/s13073-017-0424-2 - DOI - PMC - PubMed
    1. Chen J., Kos R., Garssen J., Redegeld F. (2019). Molecular Insights into the Mechanism of Necroptosis: The Necrosome as a Potential Therapeutic Target. Cells 8 (12). 10.3390/cells8121486 - DOI - PMC - PubMed
    1. Chen X., Li W., Ren J., Huang D., He W.-t., Song Y., et al. (2014). Translocation of Mixed Lineage Kinase Domain-like Protein to Plasma Membrane Leads to Necrotic Cell Death. Cell Res 24 (1), 105–121. 10.1038/cr.2013.171 - DOI - PMC - PubMed