

HSPB8 is a Potential Prognostic Biomarker that Correlates With Immune Cell Infiltration in Bladder Cancer
- PMID: 35330734
- PMCID: PMC8940282
- DOI: 10.3389/fgene.2022.804858
HSPB8 is a Potential Prognostic Biomarker that Correlates With Immune Cell Infiltration in Bladder Cancer
Abstract
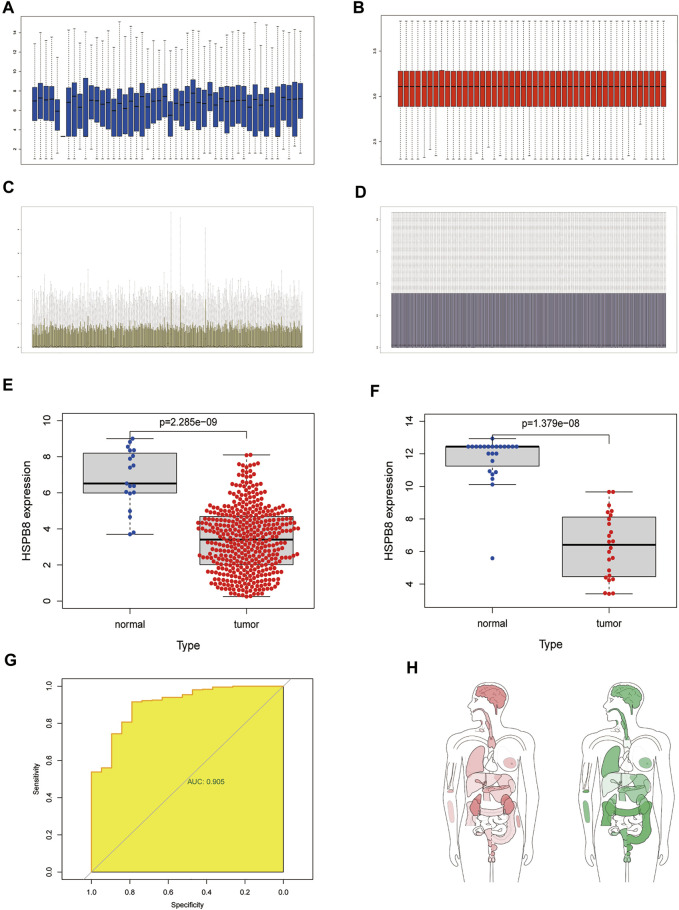
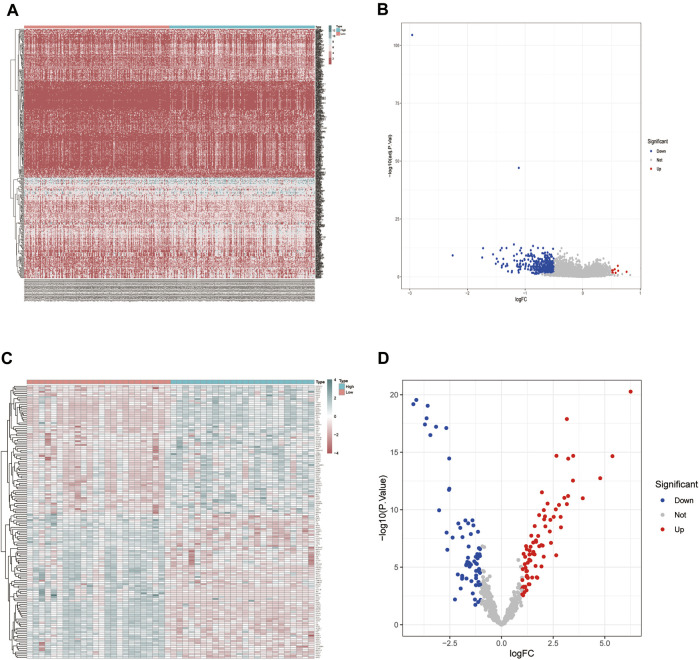
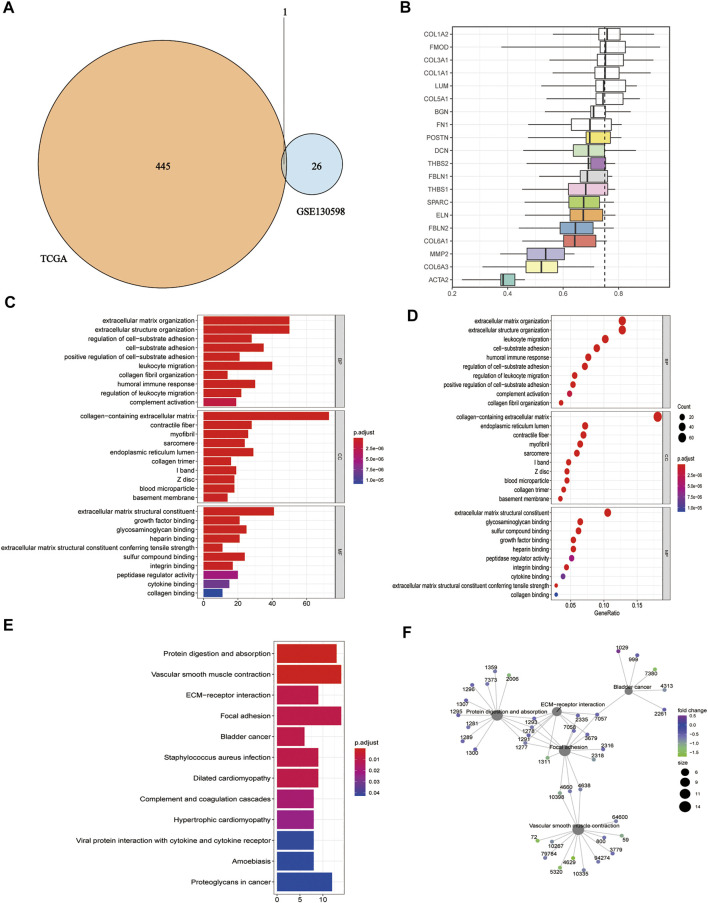
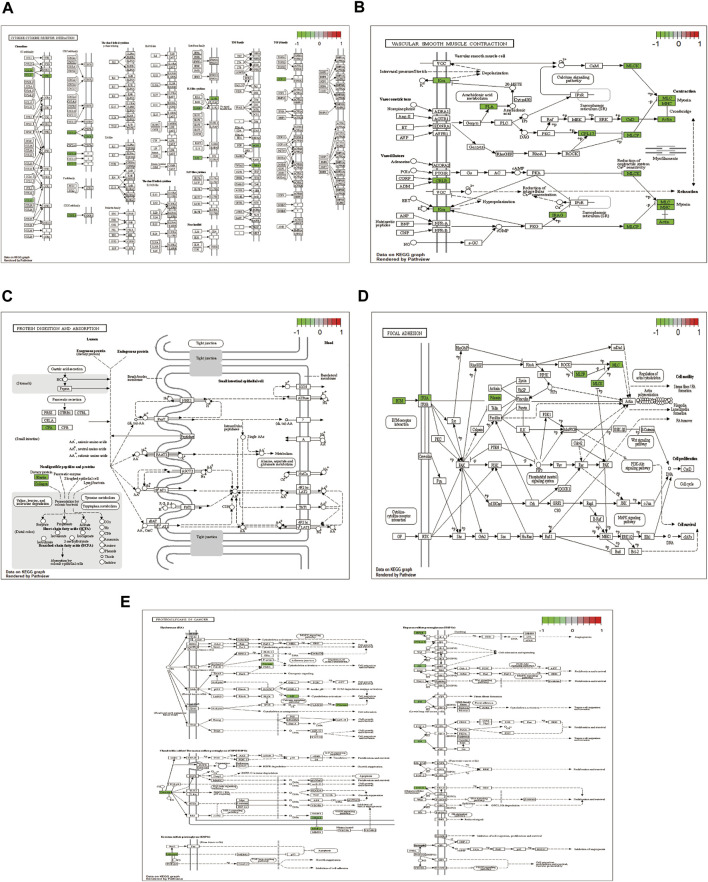
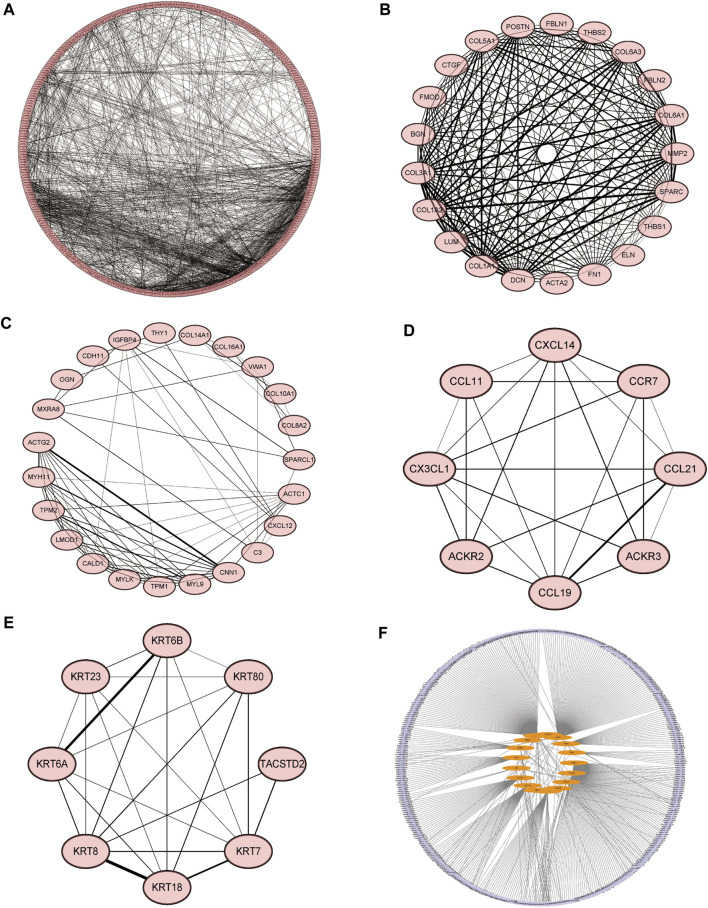
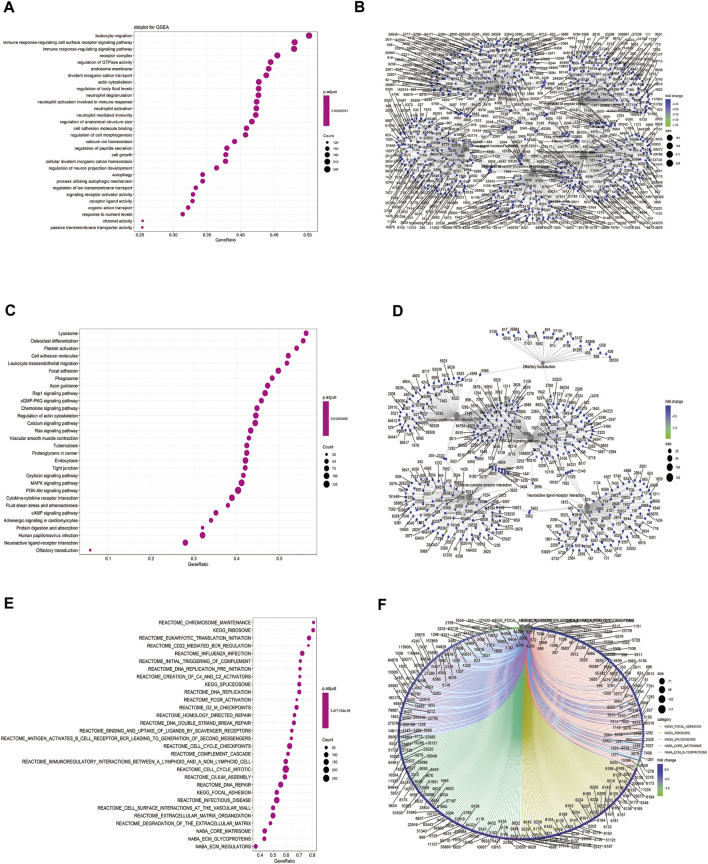
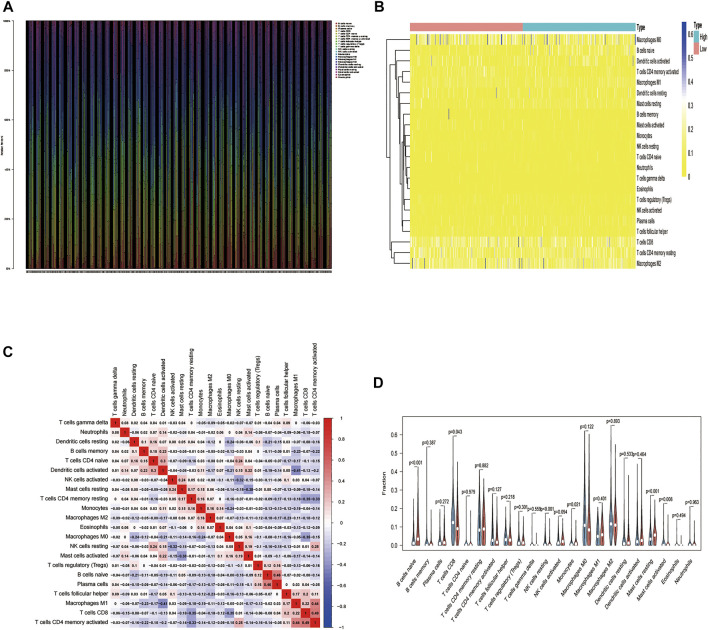
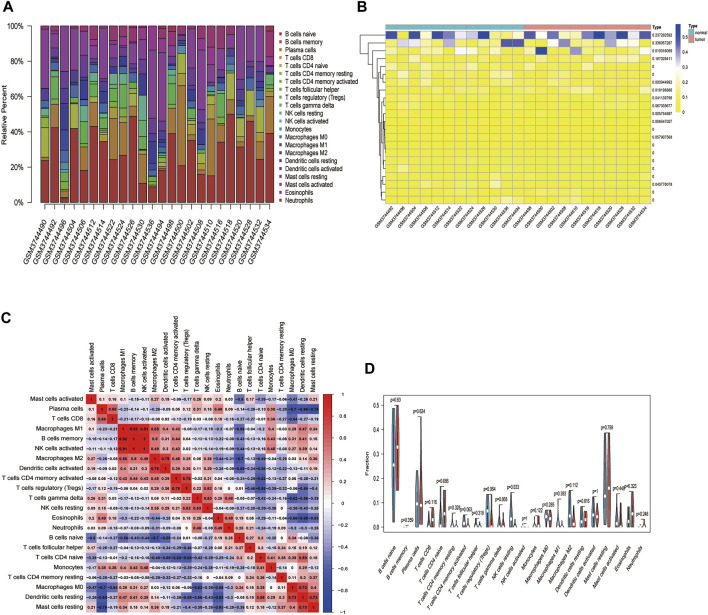
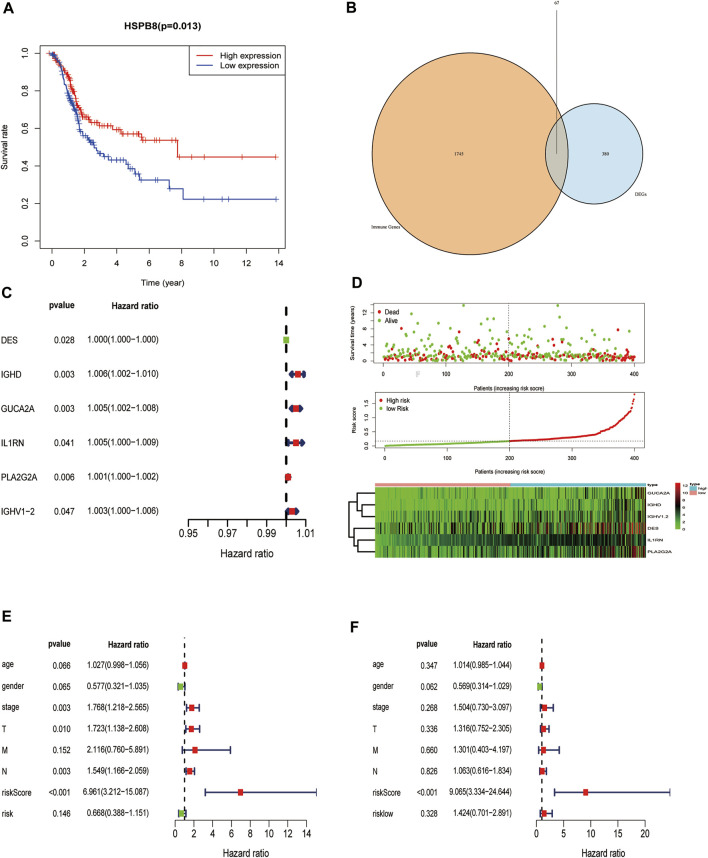
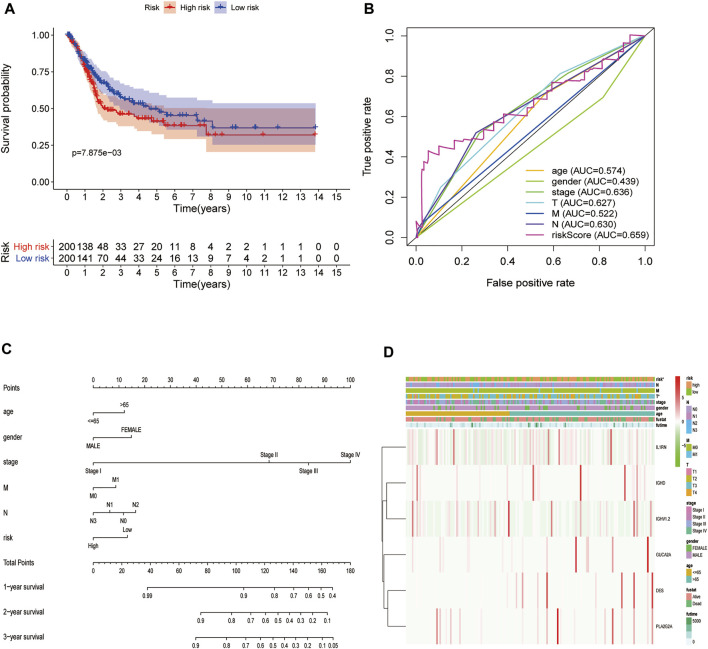
Background: Heat shock protein B8 (HSPB8) is expressed in various cancers. However, the functional and clinicopathological significance of HSPB8 expression in bladder cancer (BC) remains unclear. The present study sought to elucidate the clinicopathological features and prognostic value of HSPB8 in BC. Methods: A BC RNA-seq data set was obtained from The Cancer Genome Atlas Urothelial Bladder Carcinoma (TCGA-BLCA) database, and the external validation dataset GSE130598 was downloaded from the GEO database. Samples in the TCGA-BLCA were categorized into two groups based on HSPB8 expression. Differentially expressed genes (DEGs) between the two groups were defined as HSPB8 co-expressed genes. Gene set enrichment analysis (GSEA), protein-protein interaction networks, and mRNA-microRNA (miRNA) interaction networks were generated to predict the function and interactions of genes that are co-expressed with HSPB8. Finally, we examined immune cell infiltration and constructed a survival prediction model for BC patients. Results: The expression level of HSBP8 has a significant difference between cancer samples and normal samples, and its diagnosis effect was validated by the ROC curve. 446 differential expressed genes between HSBP8 high-expression and HSBP8 low expression groups were identified. Gene enrichment analysis and GSEA analysis show that these differential gene functions are closely related to the occurrence and development of BC and the metabolic pathways of BC. The cancer-related pathways included Cytokine-cytokine receptor Interaction, Focal adhesion, and Proteoglycans in cancer. PPI and protein-coding gene-miRNA network visualized the landscape for these tightly bounded gene interactions. Immune cell infiltration shows that B cells, CD4+T cells, and CD8+T cells have strongly different infiltration levels between the HSBP8 high exp group and low exp group. The survival prediction model shows that HSBP8 has strong prognosis power in the BLCA cohort. Conclusion: Identifying DEGs may enhance understanding of BC development's causes and molecular mechanisms. HSPB8 may play an essential role in BC progression and prognosis and serve as a potential biomarker for BC treatment.
Keywords: HSPB8; biomarker; bladder cancer; microarray; prognosis.
Copyright © 2022 Tan, Fu, Huang, Duan, Zuo, Zhu, Wang and Wang.
Conflict of interest statement
The authors declare that the research was conducted in the absence of any commercial or financial relationships that could be construed as a potential conflict of interest.
Figures
Similar articles
-
Construction of a novel mRNA-signature prediction model for prognosis of bladder cancer based on a statistical analysis.BMC Cancer. 2021 Jul 27;21(1):858. doi: 10.1186/s12885-021-08611-z. BMC Cancer. 2021. PMID: 34315402 Free PMC article.
-
Identification of prognostic biomarkers for breast cancer brain metastases based on the bioinformatics analysis.Biochem Biophys Rep. 2022 Jan 10;29:101203. doi: 10.1016/j.bbrep.2022.101203. eCollection 2022 Mar. Biochem Biophys Rep. 2022. PMID: 35059509 Free PMC article.
-
Identification of a tumor microenvironment-related seven-gene signature for predicting prognosis in bladder cancer.BMC Cancer. 2021 Jun 10;21(1):692. doi: 10.1186/s12885-021-08447-7. BMC Cancer. 2021. PMID: 34112144 Free PMC article.
-
Prognostic value of COL10A1 and its correlation with tumor-infiltrating immune cells in urothelial bladder cancer: A comprehensive study based on bioinformatics and clinical analysis validation.Front Immunol. 2023 Mar 17;14:955949. doi: 10.3389/fimmu.2023.955949. eCollection 2023. Front Immunol. 2023. PMID: 37006317 Free PMC article.
-
Cancer-Associated Membrane Protein as Targeted Therapy for Bladder Cancer.Pharmaceutics. 2022 Oct 18;14(10):2218. doi: 10.3390/pharmaceutics14102218. Pharmaceutics. 2022. PMID: 36297654 Free PMC article. Review.
Cited by
-
Using clusterProfiler to characterize multiomics data.Nat Protoc. 2024 Nov;19(11):3292-3320. doi: 10.1038/s41596-024-01020-z. Epub 2024 Jul 17. Nat Protoc. 2024. PMID: 39019974 Review.
-
Identification and validation of telomerase related lncRNAs signature to predict prognosis and tumor immunotherapy response in bladder cancer.Sci Rep. 2023 Dec 9;13(1):21816. doi: 10.1038/s41598-023-49167-1. Sci Rep. 2023. PMID: 38071230 Free PMC article.
-
Two sides of the same coin: heat shock proteins as biomarkers and therapeutic targets for some complex diseases.Front Mol Biosci. 2025 Feb 20;12:1491227. doi: 10.3389/fmolb.2025.1491227. eCollection 2025. Front Mol Biosci. 2025. PMID: 40051500 Free PMC article. Review.
-
HSPB8 Facilitates the Oncogenesis and Advancement of Bladder Cancer via Activation of HSP27.J Cancer. 2024 Jan 1;15(3):645-658. doi: 10.7150/jca.89994. eCollection 2024. J Cancer. 2024. PMID: 38213722 Free PMC article.
-
Identification of a six-gene signature to predict survival and immunotherapy effectiveness of gastric cancer.Front Oncol. 2023 Jun 19;13:1210994. doi: 10.3389/fonc.2023.1210994. eCollection 2023. Front Oncol. 2023. PMID: 37404760 Free PMC article.
References
-
- Chandrashekar D. S., Chakravarthi B. V. S. K., Robinson A. D., Anderson J. C., Agarwal S., Balasubramanya S. A. H., et al. (2020). Therapeutically Actionable PAK4 Is Amplified, Overexpressed, and Involved in Bladder Cancer Progression. Oncogene 39, 4077–4091. 10.1038/s41388-020-1275-7 - DOI - PubMed
LinkOut - more resources
Full Text Sources
Research Materials