. 2020 Jul 2;1(1):zqaa008.
doi: 10.1093/function/zqaa008. eCollection 2020.

Projection-specific Activity of Layer 2/3 Neurons Imaged in Mouse Primary Somatosensory Barrel Cortex During a Whisker Detection Task

Affiliations

Projection-specific Activity of Layer 2/3 Neurons Imaged in Mouse Primary Somatosensory Barrel Cortex During a Whisker Detection Task

Angeliki Vavladeli et al. Function (Oxf). .

Erratum in

Abstract

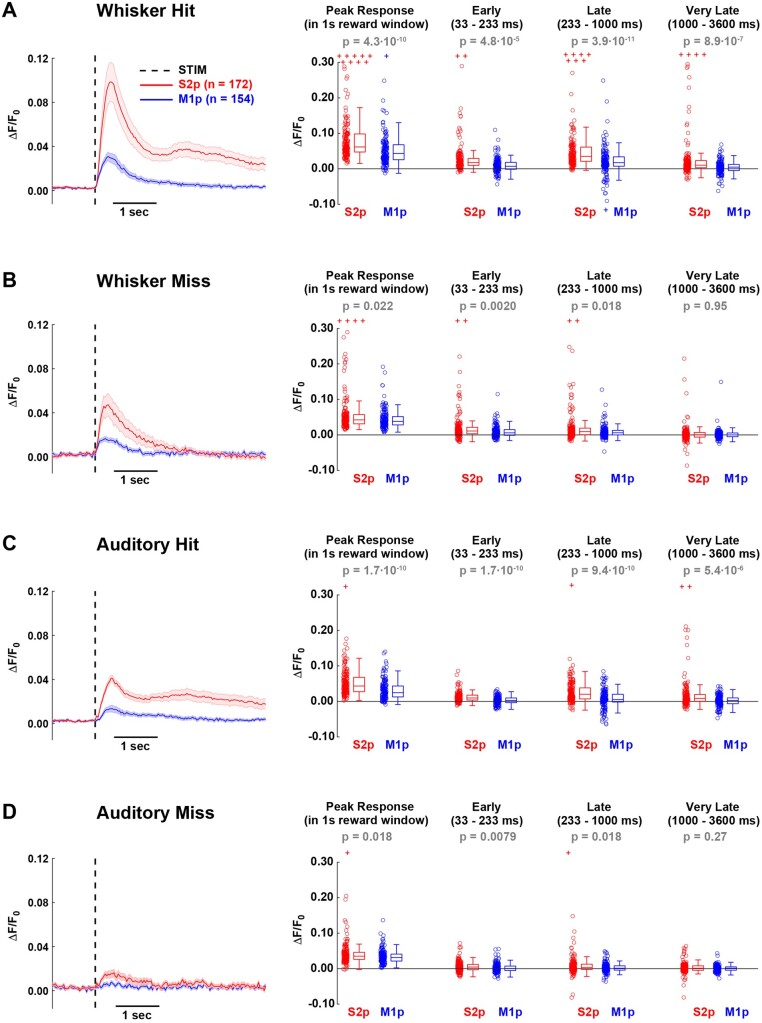
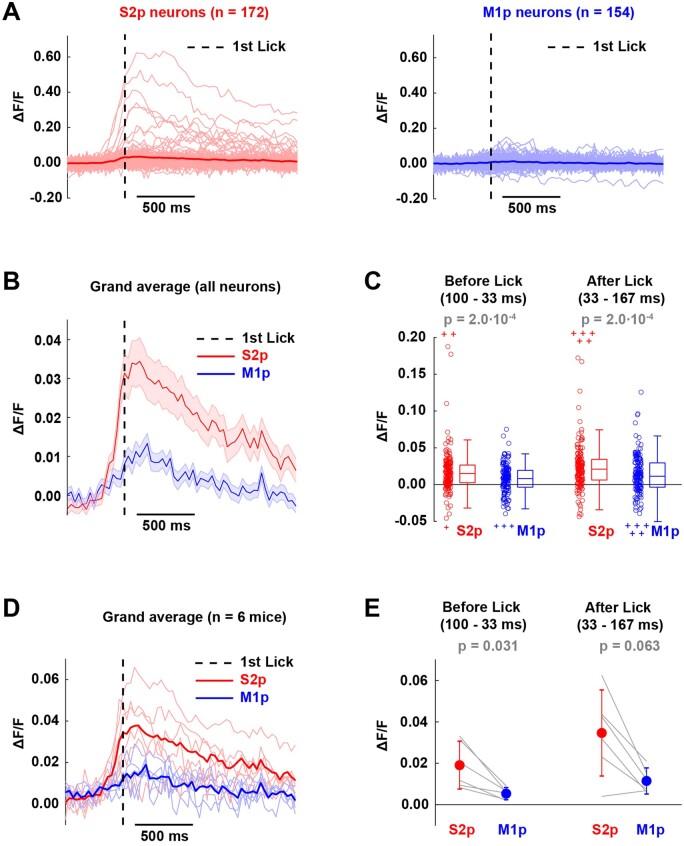
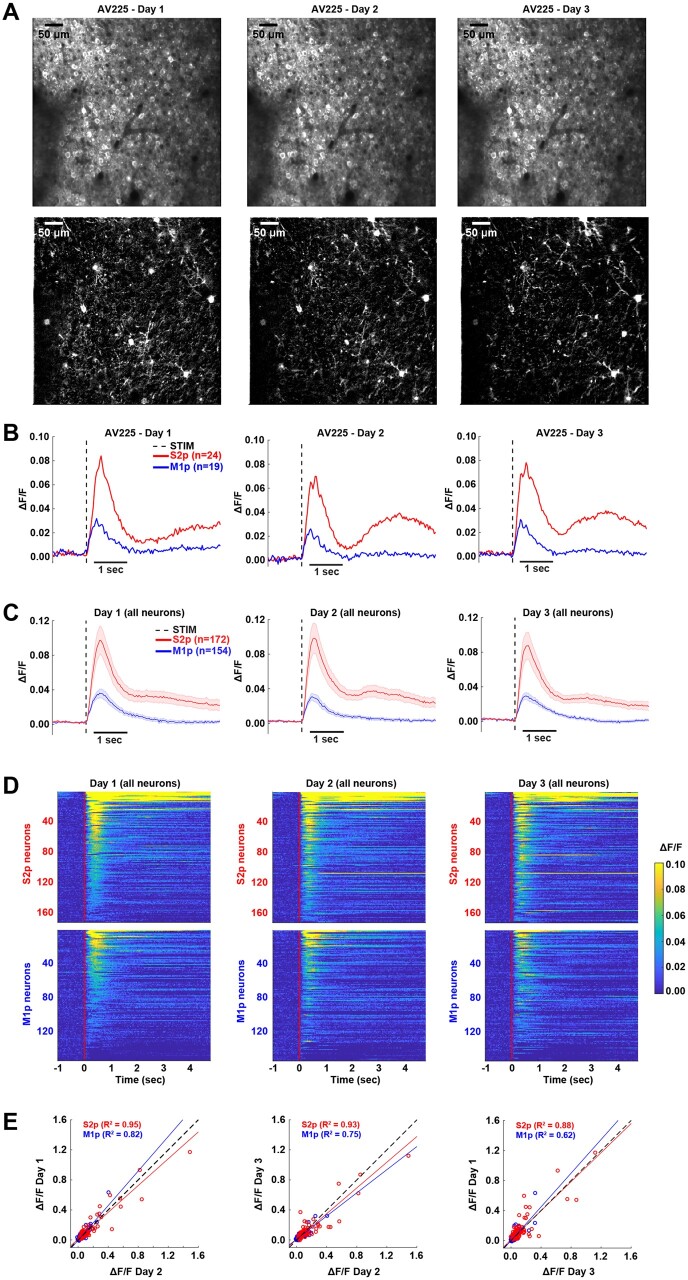
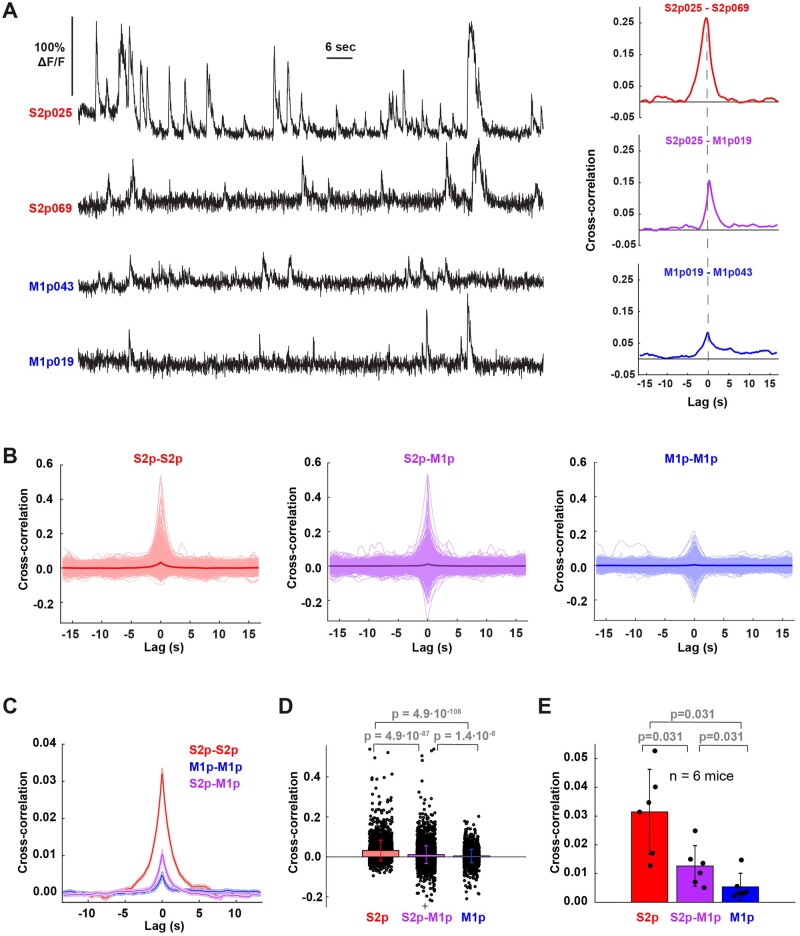
The brain processes sensory information in a context- and learning-dependent manner for adaptive behavior. Through reward-based learning, relevant sensory stimuli can become linked to execution of specific actions associated with positive outcomes. The neuronal circuits involved in such goal-directed sensory-to-motor transformations remain to be precisely determined. Studying simple learned sensorimotor transformations in head-restrained mice offers the opportunity for detailed measurements of cellular activity during task performance. Here, we trained mice to lick a reward spout in response to a whisker deflection and an auditory tone. Through two-photon calcium imaging of retrogradely labeled neurons, we found that neurons located in primary whisker somatosensory barrel cortex projecting to secondary whisker somatosensory cortex had larger calcium signals than neighboring neurons projecting to primary whisker motor cortex in response to whisker deflection and auditory stimulation, as well as before spontaneous licking. Longitudinal imaging of the same neurons revealed that these projection-specific responses were relatively stable across 3 days. In addition, the activity of neurons projecting to secondary whisker somatosensory cortex was more highly correlated than for neurons projecting to primary whisker motor cortex. The large and correlated activity of neurons projecting to secondary whisker somatosensory cortex might enhance the pathway-specific signaling of important sensory information contributing to task execution. Our data support the hypothesis that communication between primary and secondary somatosensory cortex might be an early critical step in whisker sensory perception. More generally, our data suggest the importance of investigating projection-specific neuronal activity in distinct populations of intermingled excitatory neocortical neurons during task performance.

Keywords: goal-directed behavior; licking; neocortex; projection neurons; sensorimotor transformation; sensory perception; somatosensory cortex; two-photon calcium imaging; whisker sensation.


Figures

Figure 1.
Figure 1.
A Whisker and Auditory Detection Task for Head-restrained Mice. (A) Schematic of experimental setup. (B) Trial types included auditory hit (AHIT), auditory miss (AMISS), whisker hit (WHIT), whisker miss (WMISS), false alarm (FA), correct rejection (CR) trials. (C) Performance of six expert mice. (D) Quantification of the reaction time from stimulus onset (time from stimulus presentation until the first lick). (E) Expert mice were exposed to a control experiment removing the metal particle from the whisker to test whether the magnetic pulse acted specifically via the metal particle attached to the C2 whisker, and not via other potential cues. Performance on whisker trials was high when the metal particle was on the whisker (Particle ON), and almost abolished when the metal particle was removed from the whisker (Particle OFF).
Figure 2.
Figure 2.
Two-Photon Calcium Imaging of Layer 2/3 Projection Neurons. (A) Retrograde labelling of S2p and M1p neurons in wS1. Schematic of mouse brain showing retrograde tracers and injection areas. CTB conjugated with AlexaFluor-594 (red) and AlexaFluor-647 (blue) was injected into wS2 and wM1 of the left hemisphere. (B) L2/3 neurons selectively expressed GCaMP6f in Rasgrf2-dCre mice crossed with TIGRE2.0 Cre-dependent GCaMP6f reporter mice (Rasgrf2-dCre x Ai148). Example coronal brain section around the center of whisker primary somatosensory cortex (left panel) aligned according to a mouse brain atlas, with a higher magnification image of cortex (right panel). (C) CTB-labeled layer 2/3 neurons in wS1 at the subpial depth of 200 μm imaged in vivo with a two-photon microscope. S2p neurons (red) were labeled with CTB AlexaFluor-594, M1p neurons (blue) were labeled with CTB AlexaFluor-647, and in green neurons expressing GCaMP6f. (D) GCaMP6f fluorescence traces of two S2p and two M1p neurons imaged simultaneously during task performance.
Figure 3.
Figure 3.
GCaMP6f Signals in S2p and M1p Neurons in L2/3 of wS1 During Task Performance for (A) whisker hit, (B) whisker miss, (C) auditory hit and (D) auditory miss trials. Left panel shows the grand average response across all S2p and M1p neurons (thick line: mean, shading: ± SEM). Quantification of mean peak response within the 1 s reward window, as well as mean response in different time windows after stimulus presentation: early (33–233 ms), late (233–1000 ms), and very late (1000–3600 ms). In the box plots, central line indicates the median, and bottom and top edges of the box indicate the 25th and 75th percentiles, respectively. The whiskers show the most extreme data points not including outliers, and off-scale outliers are indicated using the “+” symbol. Open circles represent individual neurons. Wilcoxon rank-sum test was used for statistical comparisons.
Figure 4.
Figure 4.
Distinct GCaMP6f Signals in S2p versus M1p Neurons Were Found in Each Individual Mouse for (A) whisker hit, (B) whisker miss, (C) auditory hit and (D) auditory miss trials. Thick lines correspond to the population means across mice and thin lines to average responses of individual animals. Dashed line indicates stimulation event. Quantification of mean peak response within the 1 s reward window, as well as mean response in different time windows after stimulus presentation: early (33–233 ms), late (233–1000 ms) and very late (1000–3600 ms). Wilcoxon signed-rank test was used for statistical comparisons.
Figure 5.
Figure 5.
Neuronal Responses Correlated with Task Execution for S2p and M1p Neurons in L2/3 of wS1. (A) Left panel, grand average traces of S2p neurons (thick line: mean, shading: ± SEM) during hit (red) and miss (black) trials. Right, quantification of mean peak response within the 1 s reward window, as well as mean response in different time windows after stimulus presentation: early (33–233 ms), late (233–1000 ms), and very late (1000–3600 ms). In the box plots, central line indicates the median, and bottom and top edges of the box indicate the 25th and 75th percentiles, respectively. The whiskers show the most extreme data points not including outliers, and off-scale outliers are indicated using the “+” symbol. Open circles represent individual neurons. Wilcoxon rank-sum test was used for statistical comparisons. (B) Same as A, but for M1p neurons. (C) and (D) Same as A and B, respectively, but for whisker hit versus auditory hit trials.
Figure 6.
Figure 6.
Lick-triggered Analysis in False Alarm Trials. (A) Average calcium responses aligned to lick onset for individual neurons (thin lines) and for population means (thick solid lines) of S2p and M1p neurons in L2/3 of wS1. Dashed line indicates 1st lick time. (B) Grand average response of S2p and M1p neurons (thick line: mean, shading: ± SEM). (C) Quantification of mean response before (100–33 ms) and after (33–167 ms) the 1st lick time for individual neurons. In the box plots, the central line indicates the median, and the bottom and top edges of the box indicate the 25th and 75th percentiles, respectively. The whiskers show the most extreme data points not including outliers, and off-scale outliers are indicated using the “+” symbol. Open circles represent individual neurons. Wilcoxon rank-sum test was used for statistical comparisons. (D) Grand average lick-triggered response computed across six mice for S2p and M1p neurons in L2/3 of wS1 for false alarm trials. Thick lines correspond to population mean across mice and thin lines to average responses of individual animals. (E) Quantification of mean response before (100–33 ms) and after (33–167 ms) the first lick time. Wilcoxon signed-rank test was used for statistical comparisons.
Figure 7.
Figure 7.
Longitudinal Monitoring of Calcium Signals in S2p and M1p Neurons During Task Performance. (A) Top panel: stable recordings over three training sessions (Day 1, Day 2, and Day 3) of an example mouse (AV225). Average two-photon image of the recorded field-of-view across sessions. Bottom panels: maximum projection ΔF/F image during 1 s after stimulation over days for whisker hit trials. (B) Average GCaMP6f responses of S2p and M1p neurons for whisker hit trials across sessions for the example mouse. (C) Grand average response of all S2p and M1p neurons across sessions (thick line: mean, shading: ± SEM). (D) Heat map of GCaMP6f signals for each neuron in whisker hit trials across sessions. Each line of the image corresponds to the average calcium trace of an individual neuron. (E) Comparison of calcium responses of S2p and M1p neurons between sessions. A least-squares linear fit was superimposed on each scatter plot, and the R-squared coefficient is indicated for each cell type. The dashed line at 45° refers to the regression line of unity.
Figure 8.
Figure 8.
Cross-correlation Analysis in Correct Rejection Trials. (A) Left side, example of calcium signals of two S2p and two M1p neurons (mouse AV208). Right side, cross-correlation between example pairs of these neurons. (B) Cross-correlation between all pairs of S2p (n = 2521 pairs), M1p (n = 2143 pairs), and S2p-M1p neurons (n = 4719 pairs) across the six mice (thin lines individual pairs; thick lines grand averages). (C) Grand average cross-correlation of all pairs of S2p-S2p, S2p-M1p and M1p-M1p neurons (thick line: mean, shading: ± SEM). (D) Bar graph of mean cross-correlation at zero-lag for all pairs of S2p-S2p, S2p-M1p, and M1p-M1p neurons. Individual circles in black indicate the mean cross-correlation at zero-lag for individual pairs of neurons across all mice. Black crosses on top and bottom indicate off-scale outliers. Wilcoxon rank-sum test was used for statistical comparisons. Bar graphs with error bars represent the mean ± standard deviation. (E) Bar graph of mean cross-correlation at zero-lag for pairs of S2p-S2p, S2p-M1p, and M1p-M1p neurons across mice (n = 6). Individual filled circles in black indicate the mean cross-correlation at zero-lag for all pairs of neurons in a single mouse. Wilcoxon signed-rank test was used for statistical comparisons. Bar graphs with error bars represent the mean ± SD.
Figure 9.
Figure 9.
Some Possible Neural Circuit Mechanisms Contributing to the Execution of the Whisker Detection Task. (A) In the detection task, S2p neurons compared to M1p neurons respond more strongly to whisker stimulation and show enhanced correlated spontaneous activity. This could result from strong common synaptic input to S2p neurons and/or from strong reciprocal local excitatory synaptic connectivity between S2p neurons. (B) Whisker deflection evokes action potential firing in the primary sensory neurons of the trigeminal ganglion (Tg). The Tg neurons release glutamate on postsynaptic neurons in various trigeminal brainstem nuclei. The lemniscal pathway originates in the principal trigeminal nucleus (Pr5), which excites neurons in the ventral posterior medial (VPM) primary whisker somatosensory thalamic nucleus through glutamatergic synapses. The paralemniscal pathway originates from glutamatergic neurons in the spinal trigeminal interpolaris nucleus (Sp5i) of the brainstem which innervates an anterior first-order division of the posterior medial thalamus (POm). Glutamatergic projection neurons in VPM and POm in turn predominantly innervate wS1 and wS2 respectively. Reciprocal excitatory interactions through glutamatergic synapses between wS1 and wS2 may be a critical early step in whisker sensory perception and decision-making (13,44). Interactions of wS1 and wS2 with higher-order POm may also be important. (C) Neuronal activity in various brain areas likely contributes to converting the whisker sensory signal into the licking motor response. In addition to wS1 and wS2, further important nodes have been suggested to include additional cortical regions such as motor cortex (tjM1, tjM2/ALM), medial prefrontal cortex (mPFC) and the dorsal CA1 region of hippocampus (dCA1), as well as subcortical structures such as thalamus, basal ganglia and brainstem. Further research is likely to reveal additional participating brain areas (indicated by “+…”).

Comment in

Similar articles

Cited by

References

    1. Bosman LWJ, Houweling AR, Owens CB, et al.Anatomical pathways involved in generating and sensing rhythmic whisker movements. Front Integr Neurosci 2011;5:53. - PMC - PubMed
    1. Diamond ME, von Heimendahl M, Knutsen PM, et al.“Where” and “what” in the whisker sensorimotor system. Nat Rev Neurosci 2008;9:601–612. - PubMed
    1. Feldmeyer D, Brecht M, Helmchen F, et al.Barrel cortex function. Prog Neurobiol 2013;103:3–27. - PubMed
    1. Petersen CCH. Sensorimotor processing in the rodent barrel cortex. Nat Rev Neurosci 2019;20:533–546. - PMC - PubMed
    1. Hires SA, Gutnisky DA, Yu J, et al.Low-noise encoding of active touch by layer 4 in the somatosensory cortex. eLife 2015;4:e06619. - PMC - PubMed

Publication types

LinkOut - more resources