Quorum Sensing Inhibition and Metabolic Intervention of 4-Hydroxycinnamic Acid Against Agrobacterium tumefaciens
- PMID: 35330766
- PMCID: PMC8940537
- DOI: 10.3389/fmicb.2022.830632
Quorum Sensing Inhibition and Metabolic Intervention of 4-Hydroxycinnamic Acid Against Agrobacterium tumefaciens
Abstract
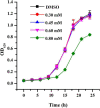
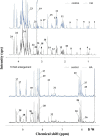
The natural product 4-hydroxycinnamic acid (HA) was firstly isolated from the metabolites of Phomopsis liquidambari, one endophytic fungus from Punica granatum leaves. The anti-QS potential of HA was evaluated by β-galactosidase assay and acylated homoserine lactones (AHL) analysis. The MIC of HA was > 1.20 mM. Exposure to HA at sub-MIC concentrations (0.30-0.60 mM) remarkably reduced the β-galactosidase activity and AHL secretion. Transcriptional analysis by qRT-PCR and docking simulation indicated that HA functions as an anti-QS agent by inhibiting the transcriptional levels of traI and traR rather than signal mimicry. The blocked QS lead to suppressed biofilm formation, motilities, and flagella formation after exposure to HA at concentrations ranging from 0.30 to 0.80 mM. The dysfunctional QS also resulted in repressed antioxidant enzymes and intensified oxidative stress. The intensified oxidative stress destroyed membrane integrity, induced energy supply deficiency, resulted in disorder of protein and nuclear acid metabolism, and ultimately weakened pathogenicity of A. tumefaciens. HA may have promising potential for controlling A. tumefaciens.
Keywords: 4-hydroxycinnamic acid; Agrobacterium tumefaciens; metabolism; pathogenicity; quorum sensing.
Copyright © 2022 Zhou, Ji, Jiang, Tan and Jia.
Conflict of interest statement
The authors declare that the research was conducted in the absence of any commercial or financial relationships that could be construed as a potential conflict of interest.
Figures


Similar articles
-
1-(4-Amino-2-Hydroxyphenyl)Ethenone Suppresses Agrobacterium tumefaciens Virulence and Metabolism.Front Microbiol. 2020 Nov 12;11:584767. doi: 10.3389/fmicb.2020.584767. eCollection 2020. Front Microbiol. 2020. PMID: 33281779 Free PMC article.
-
1-(4-Amino-2-hydroxyphenyl)ethanone from Phomopsis liquidambari showed quorum sensing inhibitory activity against Pseudomonas aeruginosa.Appl Microbiol Biotechnol. 2021 Jan;105(1):341-352. doi: 10.1007/s00253-020-11013-z. Epub 2020 Nov 20. Appl Microbiol Biotechnol. 2021. PMID: 33215259
-
Use of Whole-Cell Bioassays for Screening Quorum Signaling, Quorum Interference, and Biofilm Dispersion.Methods Mol Biol. 2018;1673:3-24. doi: 10.1007/978-1-4939-7309-5_1. Methods Mol Biol. 2018. PMID: 29130160
-
Functions and regulation of quorum-sensing in Agrobacterium tumefaciens.Front Plant Sci. 2014 Jan 31;5:14. doi: 10.3389/fpls.2014.00014. eCollection 2014. Front Plant Sci. 2014. PMID: 24550924 Free PMC article. Review.
-
Quenching of acyl-homoserine lactone-dependent quorum sensing by enzymatic disruption of signal molecules.Acta Biochim Pol. 2009;56(1):1-16. Epub 2009 Mar 17. Acta Biochim Pol. 2009. PMID: 19287806 Review.
Cited by
-
Inhibition of Quorum Sensing Controlled Virulence Factors and Biofilm Formation of Streptococcus mutans Isolated From Orthodontic Subjects by 4-Hydroxycinnamic Acid.Cureus. 2023 Oct 22;15(10):e47490. doi: 10.7759/cureus.47490. eCollection 2023 Oct. Cureus. 2023. PMID: 38021948 Free PMC article.
-
Targeting Agrobacterium tumefaciens: A Computational Study on Quorum Sensing Inhibition.J Basic Microbiol. 2025 Jul;65(7):e70041. doi: 10.1002/jobm.70041. Epub 2025 Apr 22. J Basic Microbiol. 2025. PMID: 40264335 Free PMC article.
-
Two cinnamoyl hydroxamates as potential quorum sensing inhibitors against Pseudomonas aeruginosa.Front Cell Infect Microbiol. 2024 Aug 6;14:1424038. doi: 10.3389/fcimb.2024.1424038. eCollection 2024. Front Cell Infect Microbiol. 2024. PMID: 39165918 Free PMC article.
References
-
- Dandurishvili N., Toklikishvili N., Ovadis M., Eliashvili P., Giorgobiani N., Keshelava R., et al. (2011). Broad-range antagonistic rhizobacteria Pseudomonas fluorescens and Serratia plymuthica suppress Agrobacterium crown gall tumours on tomato plants. J. Appl. Microbiol. 110 341–352. 10.1111/j.1365-2672.2010.04891.x - DOI - PubMed
LinkOut - more resources
Full Text Sources

