. 2021 Feb 19;2(2):zqab007.
doi: 10.1093/function/zqab007. eCollection 2021.

Hydrogen Sulfide Upregulates Acid-sensing Ion Channels via the MAPK-Erk1/2 Signaling Pathway

Affiliations

Hydrogen Sulfide Upregulates Acid-sensing Ion Channels via the MAPK-Erk1/2 Signaling Pathway

Zhong Peng et al. Function (Oxf). .

Abstract

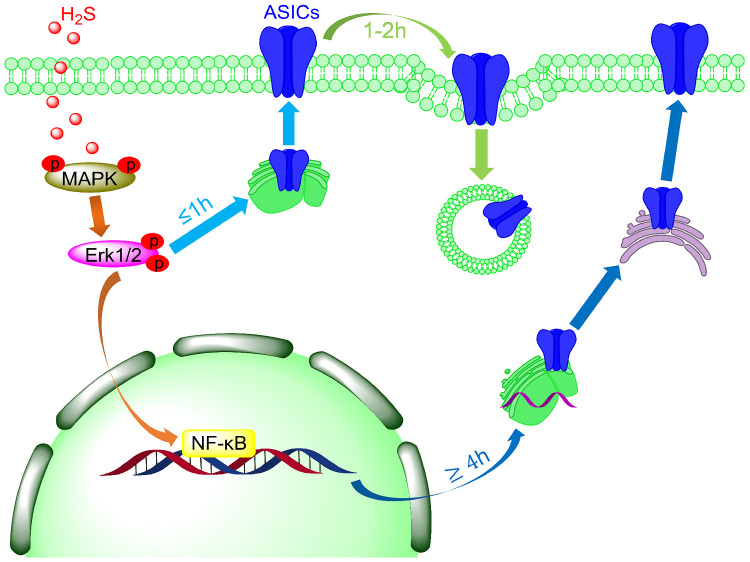
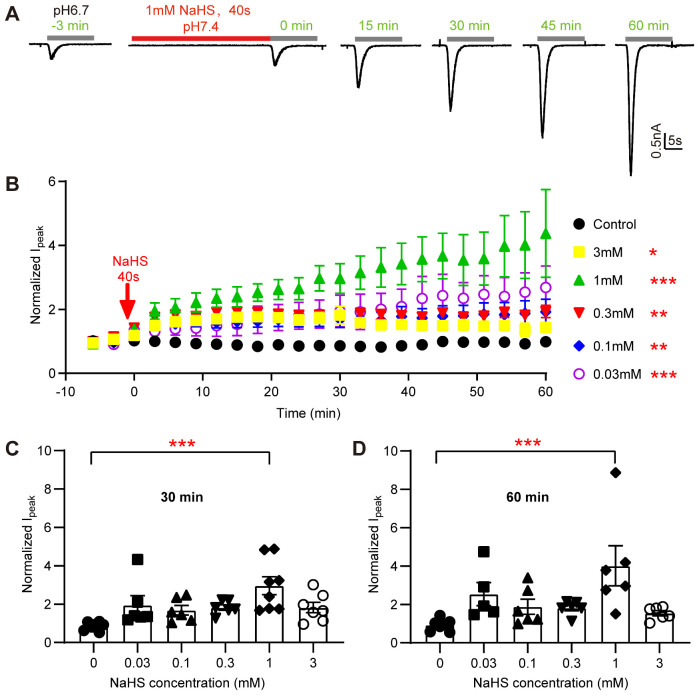
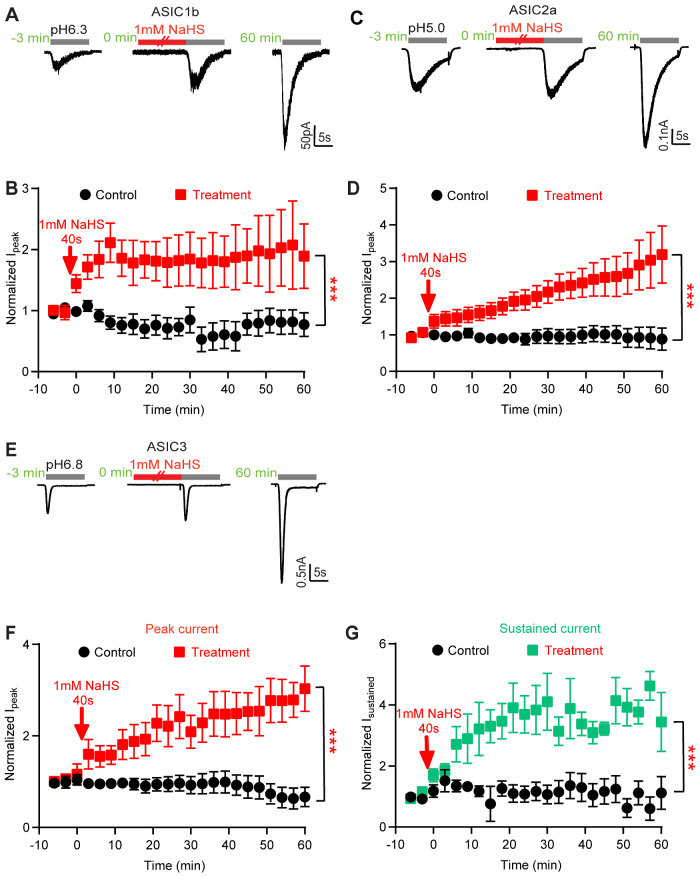
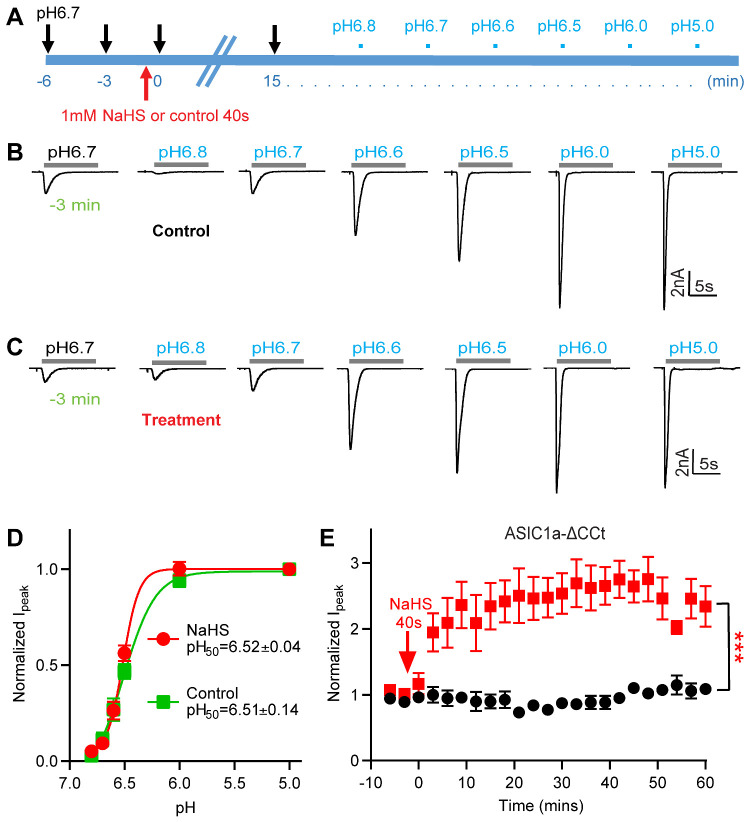
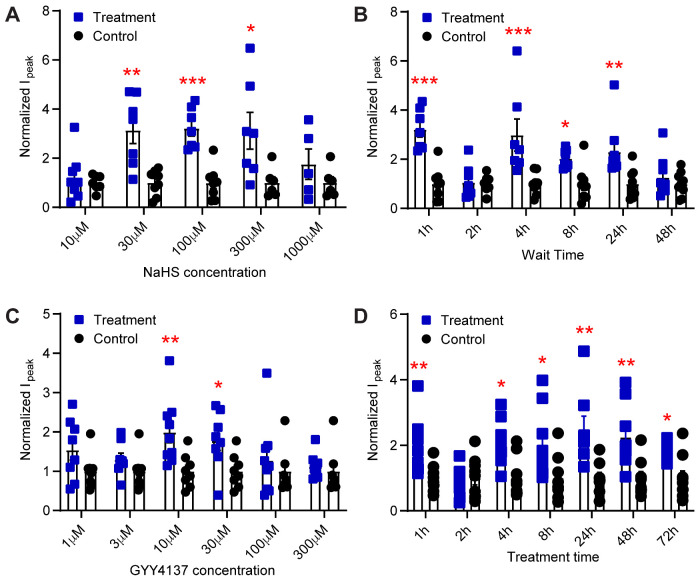
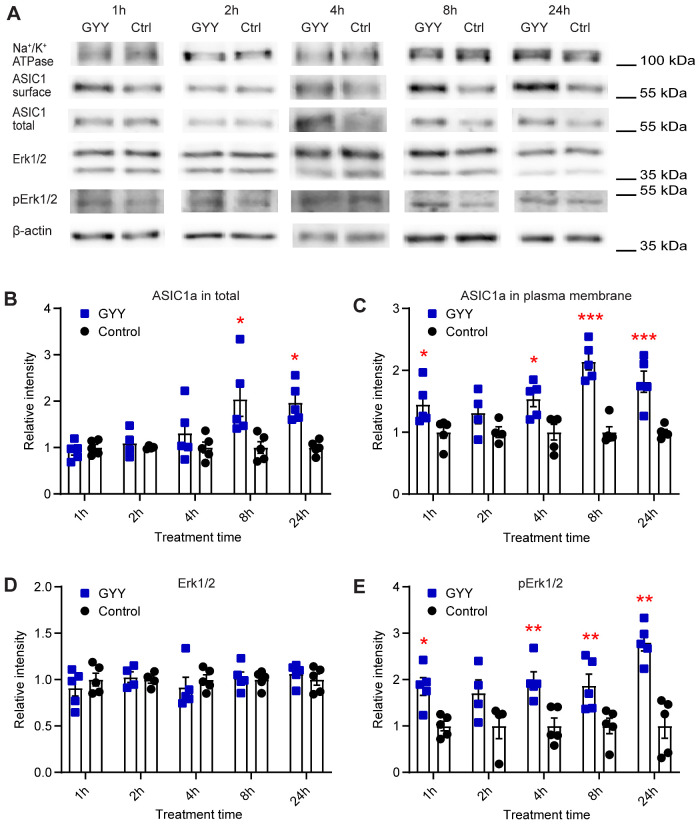
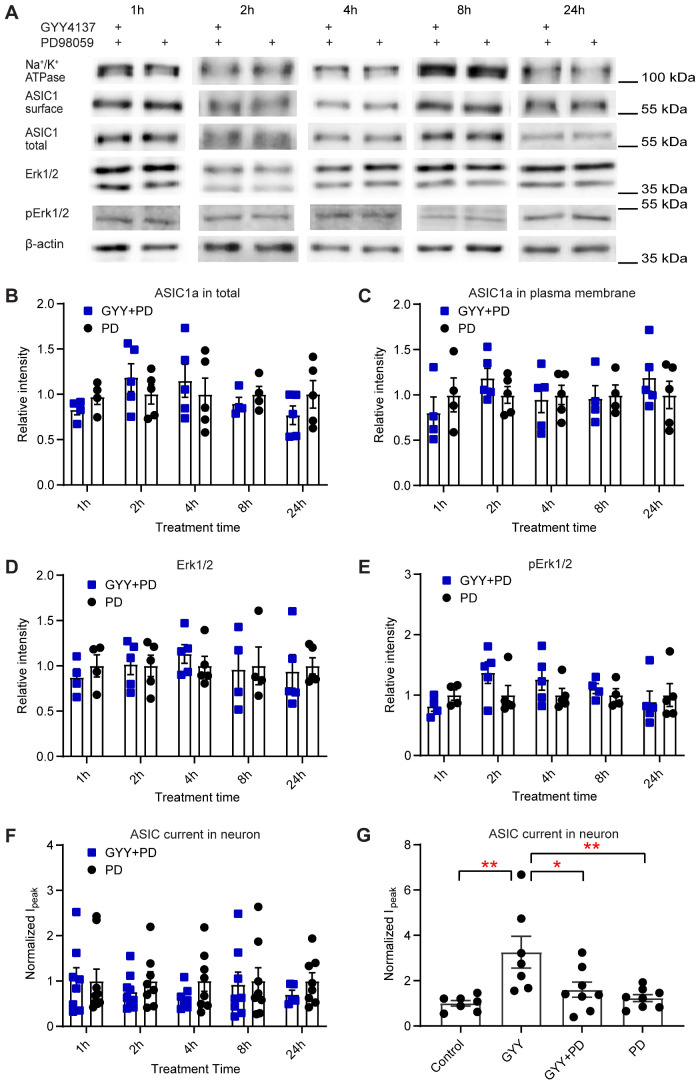
Hydrogen sulfide (H2S) emerged recently as a new gasotransmitter and was shown to exert cellular effects by interacting with proteins, among them many ion channels. Acid-sensing ion channels (ASICs) are neuronal voltage-insensitive Na+ channels activated by extracellular protons. ASICs are involved in many physiological and pathological processes, such as fear conditioning, pain sensation, and seizures. We characterize here the regulation of ASICs by H2S. In transfected mammalian cells, the H2S donor NaHS increased the acid-induced ASIC1a peak currents in a time- and concentration-dependent manner. Similarly, NaHS potentiated also the acid-induced currents of ASIC1b, ASIC2a, and ASIC3. An upregulation induced by the H2S donors NaHS and GYY4137 was also observed with the endogenous ASIC currents of cultured hypothalamus neurons. In parallel with the effect on function, the total and plasma membrane expression of ASIC1a was increased by GYY4137, as determined in cultured cortical neurons. H2S also enhanced the phosphorylation of the extracellular signal-regulated kinase (pErk1/2), which belongs to the family of mitogen-activated protein kinases (MAPKs). Pharmacological blockade of the MAPK signaling pathway prevented the GYY4137-induced increase of ASIC function and expression, indicating that this pathway is required for ASIC regulation by H2S. Our study demonstrates that H2S regulates ASIC expression and function, and identifies the involved signaling mechanism. Since H2S shares several roles with ASICs, as for example facilitation of learning and memory, protection during seizure activity, and modulation of nociception, it may be possible that H2S exerts some of these effects via a regulation of ASIC function.

Keywords: ASIC; MAPK; hydrogen sulfide; p-Erk1/2; patch-clamp; regulation.


Figures

None
Graphical abstract
Figure 1.
Figure 1.
The H2S Donor NaHS Potentiates ASIC1a Currents in a Concentration- and Time-Dependent Manner. (A) Representative current traces obtained with whole-cell patch-clamp of human ASIC1a-expressing CHO cells at −60 mV, induced by acidification to pH 6.7 at different time points as indicated. One millimolar NaHS was administered once in the experiment for 40 s (red horizontal line). (B) pH 6.7-induced ASIC1a peak current amplitudes (Mean ± SEM) measured over a period of 60 min without NaHS (control, black symbols) or with a 40-s exposure at the indicated concentration just before the time point 0. The current amplitudes were normalized to the pH 6.7-induced currents measured before the NaHS exposure (at −3 and −6 min), n = 5–7. *P < 0.05; **P < 0.01; ***P < 0.001; compared with the control (black symbols) over the period 0–60 min by one-way ANOVA test and Dunnett’s post hoc test. C, D, pH 6.7-induced peak current amplitudes of ASIC1a expressed in CHO cells at 30 min (C) and 60 min (D) after 40-s exposure to the indicated concentration of NaHS, from the experiments shown in (B), normalized to the pH 6.7-induced current amplitude before NaHS exposure, n = 5–6. The bar and error bars indicate mean±SEM. ***P < 0.001, compared to control, by one-way ANOVA test and Dunnett’s post hoc test.
Figure 2.
Figure 2.
NaHS Potentiates the Current of All Tested ASIC Isoforms. Current traces and data were obtained by whole-cell patch-clamp at −60 mV of CHO cells transfected with the indicated ASIC isoforms. The indicated time points are relative to the 40-s application of 1 mM NaHS. All quantified currents had been normalized to that induced by acid before the NaHS treatment (at −3 and −6 min). The statistical significance in (B), (D), (F), and (G) is based in each case on a comparison between treatment and control over the period 0–60 min by one-way ANOVA test and Dunnett’s post hoc test; ***P < 0.001. (A) Representative rat ASIC1b current traces, induced by acidification to pH 6.3 at different time points, as indicated. (B) Time course of pH 6.3-induced peak ASIC1b current amplitudes measured without (control, black symbols) or with a 40-s exposure to 1 mM NaHS as indicated (treatment, red symbols), n = 5. (C) Representative human ASIC2a current traces, induced by acidification to pH 5.0. (D) Time course of pH 5.0-induced ASIC2a peak current amplitudes measured without (control, black symbols) or with a 40-s exposure to 1mM NaHS as indicated (treatment, red symbols), n = 5–6. (E) Representative rat ASIC3 current traces, induced by acidification to pH 6.8 at different time points, as indicated. (F) Time course of pH 6.8-induced ASIC3 peak current amplitudes measured without (black symbols) or with a 40-s exposure to 1 mM NaHS as indicated (red symbols), n = 5–6. (G) Time course of pH 6.8-induced ASIC3 sustained current amplitudes measured without (black symbols) or with a 40-s exposure to 1 mM NaHS (green symbols) as indicated, n = 5–6.
Figure 3.
Figure 3.
NaHS Potentiation of ASIC1a Currents Is Not Due to a Change in pH Dependence. (A) Schematic representation of the protocol used to test whether the exposure to 1 mM NaHS induces a shift in the pH dependence of ASIC1a expressed in CHO cells. (B and C) Representative ASIC1a current traces for the construction of a pH–response curve. Fifteen minutes before starting the recording of the pH-response curve, the cell was exposed during 40 s to a control solution (B, “control”) or to a solution containing 1mM NaHS (C, “treatment”). (D) ASIC1a peak current amplitudes, normalized to the peak amplitude induced by pH 5.0, for cells exposed to 1 mM NaHS (treatment, red) or not (control, green), n = 5–9. The solid lines represent a fit to the Hill equation. The pH50 values were not different between the two conditions (unpaired Student’s t-test). (E) Time course of the pH 6.7-induced current of CHO cells expressing a mutant ASIC1a in which the intracellular C-terminal Cys residues were mutated or deleted (ASIC1a-C466A-C471A-C497A-C528stop, ASIC1a-ΔCCt), measured without (control, black symbols) or with a 40-s exposure to 1 mM NaHS at time point 0, as indicated (treatment, red symbols), n = 4–6. ***P < 0.001, comparison between treatment and control over the period 0–60 min by one-way ANOVA test and Dunnett’s post hoc test. Current amplitudes were normalized to the pH 6.7-induced current amplitude measured before NaHS exposure (at −3 and −6 min).
Figure 4.
Figure 4.
H2S Donors Potentiate Endogenous ASIC Currents in Cultured Mouse Hypothalamus Neurons. The currents were measured by whole-cell voltage-clamp at −60 mV from cultured hypothalamus neurons of mice. The bars and error bars indicate mean±SEM. Together with each treatment condition, a number of control cells (ie, treatment protocol with solution lacking the H2S donor) were measured, and the current amplitudes obtained for the treatment and for the respective control were normalized to the average of the control. (A and B) Cells were exposed for 1 min to NaHS and then put back into the incubator for a defined period before the current measurement. (A) pH 6.6-induced current amplitudes measured 1 h after exposure to the indicated NaHS concentration (treatment, blue) or to control solution without NaHS (control, black), n = 5–8. B, pH 6.6-induced current amplitudes measured at the indicated time after a 1-min 100 µM NaHS (blue symbols) or control exposure (black symbols), n = 6–9. (C and D) The H2S donor GYY4137 at the indicated final concentrations was added to the culture medium, and cells were incubated in the cell incubator for the indicated period. (C) pH 6.6-induced current amplitudes measured after 1 h incubation with the indicated concentration of GYY4137 (treatment, blue) or with the addition of solution lacking GYY4137 (control, black), n = 7–9. (D) pH 6.6-induced current amplitudes measured after incubation for the indicated time with 10 µM GYY4137 (treatment, blue) or with solution lacking GYY4137 (control, black), n = 8–10. *P < 0.05; **P < 0.01; ***P < 0.001; comparison of each treatment condition with the corresponding control condition by unpaired multiple Mann–Whitney tests.
Figure 5.
Figure 5.
H2S Donors Regulate the Expression of ASIC1a and the Activation of the Erk1/2 Signaling Pathway. The biochemical experiments were carried out in cultured mouse cortical neurons. Total and plasma membrane proteins were isolated, separated on SDS-PAGE, and specific proteins were visualized as described in the “Materials and Methods” section. (A) Representative Western blots of total and plasma membrane ASIC1a, and Erk1/2, p-Erk1/2, Na+/K+ATPase, and β-actin as indicated, after incubation with 10 µM GYY4137 (GYY) or without (Ctrl) for the indicated time. β-actin was used as a control for the total protein, and Na+/K+ ATPase α1 as a control for plasma membrane proteins. The β-actin and Na+/K+ ATPase bands shown in (A) were from the same sample, but not in all cases from the same lane on the gel, as the bands shown above or below. (B–E) Cells were exposed to 10 µM GYY4137 (GYY, blue symbols) or to control medium (control, black symbols) for the indicated time. The measured intensities were normalized to the average intensity of the corresponding control. (B) Total expression of ASIC1a, n = 4–5. (C) Plasma membrane expression of ASIC1a, n = 4–5. (D) Expression of Erk1/2, n = 4–5. (E) Expression of p-Erk1/2, n = 4–5. *P < 0.05; **P < 0.01; comparison of each treatment condition with the corresponding control condition by multiple Mann–Whitney tests.
Figure 6.
Figure 6.
The p38 and JNK Signaling Pathways Are Not Involved in the Upregulation of ASIC1a Expression by H2S Donors. The biochemical experiments were carried out in cultured mouse cortical neurons. Total proteins were isolated, separated on SDS-PAGE, and specific proteins were visualized as described in the “Materials and Methods” section. (A) Representative Western blots of total JNK, p-JNK, p38, p-p38, and β-actin as indicated, after incubation with 10 µM GYY4137 (GYY) or without (Ctrl) for the indicated times. β-actin was used as control. The β-actin bands shown in (A) were from the same sample, but not in all cases from the same lane on the gel, as the bands shown above. (B–E) Cells were exposed to 10 µM GYY4137 (GYY, blue symbols) or to control medium (control, black symbols) for the indicated time. The measured intensities were normalized to the average intensity of the corresponding control. (B) Expression of JNK, n = 4–5. (C) Expression of p-JNK, n = 4–5. (D) Expression of p38, n = 4–5. (E) Expression of p-p38, n = 4–5. Comparison of each treatment condition with the corresponding control condition by multiple Mann–Whitney tests indicated no significant differences
Figure 7.
Figure 7.
H2S Donors Upregulate ASIC1a Expression via the MAPK Signaling Pathway. The biochemical experiments were carried out in cultured mouse cortical neurons. Total and plasma membrane proteins were isolated, separated on SDS-PAGE, and specific proteins were visualized as described in “Materials and Methods” section. (A) Representative Western blots of total and plasma membrane ASIC1a, and of Erk1/2, p-Erk1/2, Na+/K+ATPase, and β-actin after incubation for the indicated times with the MAPK pathway inhibitor PD98059 at a concentration of 25 µM, alone or together with the H2S donor GYY4137 at 10 µM. β-actin was used as a control for the total protein, and Na+/K+ ATPase α1 as a control for plasma membrane proteins. The β-actin and Na+/K+ ATPase bands shown in (A) were from the same sample, but not in all cases from the same lane on the gel, as the bands shown above or below. (B–E) The quantification of the bands and normalization of the signals was carried out as described in the legend to Figure 5. (B–F) Cells were exposed during the indicated times with 25 µM PD98059 (PD, black symbols) or with 25 µM PD98059 and 10 µM GYY4137 (GYY+PD, blue symbols). Comparison of the conditions by multiple Mann–Whitney tests did not reveal any significant difference. (B) Total ASIC1a expression, n = 4–5. (C) Plasma membrane ASIC1a expression, n = 4–5. (D) Erk1/2 expression, n = 4–5. (E) p-Erk1/2 expression, n = 4–5. (F and G) The current measurements were carried out in cultured hypothalamus neurons, as described in the legend to Figure 4. (F) pH 6.6-induced current amplitudes measured at the indicated times after the start of incubation with 25 µM PD98059 (PD, black) or with 25 µM PD98059 and 10 µM GYY4137 (GYY+PD, blue), n = 5–9. Together with each treatment condition, a number of control cells (ie, treatment protocol with solution lacking the H2S donor) were measured, and the current amplitudes obtained for the treatment and for the respective control were normalized to the average of the control. (G) pH 6.6-induced current amplitudes in cultured hypothalamus neurons obtained 24 h after the start of the incubation at the four following conditions: Control (culture medium), GYY (10 µM GYY4137), GYY+PD (25 µM PD98059 and 10 µM GYY4137), PD (25 µM PD98059), n = 7–8. *P < 0.05; **P < 0.01, between conditions, by one-way ANOVA test and Dunnett’s post hoc test. The current amplitudes were normalized to the mean amplitude of the control condition.

Comment in

Similar articles

Cited by

References

    1. Waldmann R, Champigny G, Bassilana F, Heurteaux C, Lazdunski M.. A proton-gated cation channel involved in acid-sensing. Nature 1997;386 (6621):173–177. - PubMed
    1. Wemmie JA, Taugher RJ, Kreple CJ.. Acid-sensing ion channels in pain and disease. Nat Rev Neurosci 2013;14(7):461–471. - PMC - PubMed
    1. Kellenberger S, Schild L.. Epithelial sodium channel/degenerin family of ion channels: a variety of functions for a shared structure. Physiol Rev 2002;82 (3):735–767. - PubMed
    1. Yang L, Palmer LG.. Ion conduction and selectivity in acid-sensing ion channel 1. J Gen Physiol 2014;144 (3):245–255. - PMC - PubMed
    1. Bassler EL, Ngo-Anh TJ, Geisler HS, Ruppersberg JP, Grunder S.. Molecular and functional characterization of acid-sensing ion channel (ASIC) 1b. J Biol Chem 2001;276(36):33782–33787. - PubMed

Publication types

LinkOut - more resources