. 2021 Jan 28;2(2):zqab005.
doi: 10.1093/function/zqab005. eCollection 2021.

Mitochondrial P2X7 Receptor Localization Modulates Energy Metabolism Enhancing Physical Performance

Affiliations

Mitochondrial P2X7 Receptor Localization Modulates Energy Metabolism Enhancing Physical Performance

Alba Clara Sarti et al. Function (Oxf). .

Erratum in

Abstract

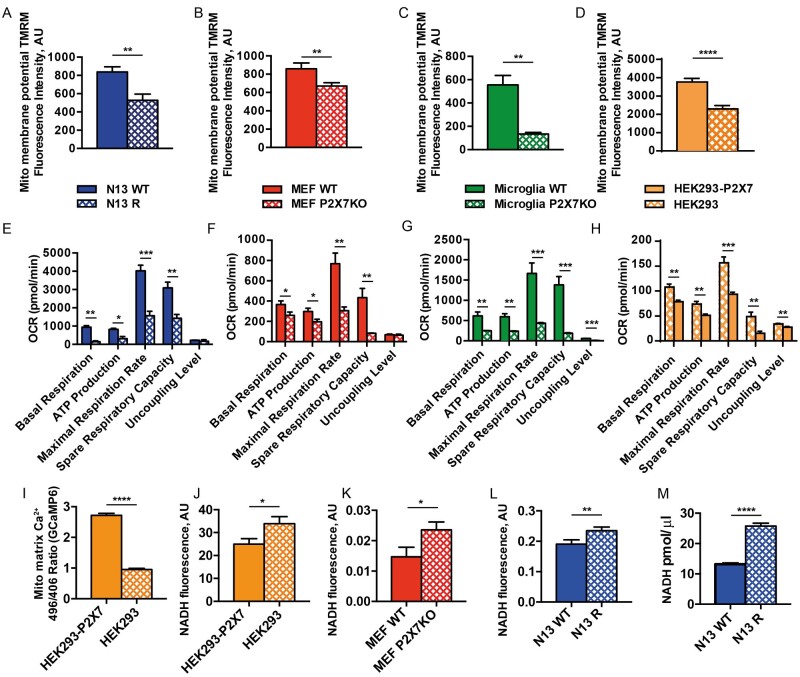
Basal expression of the P2X7 receptor (P2X7R) improves mitochondrial metabolism, Adenosine 5'-triphosphate (ATP) synthesis, and overall fitness of immune and non-immune cells. We investigated P2X7R contribution to energy metabolism and subcellular localization in fibroblasts (mouse embryo fibroblasts and HEK293 human fibroblasts), mouse microglia (primary brain microglia, and the N13 microglia cell line), and heart tissue. The P2X7R localizes to mitochondria, and its lack (1) decreases basal respiratory rate, ATP-coupled respiration, maximal uncoupled respiration, resting mitochondrial potential, mitochondrial matrix Ca2+ level, (2) modifies expression pattern of oxidative phosphorylation enzymes, and (3) severely affects cardiac performance. Hearts from P2rx7-deleted versus wild-type mice are larger, heart mitochondria smaller, and stroke volume, ejection fraction, fractional shortening, and cardiac output, are significantly decreased. Accordingly, the physical fitness of P2X7R-null mice is severely reduced. Thus, the P2X7R is a key modulator of mitochondrial energy metabolism and a determinant of physical fitness.

Keywords: P2X7; dilated cardiomyopathy; extracellular ATP; mitochondria; oxidative phosphorylation; purinergic signaling; respiratory chain.


Figures

Graphical Abstract
Graphical Abstract
Figure 1.
Figure 1.
Lack of the P2X7R Impairs Mitochondrial Potential, Oxygen Consumption, Calcium Level and Causes Intra-Mitochondrial NADH Accumulation. Cells, plated on 12-mm glass coverlips (A–D), were loaded with TMRM (20 nM) at 37°C for 20 min in KRB buffer. Fluorescence was measured with a Zeiss LS510 confocal microscope. Images were then analyzed with ImageJ software. Mitochondrial membrane potential (Ψm) was expressed as the ratio between TMRM fluorescence (in arbitrary units [AUs]) before and after FCCP addition. Exact fluorescence AU values: N13 WT (average ± SEM = 838.5 ± 55.96, n = 13) or N13 R (average ± SEM = 527.9 ± 66.60, n = 14) (A); MEFs WT (average ± SEM = 886.6 ± 59.86; n = 31) or MEFs P2X7-KO (average ± SEM =  671.5 ± 35.49, n = 43) (B); primary WT microglia (average ± SEM = 551.1 ± 81.53, n = 20) or primary P2X7-KO microglia (average ± SEM = 134.0 ± 13.69, n = 8) (C); HEK293-P2X7 (average ± SEM = 3769 ± 191.0, n =47) or HEK293 (average ± SEM = 2296 ± 187.7, n = 45) (D). Alternatively, cells were plated in XF96 96-well cell culture plate (E–H) and analyzed for oxygen consumption in a Seahorse apparatus. Exact averages ± SEM for Panels E–H are shown in Supplementary data, Table S1. OCR was normalized on cell content. Data are presented as average ± SEM of n = 3 for Panels E–G and n = 7 for Panel H. HEK293-P2X7R (average arbitrary fluorescence units ± SEM = 2717 ± 0.069, n = 57) or HEK293 (average arbitrary fluorescence units ± SEM = 0.95 ± 0.039, n = 58) cells were transfected with the mitochondrial-selective FRET-based, GCaMP fluorescent Ca2+ indicator (I), or analyzed for NADH autofluorescence with a fluorescence microscope (average arbitrary fluorescence units ± SEM, HEK293-P2X7R = 23.33 ± 2.07, n = 25; HEK293 = 31.31 ± 2.92, n = 31) (J). MEFs WT (average arbitrary fluorescence units ± SEM = 0.015 ± 0.002, n =  11) or MEFs P2X7R-KO (average arbitrary fluorescence units ± SEM = 0.026 ± 0.002, n = 23) (K), and N13 WT (average arbitrary fluorescence units ± SEM = 0.19 ± 0.01, n = 24) or N13 R (average arbitrary fluorescence units ± SEM = 0.23 ± 0.01, n = 37) (L), were also analyzed for NADH fluorescence. Fluorescence emission was acquired with an IX-81 Olympus automated epifluorescence microscope as described in Materials and Methods. Intracellular content (pmol/μL) of NADH for N13 WT (average ± SEM = 13.18 ± 0.25, n = 3) and N13 R (average ± SEM = 25.80 ± 0.39, n = 3) (i) was also measured with a NAD/NADH Assay Kit, as described in Methods. P-values are calculated with the two-tailed unpaired Student’s t-test; *P < 0.05; **P < 0.01; ***P < 0.001; ****P < 0.0001.
Figure 2.
Figure 2.
Lack of the P2X7R Decreases Complex 1 Content of Mitochondrial Respiratory Chain and Compromises Physiological Responses of Cells. Densitometry (A, C) and Western Blot (B, D) for respiratory chain complexes (OXPHOS) from HEK293 or HEK293-P2X7R, and N13 WT or N13 R cells is shown. Average absorbance (AU) ± SEM for HEK293-P2X7 = 0.389 ± 0.0141, n = 3; HEK293 = 0.1886 ± 0.059, n = 3; N13 R = 0.301 ± 0.0018, n = 3; N13 WT = 0.712 ± 0.039, n = 3. Ten micrograms of protein was loaded in each lane. Scratch wound assay in N13 WT or N13 R culture (E). Cells were grown in 24-well plates and the wounds were made with a sterilized one-milliliter pipette tip at the same time in all wells at 80% confluence. Wound width (F) was measured with Image J at time 0 (T0) and after 24 h (T24). Average ± SEM wound width at T24 as a percentage at T0 was 42.67 ± 5.28, n = 5, for N13 WT, and 57.11 ± 2.269, n = 5, for N13 R. In the presence of 2.5 mM methylsuccinate wound width at T24 was 35.90 ± 2.39 for N13 R, and 40.14 ± 5.64, n = 5, for N13 WT. Mitochondrial potential in the absence or presence of 2.5 mM methyl succinate was measured by TMRM fluorescence with an epifluorescence microscope (average arbitrary fluorescence units ± SEM, N13 R basal 1075 ± 16.19, n = 35, versus N13 R + methylsuccinate 1265 ± 29.35, n = 35) (G). Oxygen radical production in the absence or presence of 2.5 mM methyl succinate was measured by 2′,7′-dichlorodihydrofluorescein (DCFDA) with a Tali image-based cytometer (average fluorescence AUs ± SEM for N13 WT basal 1795 ± 68.67, n = 438; N13 R basal 1184 ± 34.20, n = 347); N13 WT + methylsuccinate 2854 ± 111.7, n = 439; N13 R + methylsuccinate 1933 ± 41.26, n = 383) (H), as described in Materials and Methods. P-values are calculated with the two-tailed unpaired Student’s t-test. *P < 0.05; **P < 0.01; ***P < 0.001; ****P < 0.0001.
Figure 3.
Figure 3.
The P2X7R Localizes to the Mitochondria. Western Blot analysis of lysates (10 μg of protein/lane) from whole cells (H), a crude MF or a HMF. Cytosolic fraction (C) was loaded as control. Cell fractionation was performed as described in Materials and Methods. IP3R3, β-tubulin, and mitochondrial calcium uniporter (MCU) were used as markers of ER, cytosol, and mitochondria, respectively.
Figure 4.
Figure 4.
The P2X7R Localizes to the Outer Mitochondrial Membrane. Western Blot analysis of a HMF from HEK293-P2X7R or N13 WT exposed to PK (100 μg/mL) in iso- (IsoM) or hypo- (HypoM) osmotic buffer and stained with antibodies raised against the extracellular (A, B), the C-terminal (C, D) or N-terminal (E, F) domains of the P2X7 subunit. H, whole-cell lysate; IsoM+PK, MF incubated in iso-osmotic medium-plus PK; HypoM+PK, MF incubated in hypo-osmotic medium plus PK. Trit+PK, MF incubated in Triton-X100-supplemented medium-plus PK. Hsp60, TIM23, and TOM20 were used as markers of mitochondrial matrix, inner and outer mitochondrial membrane, respectively.
Figure 5.
Figure 5.
Confocal Microscopy Analysis of P2X7R Localization. HEK293-P2X7R cells were plated on sterilized glass coverslips in 24-well plate, at a density of 5000 cells/well in DMEM-F12 medium, and left either untreated (A), or challenged with BzATP (B, E), rotenone (C, F) or H2O2 (D, G). After 1 h (BzATP or rotenone) or 10 min (H2O2) cells were fixed and stained with anti TOM20 (green) and anti P2X7R (fuchsia) antibodies. A magnification of the selected region is shown in the inset. Areas of co-localization (yellow arrow) are shown in white. Ten random fields from three independent experiments were analyzed. Graphs (E -G) report quantitation of P2X7R/mitochondria localization with the Manders colocalization coefficient (expressed as percentage of P2X7R signal overlapping with TOM20 marker). Scale bar = 10 μm. Total P2X7R content by Western Blot under the different experimental conditions and at different time points is shown in (H). Exact averages ± SEM for Panels E–G are shown in Supplementary data, Table S2. P-values are calculated with the two-tailed unpaired Student’s t-test. *P < 0.05; **P < 0.01; ***P < 0.001.
Figure 6.
Figure 6.
Lack of the P2X7R Impairs Cardiac Function. Purified heart MFs and HMFs (see Materials and Methods) from WT (A) or P2X7R-KO (B) C57BL/6 mice were analyzed for P2X7R expression by Western Blot. Hsp60, TIM23, and mitochondrial calcium uptake protein 2 (MICU2) were used as markers of mitochondrial matrix, inner or outer mitochondrial membrane, respectively. Excised whole hearts from P2X7R WT (average weight g ±  SEM = 0.1935 ± 0.005343, n = 6) or P2X7R-KO (average weight g ± SEM = 0.1965 ± 0.01169, n = 6) mice were weighed (C), measured by caliper to assess volume (average volume mm3 ± SEM P2X7R WT = 176.5 ± 21.20, n = 6; average volume mm3 ± SEM P2X7R-KO = 261.3 ± 9.229, n = 6) (D), and analyzed by TEM (E–G). Mitochondrial area (μm2) is expressed as average ± SEM for WT (0.1059 ± 0.002917, n = 289) versus P2X7-KO (0.08657 ± 0.003239, n = 253) (G). In vivo heart indexes were measured with the High-frequency Ultrasound imaging system (see Materials and Methods) shown in (H). Vols (I); Vold (J); SV (K); FS (L); EF (M); CO (N). Heart rate was 399±17 and 375±16 for WT and P2X7R-KO mice, respectively. Data are presented as average ± SEM of n = 16 mice for condition; *P < 0.05; **P < 0.01; ***P < 0.001; ****P < 0.0001.
Figure 7.
Figure 7.
Lack of the P2X7R Reduces Physical Fitness and Surface Body Temperature. Physical fitness (A) of C57Bl/6 P2X7 WT and KO mice was investigated in a standard rotarod test by measuring time (s) spent on the wheel, as described in Materials and Methods. Data are presented as average ± SEM for WT (803.3 ± 44.74, n = 6) and P2X7R-KO mice (659.3 ± 34.45, n = 6). For body temperature measurement (B, C), WT and P2X7R-KO mice were placed on a warm surface in a 22°C heated room, and body images were acquired and measured with a Thermacam P25 Infrared Camera. Representative thermal images from one WT (right) and one P2X7R-KO (left) mouse from dorsal or ventral view (B). Each temperature measurement was performed in triplicate in a total of seven mice for condition. Data are presented as average °C ± SEM for P2X7R-KO (33.37 ± 0.2607, n = 7) and WT (34.4 ± 0.226, n = 7) mice. P-values are calculated with the two-tailed unpaired Student’s t-test. *P < 0.05.

Comment in

References

    1. Burnstock G. Purinergic signalling: from discovery to current developments. Exp Physiol 2014;99(1):16–34. doi:10.1113/expphysiol.2013.071951 - DOI - PMC - PubMed
    1. Bours MJ, Swennen EL, Di Virgilio F, Cronstein BN, Dagnelie PC.. Adenosine 5'-triphosphate and adenosine as endogenous signaling molecules in immunity and inflammation. Pharmacol Ther 2006;112(2):358–404. doi:10.1016/j.pharmthera.2005.04.013 - DOI - PubMed
    1. Bours MJ, Dagnelie PC, Giuliani AL, Wesselius A, Di Virgilio F.. P2 receptors and extracellular ATP: a novel homeostatic pathway in inflammation. Front Biosci 2011;3:1443–1456. doi:10.2741/235 - DOI - PubMed
    1. Burnstock G. Pathophysiology and therapeutic potential of purinergic signaling. Pharmacol Rev 2006:58(1):58–86. doi:10.1124/pr.58.1.5 - DOI - PubMed
    1. Di Virgilio F, Dal Ben D, Sarti AC, Giuliani A L, Falzoni S.. The P2X7 receptor in infection and inflammation. Immunity 2017;47(1):15–31. doi:10.1016/j.immuni.2017.06.020 - DOI - PubMed

Publication types

Substances

LinkOut - more resources