. 2022 Mar 7:13:824476.
doi: 10.3389/fpls.2022.824476. eCollection 2022.

Elevated CO2 Improves the Physiology but Not the Final Yield in Spring Wheat Genotypes Subjected to Heat and Drought Stress During Anthesis

Affiliations

Elevated CO2 Improves the Physiology but Not the Final Yield in Spring Wheat Genotypes Subjected to Heat and Drought Stress During Anthesis

Lamis Osama Anwar Abdelhakim et al. Front Plant Sci. .

Abstract

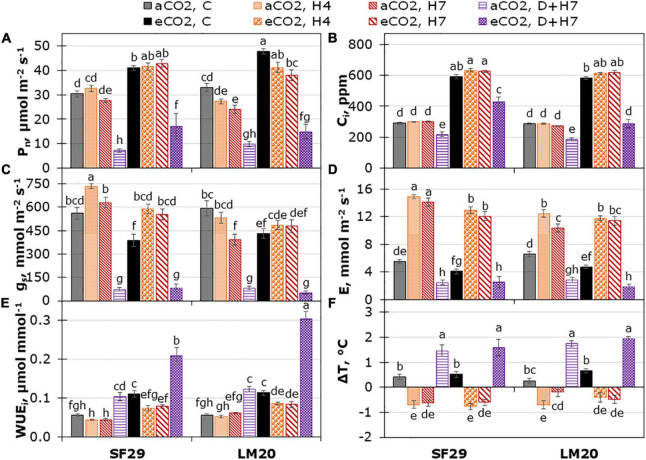
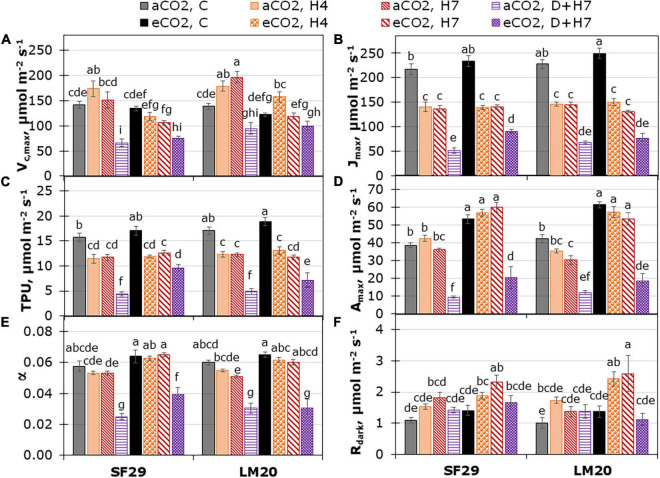
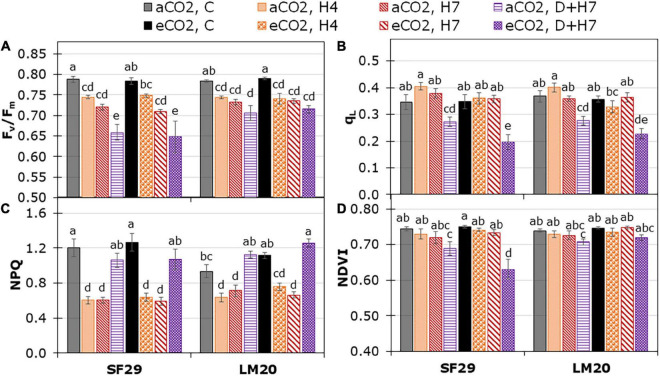
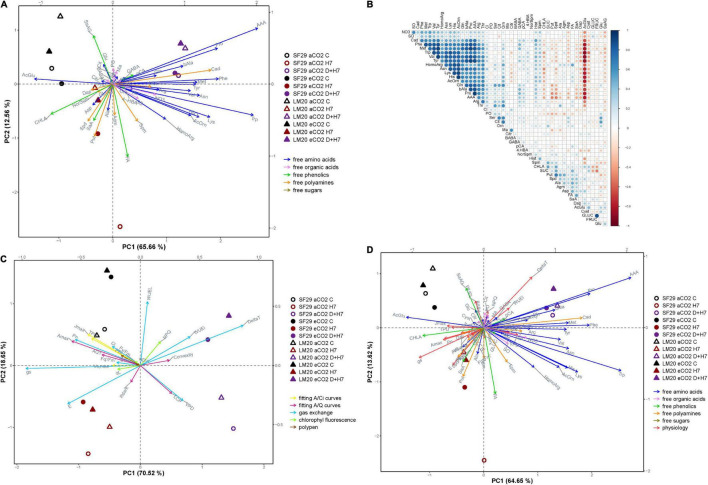
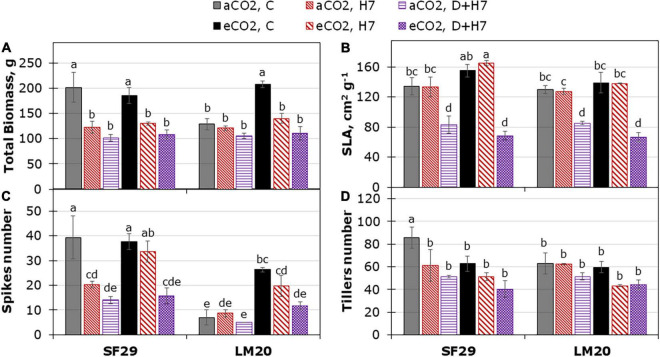
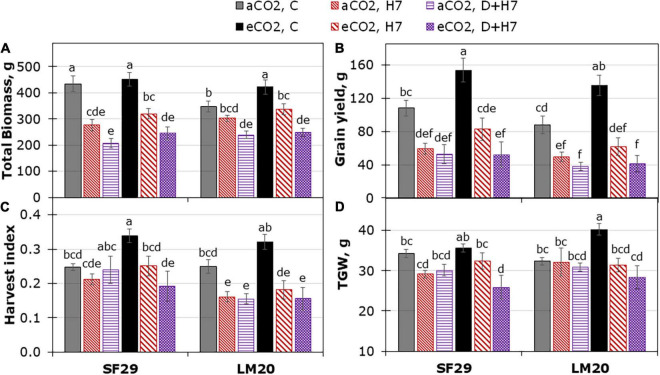
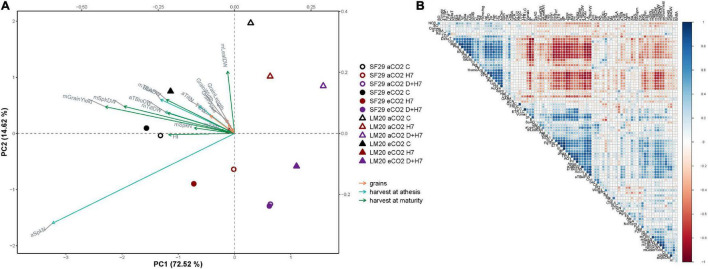
Heat and drought events often occur concurrently as a consequence of climate change and have a severe impact on crop growth and yield. Besides, the accumulative increase in the atmospheric CO2 level is expected to be doubled by the end of this century. It is essential to understand the consequences of climate change combined with the CO2 levels on relevant crops such as wheat. This study evaluated the physiology and metabolite changes and grain yield in heat-sensitive (SF29) and heat-tolerant (LM20) wheat genotypes under individual heat stress or combined with drought applied during anthesis at ambient (aCO2) and elevated CO2 (eCO2) levels. Both genotypes enhanced similarly the WUE under combined stresses at eCO2. However, this increase was due to different stress responses, whereas eCO2 improved the tolerance in heat-sensitive SF29 by enhancing the gas exchange parameters, and the accumulation of compatible solutes included glucose, fructose, β-alanine, and GABA to keep water balance; the heat-tolerant LM20 improved the accumulation of phosphate and sulfate and reduced the lysine metabolism and other metabolites including N-acetylornithine. These changes did not help the plants to improve the final yield under combined stresses at eCO2. Under non-stress conditions, eCO2 improved the yield of both genotypes. However, the response differed among genotypes, most probably as a consequence of the eCO2-induced changes in glucose and fructose at anthesis. Whereas the less-productive genotype LM20 reduced the glucose and fructose and increased the grain dimension as the effect of the eCO2 application, the most productive genotype SF29 increased the two carbohydrate contents and ended with higher weight in the spikes. Altogether, these findings showed that the eCO2 improves the tolerance to combined heat and drought stress but not the yield in spring wheat under stress conditions through different mechanisms. However, under non-stress conditions, it could improve mainly the yield to the less-productive genotypes. Altogether, the results demonstrated that more studies focused on the combination of abiotic stress are needed to understand better the spring wheat responses that help the identification of genotypes more resilient and productive under these conditions for future climate conditions.

Keywords: chlorophyll fluorescence; elevated CO2; gas exchange; grain yield; heat stress; targeted metabolomic analysis; wheat.


Conflict of interest statement

The authors declare that the research was conducted in the absence of any commercial or financial relationships that could be construed as a potential conflict of interest. The reviewer PC declared a shared affiliation with one of the authors ER to the handling editor at the time of the review.

Figures

FIGURE 1
FIGURE 1
Leaf gas exchange measured at PPFD of 2,000 μmol m– 2 s– 1. (A) Net photosynthetic rate (Pn), (B) intercellular CO2 (Ci), (C) stomatal conductance (gs), (D) transpiration rate (E), (E) intrinsic water use efficiency (WUEi), and (F) difference between leaf and air cuvette temperature (ΔT) in heat-sensitive (SF29) and heat-tolerant (LM20) genotypes grown under control conditions (C), heat stress at Day 4 (H4), at Day 7 (H7), and combined heat stress and drought at Day 7 (D + H7) at ambient CO2 (aCO2) or elevated CO2 (eCO2). The data represent mean values ± standard error (S.E.) (n = 6–8). Different small letters indicate significant differences within variants according to Duncan’s test after ANOVA (p < 0.05).
FIGURE 2
FIGURE 2
Fitted parameters normalized at 25°C from CO2 assimilation response curves; (A) Carboxylation rate by Rubisco (Vc,max), (B) rate of photosynthetic electron transport (Jmax), (C) triose-phosphate utilization (TPU) and from light response curves; (D) maximum net CO2 assimilation rate at light saturation (Amax), (E) apparent quantum yield of CO2 assimilation (α) and (F) dark respiration rate (Rdark) in heat-sensitive (SF29) and heat-tolerant (LM20) genotypes grown under control conditions (C), heat stress at Day 4 (H4), at Day 7 (H7), and combined heat stress and drought at Day 7 (D + H7) at ambient CO2 (aCO2) or elevated CO2 (eCO2). The data represent mean values ± standard error (S.E.) (n = 6–8). Different small letters indicate significant differences within variants according to Duncan’s test after ANOVA (p < 0.05).
FIGURE 3
FIGURE 3
Chlorophyll fluorescence parameters; (A) the maximum quantum efficiency of PSII (Fv/Fm) on dark-adapted leaves, (B) fraction of open PSII centers (qL) and (C) non-photochemical quenching (NPQ), and the leaf reflectance represented as (D) normalized difference vegetation index (NDVI) in heat-sensitive (SF29) and heat-tolerant (LM20) genotypes grown under control conditions (C), heat stress at Day 4 (H4), at day D (H7), and combined heat stress and drought at Day 7 (D + H7) at ambient CO2 (aCO2) or elevated CO2 (eCO2). The data represent mean values ± standard error (S.E.) (n = 6–8). Different small letters indicate significant differences within variants according to Duncan’s test after ANOVA (p < 0.05).
FIGURE 4
FIGURE 4
Multivariate statistical analyses of primary and secondary metabolites and plant physiology at the anthesis stage. (A) Principal component (PC) analysis of the changes in primary and secondary metabolites; free amino acids, organic acids, phenolics, free polyamines, and carbohydrates represented in blue, pink, green, orange, and brown arrows, respectively, (B) correlation matrix among all metabolites, in which the size and intensity of blue (positive) and red (negative) circles correlated with the Pearson’s square-R correlation number, (C) PC analysis of the changes in the physiological parameters, and (D) PC analysis of the metabolites and physiological parameters together in heat-sensitive (SF29) and heat-tolerant (LM20) genotypes grown under control conditions (C), heat stress at Day 4 (H4), at Day 7 (H7), and combined heat stress and drought at Day 7 (D + H7) at ambient CO2 (aCO2) or elevated CO2 (eCO2). The X-axis and Y-axis represent the PC1 and PC2, respectively, with the percentage of the total variance of the model.
FIGURE 5
FIGURE 5
Yield-related traits from destructive harvest during the anthesis stage. (A) Total biomass dry weight, (B) specific leaf area (SLA), and the number of (C) spikes and (D) tillers per plant in heat-sensitive (SF29) and heat-tolerant (LM20) genotypes grown under control conditions (C), heat stress at Day 4 (H4), at Day 7 (H7), and combined heat stress and drought at Day 7 (D + H7) at ambient CO2 (aCO2) or elevated CO2 (eCO2). The data represent mean values ± standard error (S.E.) (n = 3). Different small letters indicate significant differences within variants according to Duncan’s test after ANOVA (p < 0.05).
FIGURE 6
FIGURE 6
Yield-related traits during the ripening stage. (A) Total biomass (DW), (B) grain yield (C) harvest index, and (D) thousand-grain weight (TGW) per plant in heat-sensitive (SF29) and heat-tolerant (LM20) genotypes grown under control conditions (C), heat stress at Day 7 (H7) and combined heat stress and drought at Day 7 (D + H7) at ambient CO2 (aCO2) or elevated CO2 (eCO2). The data represent mean values ± S.E. (n = 8). Different small letters indicate significant differences within variants according to Duncan’s test after ANOVA (p < 0.05).
FIGURE 7
FIGURE 7
Multivariate statistical analyses of yield-related parameters. (A) Principal component (PC) analysis of the changes in yield-related parameters represented grain yield, the harvest at the anthesis and the ripening stage in orange, blue, and green arrows, respectively, and (B) correlation matrix between the metabolites and physiological and yield-related parameters, in which the size and intensity of blue (positive) and red (negative) circles correlated with the Pearson’s square-R correlation number in heat-sensitive (SF29) and heat-tolerant (LM20) genotypes grown under control conditions (C), heat stress at Day 7 (H7) and combined heat stress and drought at Day 7 (D + H7) at ambient CO2 (aCO2) or elevated CO2 (eCO2). The X-axis and Y-axis represent the PC1 and PC2, respectively, with the percentage of the total variance of the model.

Similar articles

Cited by

References

    1. Abdelhakim L. O. A., Palma C. F. F., Zhou R., Wollenweber B., Ottosen C. O., Rosenqvist E. (2021). The effect of individual and combined drought and heat stress under elevated CO2 on physiological responses in spring wheat genotypes. Plant Physiol. Biochem. 162 301–314. 10.1016/j.plaphy.2021.02.015 - DOI - PubMed
    1. Ahmed S. A. S., Zhang J., Farhan H., Zhang Y., Yu Z., Islam S., et al. (2020). Diurnal changes in water soluble carbohydrate components in leaves and sucrose associated TaSUT1 gene expression during grain development in wheat. Int. J. Mol. Sci. 21 1–21. 10.3390/ijms21218276 - DOI - PMC - PubMed
    1. Akter N., Islam M. R. (2017). Heat stress effects and management in wheat. a review. Agron. Sustain. Dev. 37:37.
    1. Amthor J. S. (2001). Effects of atmospheric CO2 concentration on wheat yield: review of results from experiments using various approaches to control CO2 concentration. Field Crop. Res. 73 1–34. 10.1016/s0378-4290(01)00179-4 - DOI
    1. Baker N. R. (2008). Chlorophyll fluorescence: a probe of photosynthesis in vivo. Annu. Rev. Plant Biol. 59 89–113. 10.1146/annurev.arplant.59.032607.092759 - DOI - PubMed

LinkOut - more resources