

Overexpressing PLOD Family Genes Predict Poor Prognosis in Pancreatic Cancer
- PMID: 35330878
- PMCID: PMC8938171
- DOI: 10.2147/IJGM.S341332
Overexpressing PLOD Family Genes Predict Poor Prognosis in Pancreatic Cancer
Abstract
Background: Pancreatic cancer is a common malignant tumor. Multiple studies have shown that procollagen lysyl-hydroxylase (PLOD) family genes were closely related to tumor progression and metastasis in a variety of human cancers. This study aimed to explore the prognosis and biological role of PLOD family genes in pancreatic adenocarcinoma (PAAD).
Methods: GEPIA, GEO, HPA, CCLE, Kaplan-Meier plotter, cBioPortal, LinkedOmics, DAVID6.8, STRING, and TIMER were employed to determine the prognostic values and biological function of PLOD family members in PAAD.
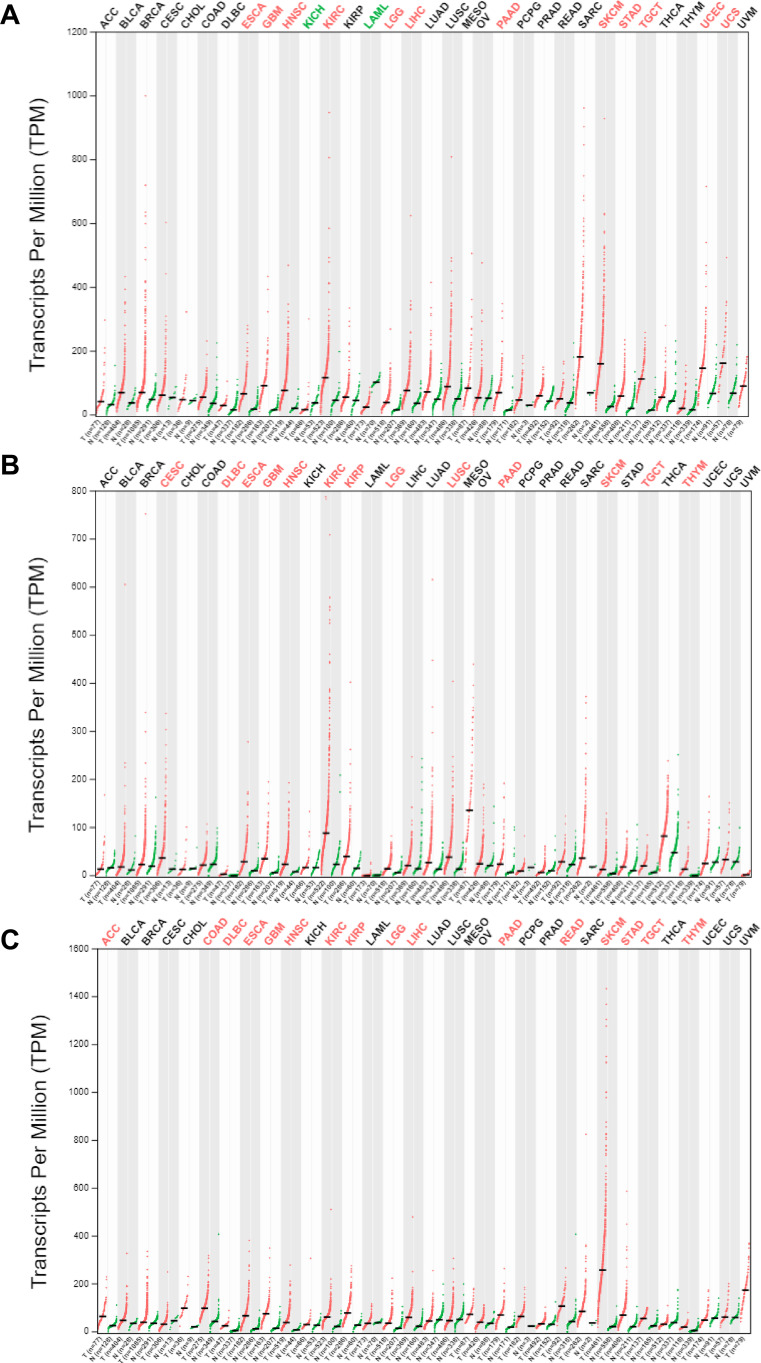
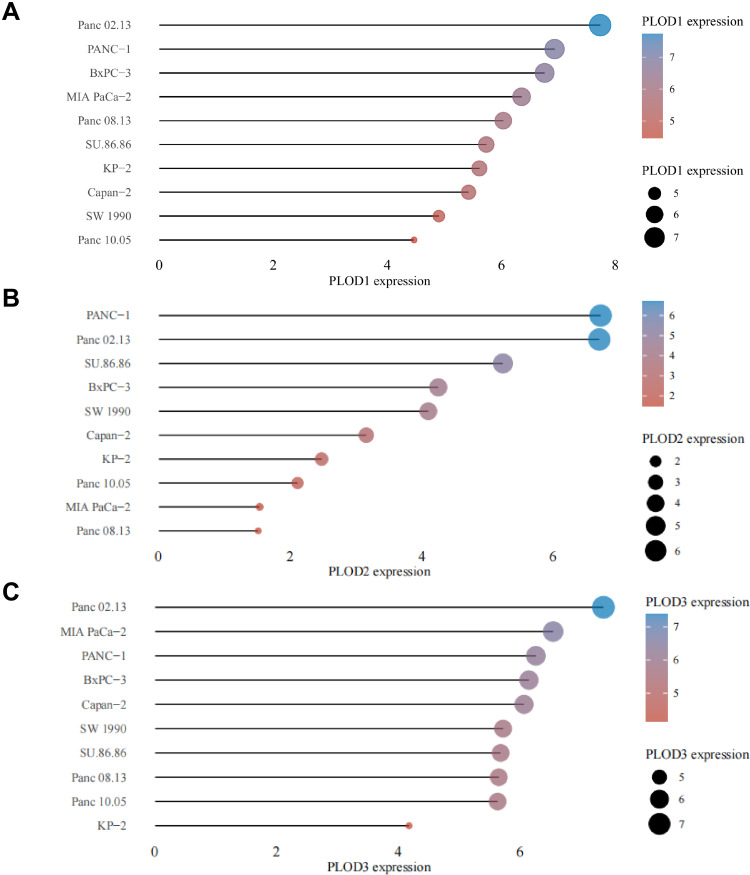
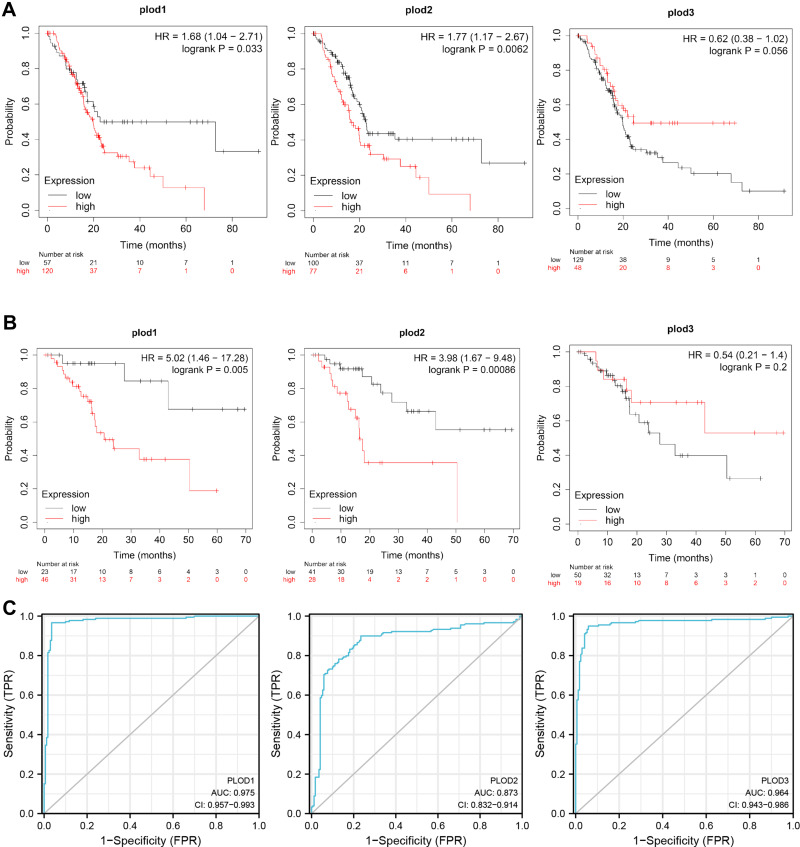
Results: The mRNA and protein expression patterns of PLOD family members were noticeably up-regulated in PAAD compared with normal tissues. PLOD family gene expression was also up-regulated in pancreatic cancer cell lines. PLOD1 was correlated with histological and pathological grades of pancreatic cancer. PLOD2 was related to histological grade. The high expression of PLOD1-2 was correlated with the poor overall survival rate and relapse-free survival rate in patients with PAAD. Additionally, PLODs showed high sensitivity and specificity in distinguishing pancreatic cancer from normal tissues. Through the functional enrichment analysis of PLOD-related genes in PAAD, we found that PLODs were enriched in collagen fiber tissue structure, lysine degradation, and collagen biosynthesis. Pathway analysis confirmed that PLODs regulated the proliferation, migration, and metastasis of pancreatic cancer through the RalGEF-Ral signaling pathway. Furthermore, the level of expression of PLOD1-2 was positively correlated with the activity of tumor-infiltrating immune cells, including CD8+T cells, neutrophils, macrophages, and dendritic cells. The level of expression of PLOD3 was inversely correlated with the level of infiltration of CD8+T cells. PLOD1 and PLOD2 were highly expressed in pancreatic cancer tissues with TP53 and KRAS mutations, respectively. However, the level of expression of PLOD3 in SMAD4 wild-type pancreatic cancer was increased.
Conclusion: The findings showed that individual PLOD genes or PLOD family genes could be potential prognostic biomarkers for PAAD.
Keywords: PLOD; mutations; pancreatic cancer; prognosis; tumor-infiltrating immune cells.
© 2022 Zhang et al.
Conflict of interest statement
The authors report no conflicts of interest in this work.
Figures


Similar articles
-
Comprehensive Analysis of the Expression, Prognosis, and Biological Significance of PLOD Family in Bladder Cancer.Int J Gen Med. 2023 Feb 24;16:707-722. doi: 10.2147/IJGM.S399875. eCollection 2023. Int J Gen Med. 2023. PMID: 36872941 Free PMC article.
-
Identification of PLOD Family Genes as Novel Prognostic Biomarkers for Hepatocellular Carcinoma.Front Oncol. 2020 Sep 4;10:1695. doi: 10.3389/fonc.2020.01695. eCollection 2020. Front Oncol. 2020. PMID: 33014843 Free PMC article.
-
Systematic characterization of the expression, prognosis and immune characteristics of PLOD family genes in breast cancer.Aging (Albany NY). 2024 Jul 26;16(14):11434-11445. doi: 10.18632/aging.206029. Epub 2024 Jul 26. Aging (Albany NY). 2024. PMID: 39068670 Free PMC article.
-
Roles of PLODs in Collagen Synthesis and Cancer Progression.Front Cell Dev Biol. 2018 Jun 28;6:66. doi: 10.3389/fcell.2018.00066. eCollection 2018. Front Cell Dev Biol. 2018. PMID: 30003082 Free PMC article. Review.
-
Identify potential prognostic indicators and tumor-infiltrating immune cells in pancreatic adenocarcinoma.Biosci Rep. 2022 Feb 25;42(2):BSR20212523. doi: 10.1042/BSR20212523. Biosci Rep. 2022. PMID: 35083488 Free PMC article. Review.
Cited by
-
Machine learning algorithm integrates bulk and single-cell transcriptome sequencing to reveal immune-related personalized therapy prediction features for pancreatic cancer.Aging (Albany NY). 2023 Dec 12;15(23):14109-14140. doi: 10.18632/aging.205293. Epub 2023 Dec 12. Aging (Albany NY). 2023. PMID: 38095640 Free PMC article.
-
Prognostic Model and Immune Infiltration of Ferroptosis Subcluster-Related Modular Genes in Gastric Cancer.J Oncol. 2022 Oct 13;2022:5813522. doi: 10.1155/2022/5813522. eCollection 2022. J Oncol. 2022. PMID: 36276279 Free PMC article.
-
Comprehensive Analysis of the Expression, Prognosis, and Biological Significance of PLOD Family in Bladder Cancer.Int J Gen Med. 2023 Feb 24;16:707-722. doi: 10.2147/IJGM.S399875. eCollection 2023. Int J Gen Med. 2023. PMID: 36872941 Free PMC article.
-
Lysyl hydroxylase LH1 promotes confined migration and metastasis of cancer cells by stabilizing Septin2 to enhance actin network.Mol Cancer. 2023 Jan 31;22(1):21. doi: 10.1186/s12943-023-01727-9. Mol Cancer. 2023. PMID: 36721170 Free PMC article.
-
PLOD Family: A Novel Biomarker for Prognosis and Personalized Treatment in Soft Tissue Sarcoma.Genes (Basel). 2022 Apr 28;13(5):787. doi: 10.3390/genes13050787. Genes (Basel). 2022. PMID: 35627171 Free PMC article.
References
LinkOut - more resources
Full Text Sources
Research Materials
Miscellaneous
