

In silico Analysis of Publicly Available Transcriptomics Data Identifies Putative Prognostic and Therapeutic Molecular Targets for Papillary Thyroid Carcinoma
- PMID: 35330879
- PMCID: PMC8939872
- DOI: 10.2147/IJGM.S345336
In silico Analysis of Publicly Available Transcriptomics Data Identifies Putative Prognostic and Therapeutic Molecular Targets for Papillary Thyroid Carcinoma
Abstract
Background: Thyroid cancer is the most common endocrine malignancy. However, the molecular mechanism involved in its pathogenesis is not well characterized.
Purpose: The objective of this study is to identify key cellular pathways and differentially expressed genes along the thyroid cancer pathogenesis sequence as well as to identify potential prognostic and therapeutic targets.
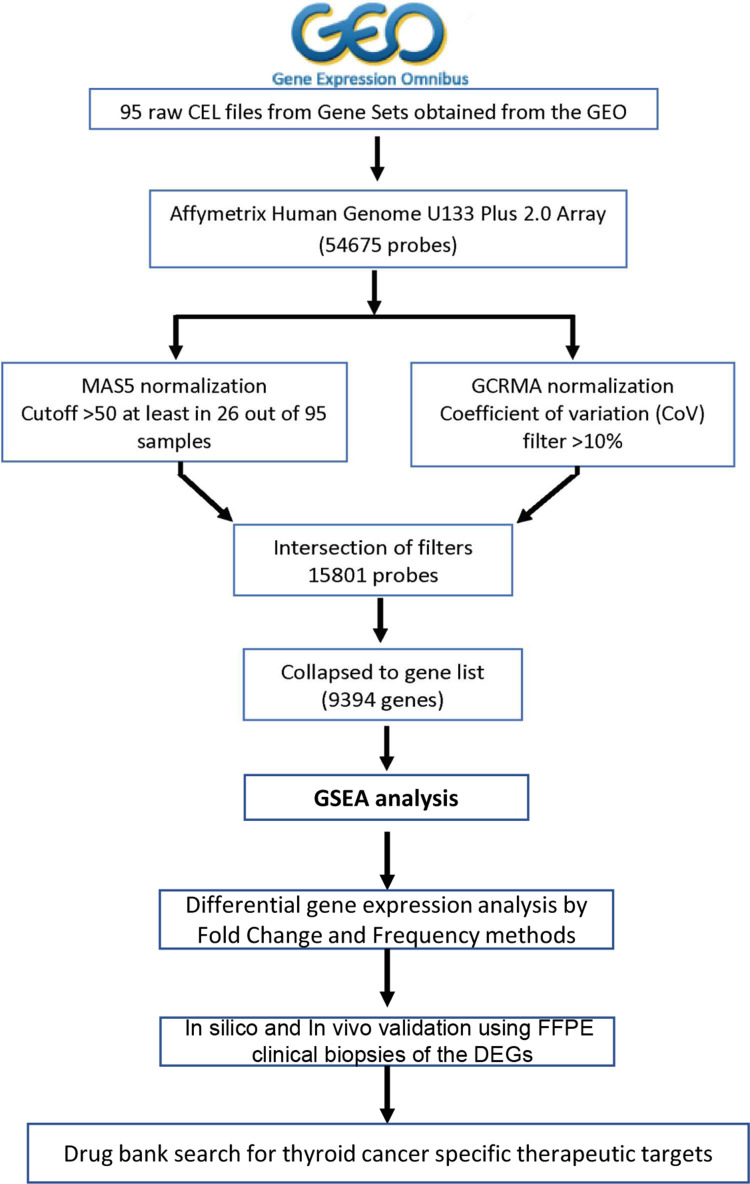
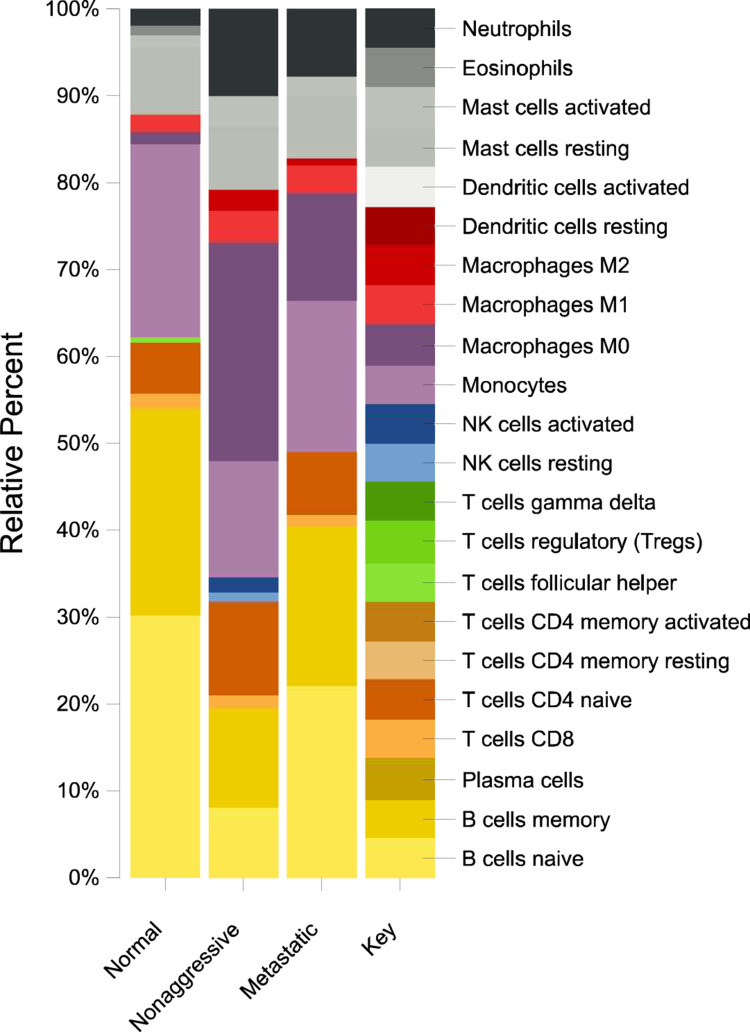
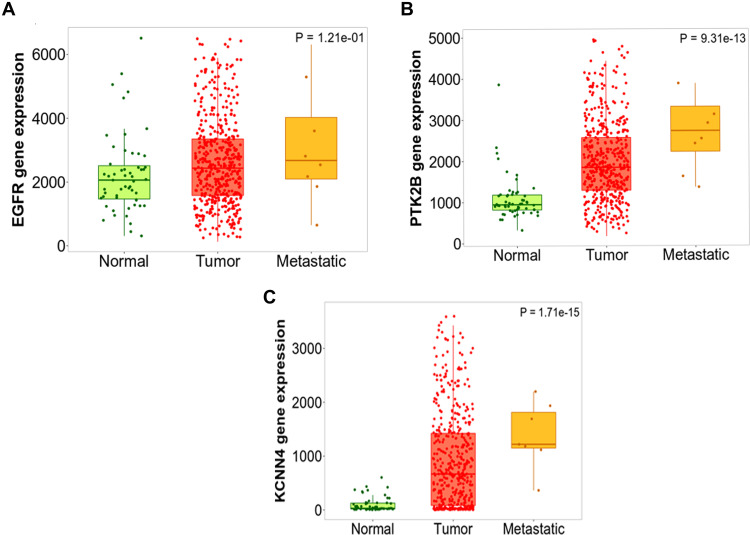
Methods: Publicly available transcriptomics data comprising a total of 95 samples consisting of 41 normal, 28 non-aggressive and 26 metastatic papillary thyroid carcinoma (PTC) cases were used. Transcriptomics data were normalized and filtered identifying 9394 differentially expressed genes. The genes identified were subjected to pathway analysis using absGSEA identifying PTC related pathways. Three of the genes identified were validated on 508 thyroid cancer biopsies using RNAseq and TNMplot.
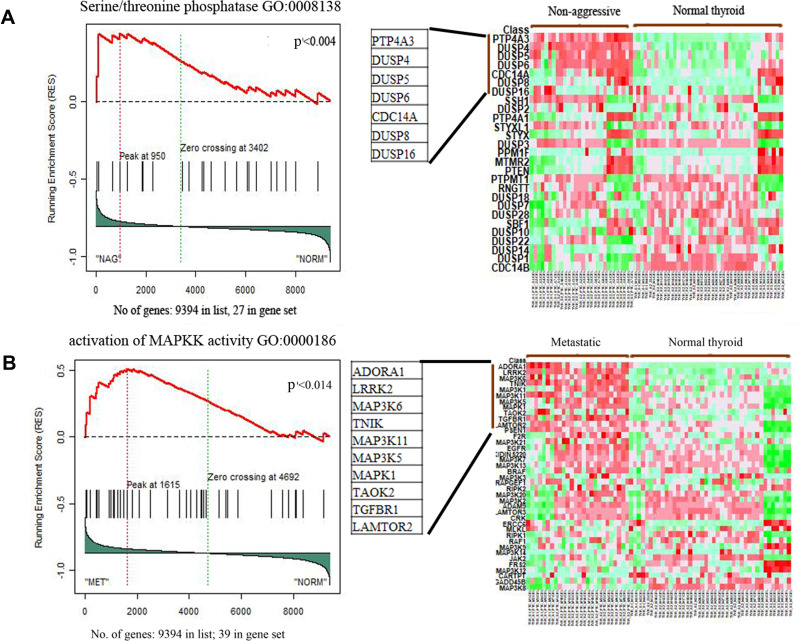
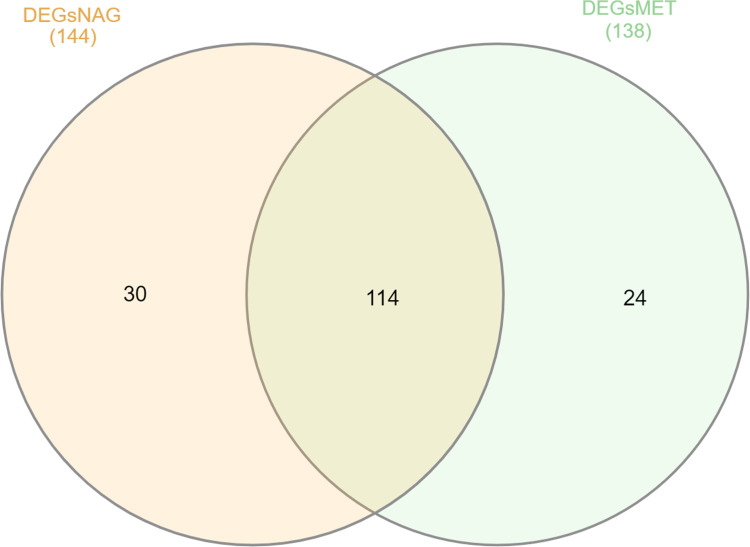
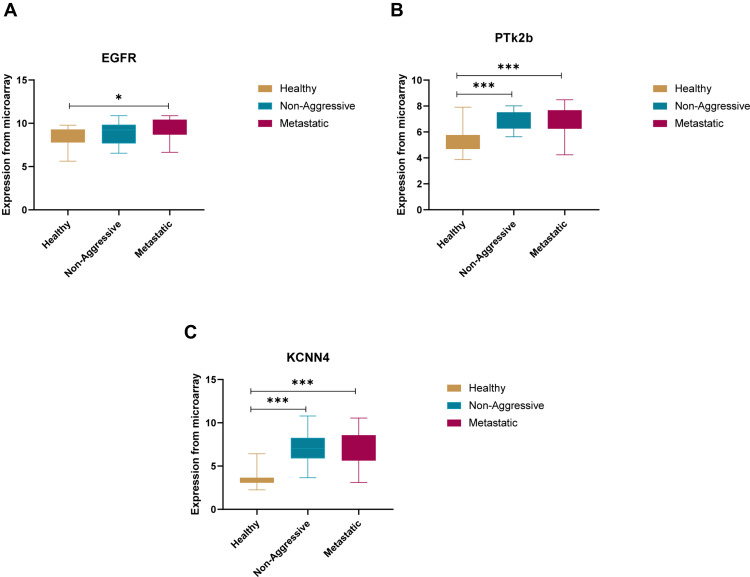
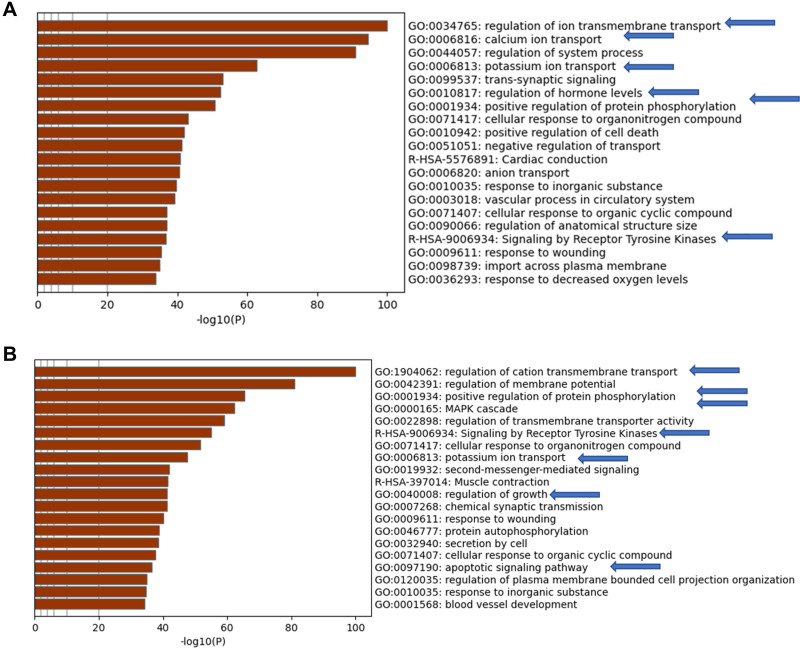
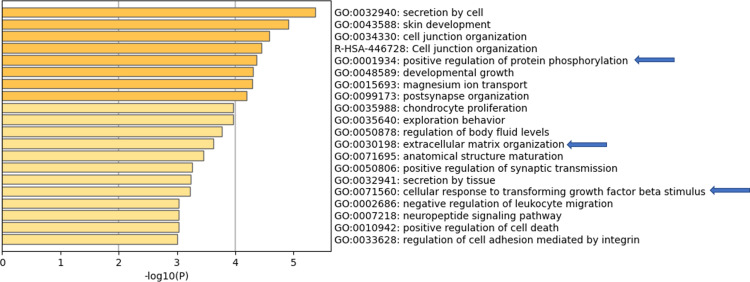
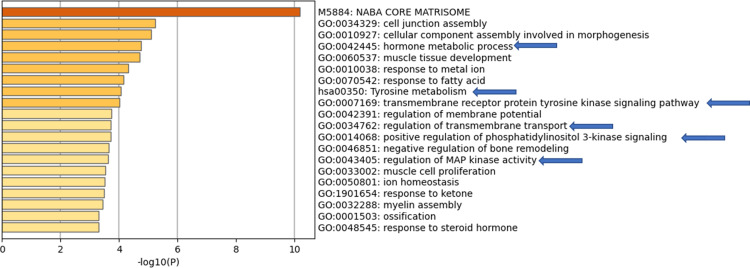
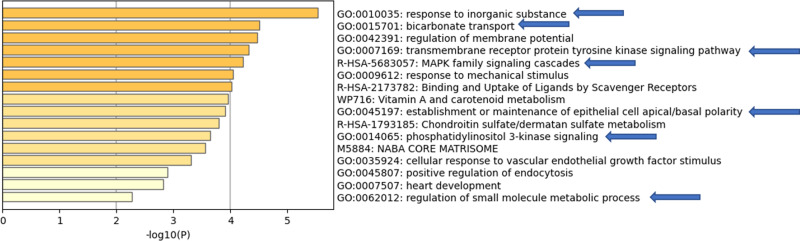
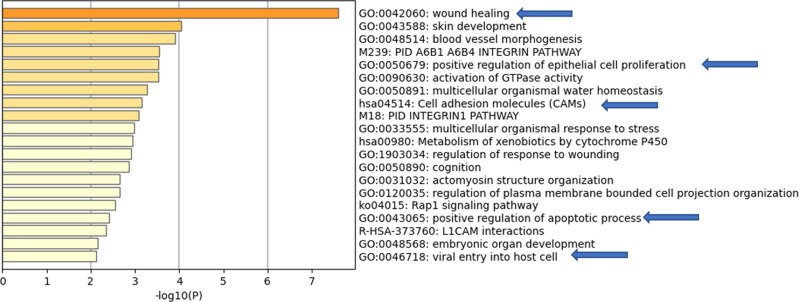
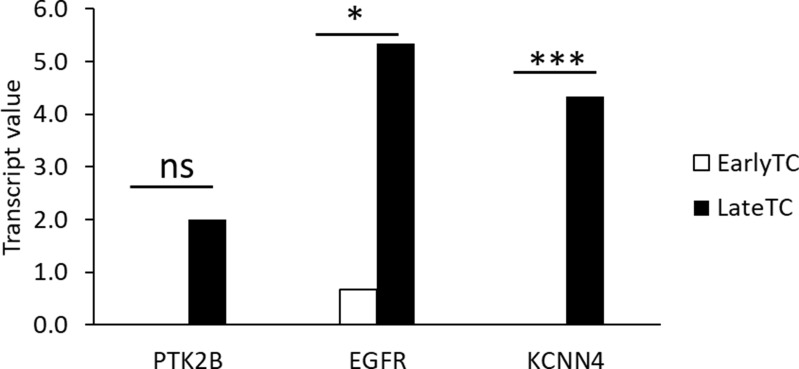
Results: Pathway analysis revealed a total of 2193 differential pathways among non-aggressive samples and 1969 among metastatic samples compared to normal tissue. Pathways for non-aggressive PTC include calcium and potassium ion transport, hormone signaling, protein tyrosine phosphatase activity and protein tyrosine kinase activity. Metastatic pathways include growth, apoptosis, activation of MAPK and regulation of serine threonine kinase activity. Genes for non-aggressive are KCNQ1, CACNA1D, KCNN4, BCL2, and PTK2B and metastatic PTC are EGFR, PTK2B, KCNN4 and BCL2. Three of the genes identified were validated using clinical biopsies showing significant overexpression in aggressive compared to non-aggressive PTC; EGFR (p < 0.05), KCNN4 (p < 0.001) and PTK2B (p < 0.001). DrugBank database search identified several FDA approved drug targets including anti-EGFR Vandetanib used to treat thyroid cancer in addition to others that may prove useful in treating PTC.
Conclusion: Transcriptomics analysis identified putative prognostic targets including EGFR, PTK2B, BCL2, KCNQ1, KCNN4 and CACNA1D. EGFR, PTK2B and KCN44 were validated using thyroid cancer clinical biopsies. The drug search identified FDA approved drugs including Vandetanib in addition to others that may prove useful in treating the disease.
Keywords: BIG data analytics; FFPE clinical biopsies; RNAseq; absolute GSEA; pathway analysis; pharmacotranscriptomics; thyroid cancer.
© 2022 Almansoori et al.
Conflict of interest statement
The authors report no competing interests in this work.
Figures
Similar articles
-
KCNN4 is a diagnostic and prognostic biomarker that promotes papillary thyroid cancer progression.Aging (Albany NY). 2020 Aug 28;12(16):16437-16456. doi: 10.18632/aging.103710. Epub 2020 Aug 28. Aging (Albany NY). 2020. PMID: 32857728 Free PMC article.
-
Integrated ligand-receptor bioinformatic and in vitro functional analysis identifies active TGFA/EGFR signaling loop in papillary thyroid carcinomas.PLoS One. 2010 Sep 22;5(9):e12701. doi: 10.1371/journal.pone.0012701. PLoS One. 2010. PMID: 20877637 Free PMC article.
-
BCL2 and hsa-miR-181a-5p are potential biomarkers associated with papillary thyroid cancer based on bioinformatics analysis.World J Surg Oncol. 2019 Dec 16;17(1):221. doi: 10.1186/s12957-019-1755-9. World J Surg Oncol. 2019. PMID: 31842912 Free PMC article.
-
[The mitogen-activated protein kinase (MAPK) signaling pathway in papillary thyroid cancer. From the molecular bases to clinical practice].Endocrinol Nutr. 2009 Apr;56(4):176-86. doi: 10.1016/S1575-0922(09)70982-9. Epub 2009 Jun 11. Endocrinol Nutr. 2009. PMID: 19627734 Review. Spanish.
-
miR-451a is underexpressed and targets AKT/mTOR pathway in papillary thyroid carcinoma.Oncotarget. 2016 Mar 15;7(11):12731-47. doi: 10.18632/oncotarget.7262. Oncotarget. 2016. PMID: 26871295 Free PMC article. Review.
Cited by
-
Identification of calcium metabolism related score associated with the poor outcome in papillary thyroid carcinoma.Front Oncol. 2023 Mar 28;13:1108773. doi: 10.3389/fonc.2023.1108773. eCollection 2023. Front Oncol. 2023. PMID: 37056339 Free PMC article.
References
LinkOut - more resources
Full Text Sources
Research Materials
Miscellaneous
