

Biomechanical Correlates of Falls Risk in Gait Impaired Stroke Survivors
- PMID: 35330930
- PMCID: PMC8940193
- DOI: 10.3389/fphys.2022.833417
Biomechanical Correlates of Falls Risk in Gait Impaired Stroke Survivors
Abstract
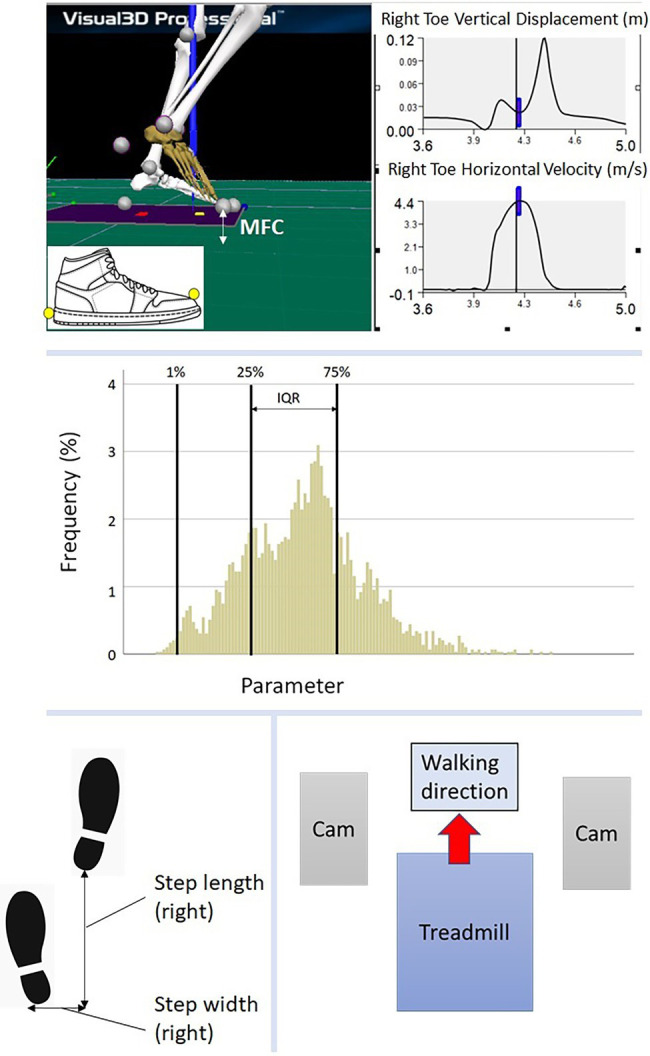
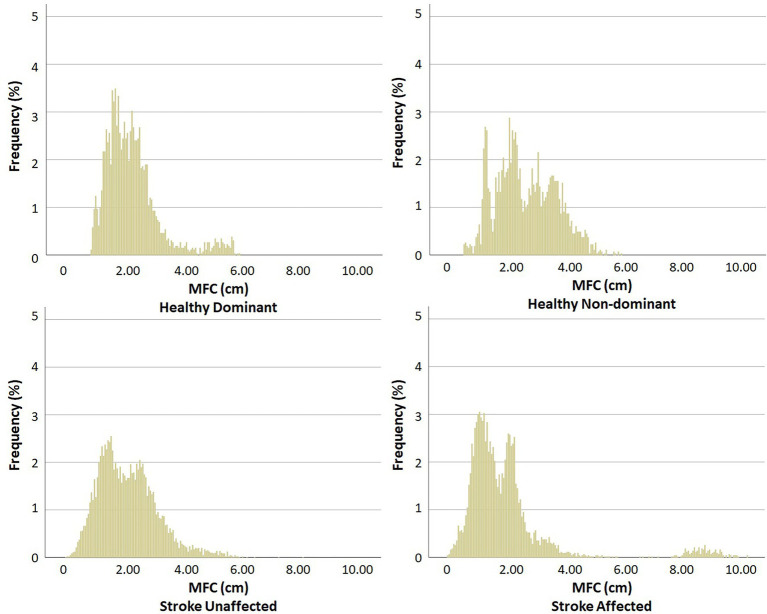
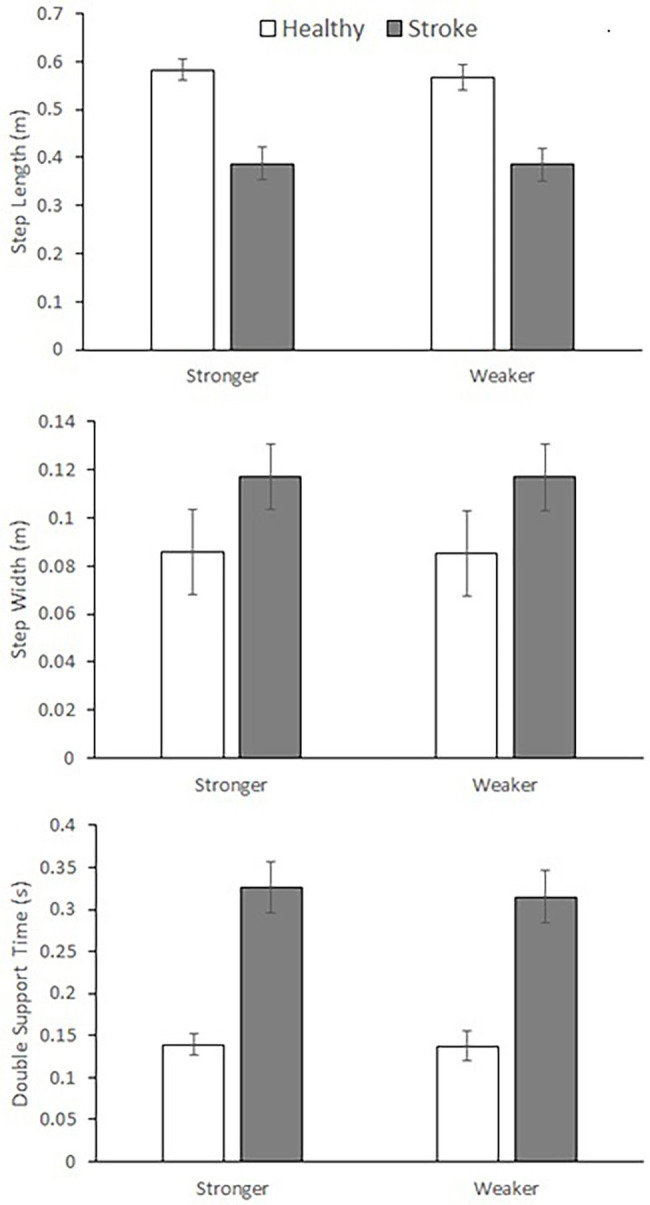
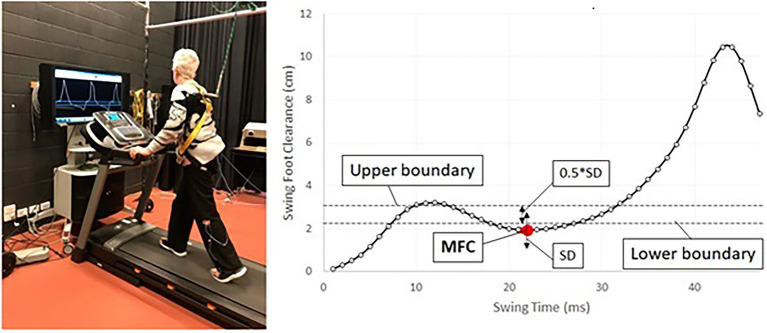
Increased falls risk is prevalent among stroke survivors with gait impairments. Tripping is the leading cause of falls and it is highly associated with mid-swing Minimum Foot Clearance (MFC), when the foot's vertical margin from the walking surface is minimal. The current study investigated MFC characteristics of post-stroke individuals (n = 40) and healthy senior controls (n = 21) during preferred speed treadmill walking, using an Optotrak 3D motion capture system to record foot-ground clearance. In addition to MFC, bi-lateral spatio-temporal gait parameters, including step length, step width and double support time, were obtained for the post-stroke group's Unaffected and Affected limb and the control group's Dominant and Non-dominant limbs. Statistical analysis of MFC included central tendency (mean, median), step-to-step variability (standard deviation and interquartile range) and distribution (skewness and kurtosis). In addition, the first percentile, that is the lowest 1% of MFC values (MFC 1%) were computed to identify very high-risk foot trajectory control. Spatio-temporal parameters were described using the mean and standard deviation with a 2 × 2 (Group × Limb) Multivariate Analysis of Variance applied to determine significant Group and Limb effects. Pearson's correlations were used to reveal any interdependence between gait variables and MFC control. The main finding of the current research was that post-stroke group's affected limb demonstrated lower MFC 1% with higher variability and lower kurtosis. Post-stroke gait was also characterised by shorter step length, larger step width and increased double support time. Gait retraining methods, such as using real-time biofeedback, would, therefore, be recommended for post-stroke individuals, allowing them to acquire optimum swing foot control and reduce their tripping risk by elevating the swing foot and improving step-to-step consistency in gait control.
Keywords: falls prevention; gait retraining; minimum foot clearance; stroke; tripping prevent.
Copyright © 2022 Nagano, Said, James, Sparrow and Begg.
Conflict of interest statement
The authors declare that the research was conducted in the absence of any commercial or financial relationships that could be construed as a potential conflict of interest.
Figures
References
-
- Australian Institute of Health and Welfare (2020). Stroke. Available at: https://www.aihw.gov.au/reports/australias-health/stroke (Accessed August 20, 2020).
LinkOut - more resources
Full Text Sources