. 2020 Dec 4;2(1):zqaa036.
doi: 10.1093/function/zqaa036. eCollection 2021.

Kv1.3 Channel Inhibition Limits Uremia-Induced Calcification in Mouse and Human Vascular Smooth Muscle

Affiliations

Kv1.3 Channel Inhibition Limits Uremia-Induced Calcification in Mouse and Human Vascular Smooth Muscle

Violeta Cazaña-Pérez et al. Function (Oxf). .

Abstract

Chronic kidney disease (CKD) significantly increases cardiovascular risk. In advanced CKD stages, accumulation of toxic circulating metabolites and mineral metabolism alterations triggers vascular calcification, characterized by vascular smooth muscle cell (VSMC) transdifferentiation and loss of the contractile phenotype. Phenotypic modulation of VSMC occurs with significant changes in gene expression. Even though ion channels are an integral component of VSMC function, the effects of uremia on ion channel remodeling has not been explored. We used an in vitro model of uremia-induced calcification of human aorta smooth muscle cells (HASMCs) to study the expression of 92 ion channel subunit genes. Uremic serum-induced extensive remodeling of ion channel expression consistent with loss of excitability but different from the one previously associated with transition from contractile to proliferative phenotypes. Among the ion channels tested, we found increased abundance and activity of voltage-dependent K+ channel Kv1.3. Enhanced Kv1.3 expression was also detected in aorta from a mouse model of CKD. Pharmacological inhibition or genetic ablation of Kv1.3 decreased the amount of calcium phosphate deposition induced by uremia, supporting an important role for this channel on uremia-induced VSMC calcification.

Keywords: BK channels; chronic kidney disease; ion channel remodeling; phenotypic switch; voltage-dependent potassium channels.


Figures

None
Graphical abstract
Figure 1.
Figure 1.
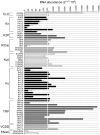
Relative mRNA Abundance of Ion Channels Genes in VSMCs (HASMC). HASMC were cultured in 20% control serum for 5 days. Expression levels were normalized to GAPDH and expressed as 2−ΔCt × 106, where ΔCt = Ct(gene) – Ct(GAPDH). Each bar is the mean of three independent samples analyzed in duplicate.
Figure 2.
Figure 2.
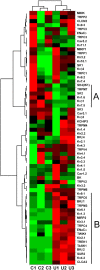
Two-Way Hierarchical Agglomerative Clustering of Ion Channel Subunit Expression in HASMC. The analysis was applied to the 62 genes expressed in HASMC and to three samples treated with control serum (C1 to C3) and three samples treated with uremic serum (U1 to U3). ΔCt values for each gene and sample were used as input data. A color scale ranging from bright green (lowest) to bright red (highest) represents expression levels for each gene and sample. The length of tree branches is proportional to the correlation of the gene expression pattern. A and B denote the groups of genes most relevant for clustering.
Figure 3.
Figure 3.
Significantly Altered Ion Channel Subunit Abundance in Cells after Incubation with Uremic Serum. HASMC were cultured in the presence of 20% control or uremic serum for 5 days. Expression changes are expressed as fold-change abundance normalized to GAPDH using the ΔΔCt method, in HASMC cultured in uremic serum compared to cells cultured in control serum. Open bars represent increased expression in uremic serum; black bars represent decreased expression in uremic serum. Bars are the mean ± SEM of three independent samples analyzed in duplicate. Student’s t-test; *P < 0.05; **P < 0.01; ***P < 0.001.
Figure 4.
Figure 4.
Kv1.3 Channel Abundance Is Upregulated by Uremic Serum in HASMC and in the Aorta of a Mouse Model of CKD. Relative mRNA abundance of Kv1.3 (A and B) and Kv1.5 (C and D) in control or uremic serum-treated HASMC and in aorta from sham-operated and subtotal nephrectomy (5/6 model of CKD) mouse groups. Bars represent mean ± SEM (N = 6). mRNA abundance normalized to GAPDH (HASMC samples) or to HPRT (mouse CKD samples) was calculated as 2−ΔΔCt. *P < 0.05; **P < 0.01; Student’s t-test.
Figure 5.
Figure 5.
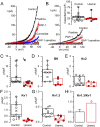
Effects of Uremic Serum on Potassium Current Density. Representative current–voltage (I–V) relationship from patch-clamp recordings obtained in whole-cell configuration from control (A) or uremic serum-treated (B) HASMC before (control traces) and after addition of the indicated inhibitors. Traces were obtained from 2 s depolarizing ramps from −60 to +120 mV. In both cases, the PAP-sensitive fraction of the current was obtained by subtracting the current in the presence of PAP-1 from the current in the presence of paxilline. Individual data points and boxplots showing cell capacitances of control and uremic serum–treated cells are shown in the inset. (C) Individual data points and boxplots showing total K+ current density in HASMC exposed to control or uremic serum. The boxplot range goes from percentile 25 to 75 and wiskers indicate the 5–95 range. Median is represented as a line and media value is shown with an X symbol. N = 9–13 individual cells from at least three independent experiments. **P < 0.01; MMW test. (D–G) Individual data points and boxplots of the current density carried by BK channels (paxilline-sensitive, D), Kv2 channels (TEA-sensitive, E), Kv1 channels (correolide-sensitive, F), and Kv1.3 channels (PAP-1-sensitive, G) in HASMC exposed to control (black dots) or uremic serum (red dots). Boxplot representation is as in (C). N = 4–10 cells from at least 3 independent experiments. *P < 0.05; **P < 0.01; MMW test. (H) The bar plots show the fraction of total Kv1 current carried by Kv1.3 channels. Mean ± SEM (N = 6–7). *P < 0.05; Student’s t-test.
Figure 6.
Figure 6.
Effects of Kv1.3 Pharmacological Inhibition on HASMC Proliferation. (A) Quantitative analysis of HASMC proliferation. Only 20% FBS-induced proliferation was expressed as the percentage of EdU positive (EdU+) cells after 6 h incubation. Experimental conditions included the negative control (0% FBS) and the inhibitory effect of PAP-1 (100 nM) and margatoxin (MgTx, 10 nM) on 20% FBS-induced proliferation. Each bar represents mean ± SEM of 3–4 independent experiments performed in duplicate. Data were analyzed using one-way ANOVA followed by Tukey’s test. ***P < 0.001 vs 20% FBS. (B) Representative micrographs of EdU incorporation in HASMC exposed for 24 h to control or uremic serum in the presence or absence of Kv1.3 inhibitor PAP-1. Nuclei were counterstained with Hoechst 33342 dye. (C) Percentage of EdU+ cells at the indicated time points after addition of control or uremic serum with or without 100 nM PAP-1. Each data point represents mean ± SEM (three independent experiments performed in duplicate). Data were analyzed using one-way ANOVA followed by Tukey’s test. *P < 0.05 vs control; #P < 0.05 vs uremic serum. (D) PAP-1-sensitive fraction of EdU incorporation in HASMC treated with control or uremic serum for the indicated period of time.
Figure 7.
Figure 7.
Effects of Kv1.3 Inhibition on HASMC Migration. (A) Representative micrographs of HAMSC pretreated for 24 h with control or uremic serum in the presence or absence of 100 nM PAP-1 and placed on serum-free medium to assess cell migration. Pictures were taken at the time of silicon insert removal (t = 0) or after 120 h. Boxed area indicates the original place of the silicon insert. (B) Graph represents mean (±SEM) percentage invaded area at the indicated time points and conditions (three independent experiments performed in triplicate). One-way ANOVA followed by Tukey’s test; **P < 0.01; ***P < 0.001; ****P < 0.0001. (C) PAP-1-sensitive fraction of cell migration in HASMC treated with control or uremic serum for the indicated period of time.
Figure 8.
Figure 8.
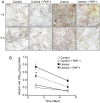
Pharmacological Inhibition of Kv1.3 Channels Reduces Uremia-Induced HASMC Calcification. (A) Representative images of Alizarin Red stained HAMSC treated for 24 h or 5 days with control or uremic serum in the presence or absence of 100 nM PAP-1. (B) Quantitation of calcium phosphate deposition by Alizarin Red staining. Each data point represents mean ± SEM absorbance at 450 nm normalized by the total amount of protein for the indicated day of treatment (three independent experiments, with four replicas per condition in each experiment). Values were compared using Kruskal–Wallis test followed by Dunn’s multiple comparisons test. *P < 0.05 control vs uremic serum; #P < 0.05 vs uremic serum.
Figure 9.
Figure 9.
Effects of Pharmacological Inhibition or Genetic Deletion of Kv1.3 on Uremia-Induced Artery Calcificacion in Organ Culture. (A) Representative images of hMA sections kept in organ culture for 10 days in 20% FBS with 2.5 mM phosphate (Pi, positive control) or in 20% control or uremic serum in the absence or presence of 100 nM PAP-1. Bars show the average percentage of alizarin red-stained area (mean ± SEM) measured in four different arteries. ***P < 0.001 and ** P < 0.01 compared with control serum. (B) Representative images of mAs from Kv1.3+/+ (WT) and Kv1.3−/− mice kept in organ culture for 10 days in 20% control or uremic serum. Bars show average percentage of stained area (mean ± SEM) in three arteries. *P < 0.05 compare with control serum.

Comment in

Similar articles

Cited by

References

    1. Tonelli M, Pfeffer MA.. Kidney disease and cardiovascular risk. Annu Rev Med 2007;58:123–39. - PubMed
    1. Provenzano M, Coppolino G, De Nicola L, et al.Unraveling cardiovascular risk in renal patients: a new take on old tale. Front Cell Dev Biol 2019;7:314. - PMC - PubMed
    1. Benz K, Varga I, Neureiter D, et al.Vascular inflammation and media calcification are already present in early stages of chronic kidney disease. Cardiovasc Pathol 2017;27:57–67. - PubMed
    1. Moe SM, Chen NX.. Pathophysiology of vascular calcification in chronic kidney disease. Circ Res 2004;95(6):560–7. - PubMed
    1. Chen NX, Duan D, O'Neill KD, et al.The mechanisms of uremic serum-induced expression of bone matrix proteins in bovine vascular smooth muscle cells. Kidney Int 2006;70(6):1046–53. - PubMed

Publication types

LinkOut - more resources