. 2022 Mar 24;22(1):320.
doi: 10.1186/s12885-022-09357-y.

Context dependent isoform specific PI3K inhibition confers drug resistance in hepatocellular carcinoma cells

Affiliations

Context dependent isoform specific PI3K inhibition confers drug resistance in hepatocellular carcinoma cells

Kubra Narci et al. BMC Cancer. .

Abstract

Background: Targeted therapies for Primary liver cancer (HCC) is limited to the multi-kinase inhibitors, and not fully effective due to the resistance to these agents because of the heterogeneous molecular nature of HCC developed during chronic liver disease stages and cirrhosis. Although combinatorial therapy can increase the efficiency of targeted therapies through synergistic activities, isoform specific effects of the inhibitors are usually ignored. This study concentrated on PI3K/Akt/mTOR pathway and the differential combinatory bioactivities of isoform specific PI3K-α inhibitor (PIK-75) or PI3K-β inhibitor (TGX-221) with Sorafenib dependent on PTEN context.

Methods: The bioactivities of inhibitors on PTEN adequate Huh7 and deficient Mahlavu cells were investigated with real time cell growth, cell cycle and cell migration assays. Differentially expressed genes from RNA-Seq were identified by edgeR tool. Systems level network analysis of treatment specific pathways were performed with Prize Collecting Steiner Tree (PCST) on human interactome and enriched networks were visualized with Cytoscape platform.

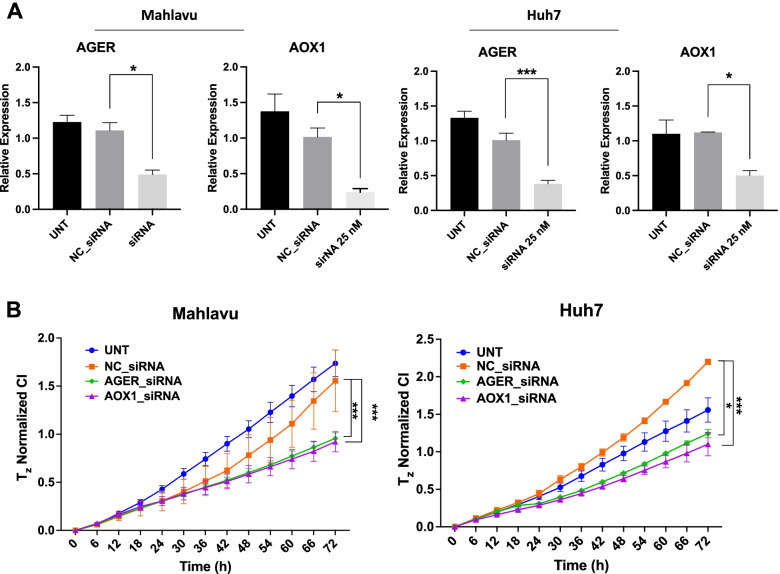
Results: Our data from combinatory treatment of Sorafenib and PIK-75 and TGX-221 showed opposite effects; while PIK-75 displays synergistic effects on Huh7 cells leading to apoptotic cell death, Sorafenib with TGX-221 display antagonistic effects and significantly promotes cell growth in PTEN deficient Mahlavu cells. Signaling pathways were reconstructed and analyzed in-depth from RNA-Seq data to understand mechanism of differential synergistic or antagonistic effects of PI3K-α (PIK-75) and PI3K-β (TGX-221) inhibitors with Sorafenib. PCST allowed as to identify AOX1 and AGER as targets in PI3K/Akt/mTOR pathway for this combinatory effect. The siRNA knockdown of AOX1 and AGER significantly reduced cell proliferation in HCC cells.

Conclusions: Simultaneously constructed and analyzed differentially expressed cellular networks presented in this study, revealed distinct consequences of isoform specific PI3K inhibition in PTEN adequate and deficient liver cancer cells. We demonstrated the importance of context dependent and isoform specific PI3K/Akt/mTOR signaling inhibition in drug resistance during combination therapies. ( https://github.com/cansyl/Isoform-spesific-PI3K-inhibitor-analysis ).

Keywords: Liver Cancer; Network analysis; PI3K/Akt/mTOR pathway; Resistance; Synergy.


Conflict of interest statement

The authors declare that they have no competing interests.

Figures

Fig. 1
Fig. 1
Characterization of HCC cells in the presence of small molecules inhibitors. Real time cell growth analysis of Huh7 and Mahlavu cells with increasing concentrations (40 μM, 20 μM, 10 μM, 5 μM, 2.5 μM) of Sorafenib, PI3K inhibitor LY294002, PI3Ki-β inhibitor (TGX-22) and PI3Ki-α (1 μM, 0.5 μM, 0.25 μM, 0.125 μM, 0.0625 μM) PI3Ki-α (PIK-75) along with DMSO vehicle control (Control is black and increasing drug concentrations is given in grey level, highest concentration is being the darkest) (A). Cell cycle analysis with flow cytometry. Sub-G1 population represents apoptotic cells (B). Wound healing assay for 24 and 48 h for cell migration. (C). 10 μM of Sorafenib, LY294002 and PI3Ki-β (TGX-221) and 0.1 μM of PI3Ki-α (PIK-75) were used for cell cycle and migration assays
Fig. 2
Fig. 2
Real-time cell growth analysis. Human liver cancer cells Huh7 (A, B) and Mahlavu (MV) (C, D) were treated with the Sorafenib, PI3Ki-α and PI3Ki-β alone or in combination with increasing concentrations as indicated. Cell index measurements were obtained by RT-CES software. DMSO was used as negative control A B. 72 h of the percent growth inhibition values were used to calculate drug interactions with The SynergyFinder web application. Positive delta score reflects synergistic and negative score reflects antagonistic drug interactions. Experiments were performed in triplicate
Fig. 3
Fig. 3
Systems Biology flowchart for RNA-seq Data analysis. Systems level methodology flowchart for differential PIK3K/Akt/mTOR pathway activities in Huh7 and Mahlavu calls treated with Sorafenib, PI3K-α inhibitor PIK-75 and PI3K-β inhibitor TGX-221 alone or in combination (A). Differentially Expressed Genes (DEG) Table summarize the abbreviations of samples as the treatments to HCC cells and differentially expressed gene (DEG) numbers. DEG filtration for A and B as follows; Huh7 cells:logFC ≥2.0, ≤ − 2.0 and p ≤ 0.01, Mahlavu cells: logFC ≥1.5, ≤ − 1.5 and p ≤ 0.01 (B). Pearson correlations for gene expressions in Huh7 and Mahlavu, no filtration (C). Dendrogram analysis on logFC for top 50 DEGs, red and blue color represented for up- and downregulated genes (D)
Fig. 4
Fig. 4
Gene Expression Patterns. Heatmaps of gene expressions illustrated as dendrograms separately for Huh7 and Mahlavu cells lines. We removed single PI3K-β inhibitor treatments for both cell lines considering its ineffectiveness. Sample sets for Huh7 and Mahlavu were separately joined, and united sets included 11,033 and 11,615 genes in total before filtration. Gene enrichment analysis was performed using BiNGO (FDR ≤ 0.05) and significant gene ontologies were selected according to the context. Hence, dendrogram analysis were performed on 581 genes for Huh7 and 583 genes for Mahlavu cells. For more detailed analysis and to view interactive dendrogram please see CanSyL github repository. Clusters were generated by heatmaply and colored; 8 for Huh7 and 6 for Mahlavu. Clusters not showing any significant enrichment were excluded. Up- and downregulated gene expression levels are colored as red and blue respectively, the intensity of the color indicates how strong the logFC value is. ALPHA; PIK-75, SALPHA; PIK-75 and Sorafenib, SBETA; TGX-221 and Sorafenib, SOR; Sorafenib treatments
Fig. 5
Fig. 5
Network based interpretation of DEGs. Venn diagram scheme of Huh7 network nodes (A). Dendogram of GO enrichments for Huh7 (B). Network representation of PI3Ki-β and Sorafenib treated Huh7 cells (C). Dendogram of GO enrichments for Mahlavu (D). Venn diagram scheme of Mahlavu network nodes (E). Network representation of PI3Ki-β and Sorafenib treated Mahlavu cells (F). ALPHA; PI3Ki-α inhibitor, SALPHA; PI3Ki-α inhibitor and SOR, SBETA; PI3Ki-β inhibitor and SOR, SOR; Sorafenib treatments
Fig. 6
Fig. 6
Proposed drug target genes. Prioritized nodes for Huh7 and Mahlavu was ranked by betweenness centrality values of randomized networks for each inhibitor treatment (A). Expressions of the genes in the cell lines. Prioritized treatments were pointed for corresponding drug treatment target (B). Relative expression profile of Mahlavu (C) and Huh7 (D) cells for AOX1 and AGER genes determined by qRT-PCR. Expression values were normalized with RPL19. Experiment was performed as triplicates and for statistical analysis, unpaired t-test with Welch correction was performed. *p < 0.05; **p < 0.01. ALPHA; PI3Ki-α inhibitor, HBETA; PI3Ki-β inhibitor, SALPHA; PI3Ki-α inhibitor and SOR, SBETA; PI3Ki-β inhibitor and SOR, SOR; Sorafenib treated cells
Fig. 7
Fig. 7
Effects of knockdown of AGER and AOX1 genes on proliferation of HCC cell lines. Knockdown of AGER and AOX1 genes in Mahlavu and Huh7 cells using 25 nM siRNA validated with q-RT-PCR experiments. Experiments were performed in triplicates and results were represented as means ± SEM. One-Way ANOVA was performed for statistical analysis (A). Cell growth analysis of Mahlavu and Huh7 cells for which siRNA treatments targeting AGER and AOX1 genes were done and cell index values reflecting cell growth were monitored for 72 h. Knockdown of both genes resulted in significant drop in cell proliferation in both cells (B). Experiments were performed in triplicates, and results were represented as means ± SEM. Two-Way ANOVA was performed for statistical analysis. *p < 0.05, **p < 0.01, ***p < 0.001

References

    1. Bray F, Ferlay J, Soerjomataram I. Global Cancer Statistics 2018: GLOBOCAN Estimates of incidence and mortality worldwide for 36 cancers in 185 countries. CA Cancer J Clin. 2018;68:394–424. doi: 10.3322/caac.21492. - DOI - PubMed
    1. Perz JF, Armstrong GL, Farrington LA, Hutin YJF, Bell BP. The contributions of hepatitis B virus and hepatitis C virus infections to cirrhosis and primary liver cancer worldwide. J Hepatol. 2006;45(4):529–538. doi: 10.1016/j.jhep.2006.05.013. - DOI - PubMed
    1. Sun B, Karin M. Review obesity, inflammation , and liver cancer. J Hepatol. 2012;56(3):704–713. doi: 10.1016/j.jhep.2011.09.020. - DOI - PMC - PubMed
    1. Aleksandrova K, Stelmach-Mardas M, Schlesinger S. Obesity and liver cancer. Recent Results Cancer Res. Fortschritte der Krebsforschung. Progres dans les recherches sur le cancer. 2016;208:177–198. doi: 10.1007/978-3-319-42542-9_10. - DOI - PubMed
    1. Farazi PA, DePinho RA. Hepatocellular carcinoma pathogenesis: from genes to environment. Nat Rev Cancer. 2006;6(9):674–687. doi: 10.1038/nrc1934. - DOI - PubMed

MeSH terms