. 2022 Mar 24;20(1):72.
doi: 10.1186/s12915-022-01277-4.

Sorting and packaging of RNA into extracellular vesicles shape intracellular transcript levels

Affiliations

Sorting and packaging of RNA into extracellular vesicles shape intracellular transcript levels

Tina O'Grady et al. BMC Biol. .

Abstract

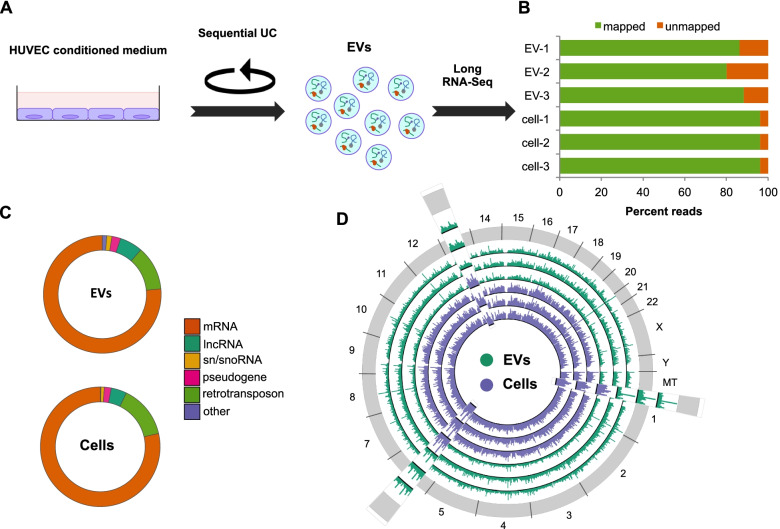
Background: Extracellular vesicles (EVs) are released by nearly every cell type and have attracted much attention for their ability to transfer protein and diverse RNA species from donor to recipient cells. Much attention has been given so far to the features of EV short RNAs such as miRNAs. However, while the presence of mRNA and long noncoding RNA (lncRNA) transcripts in EVs has also been reported by multiple different groups, the properties and function of these longer transcripts have been less thoroughly explored than EV miRNA. Additionally, the impact of EV export on the transcriptome of exporting cells has remained almost completely unexamined. Here, we globally investigate mRNA and lncRNA transcripts in endothelial EVs in multiple different conditions.

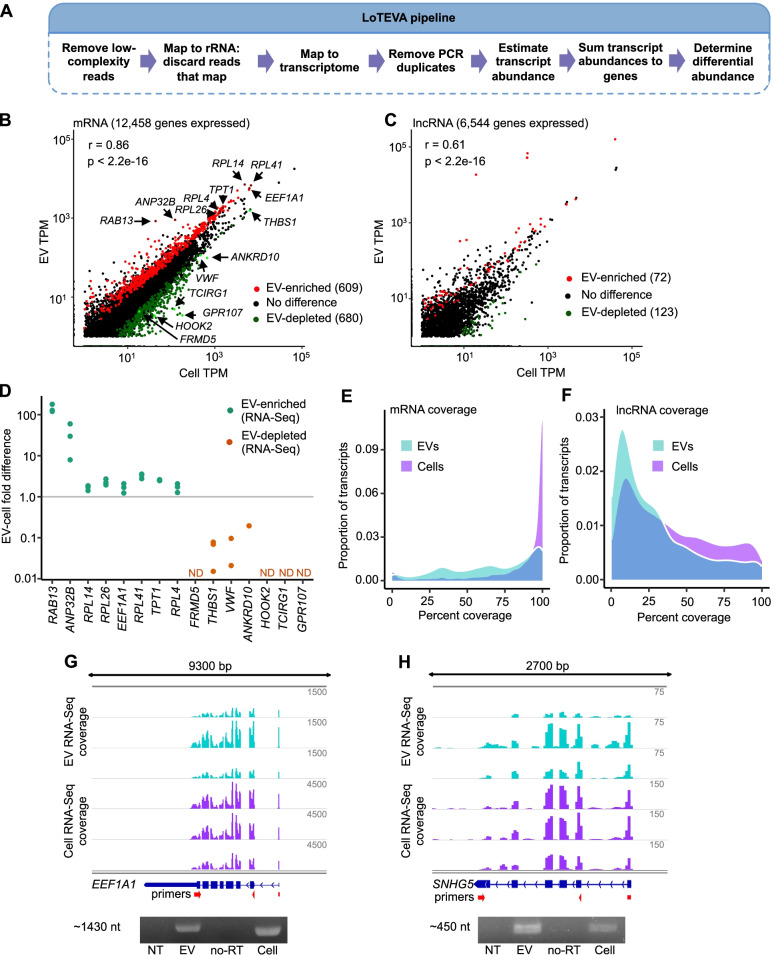
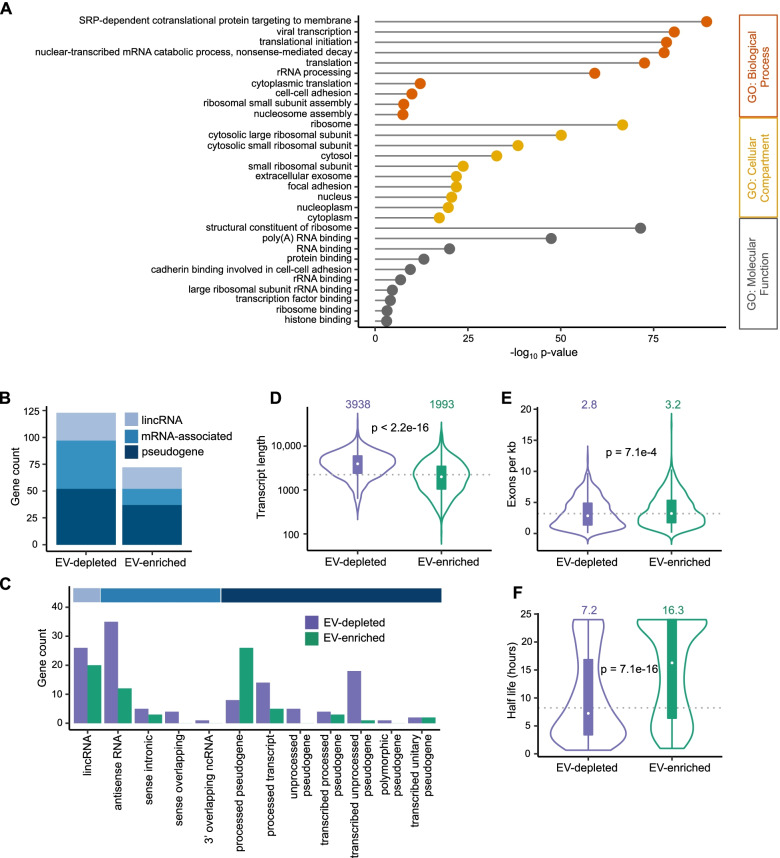
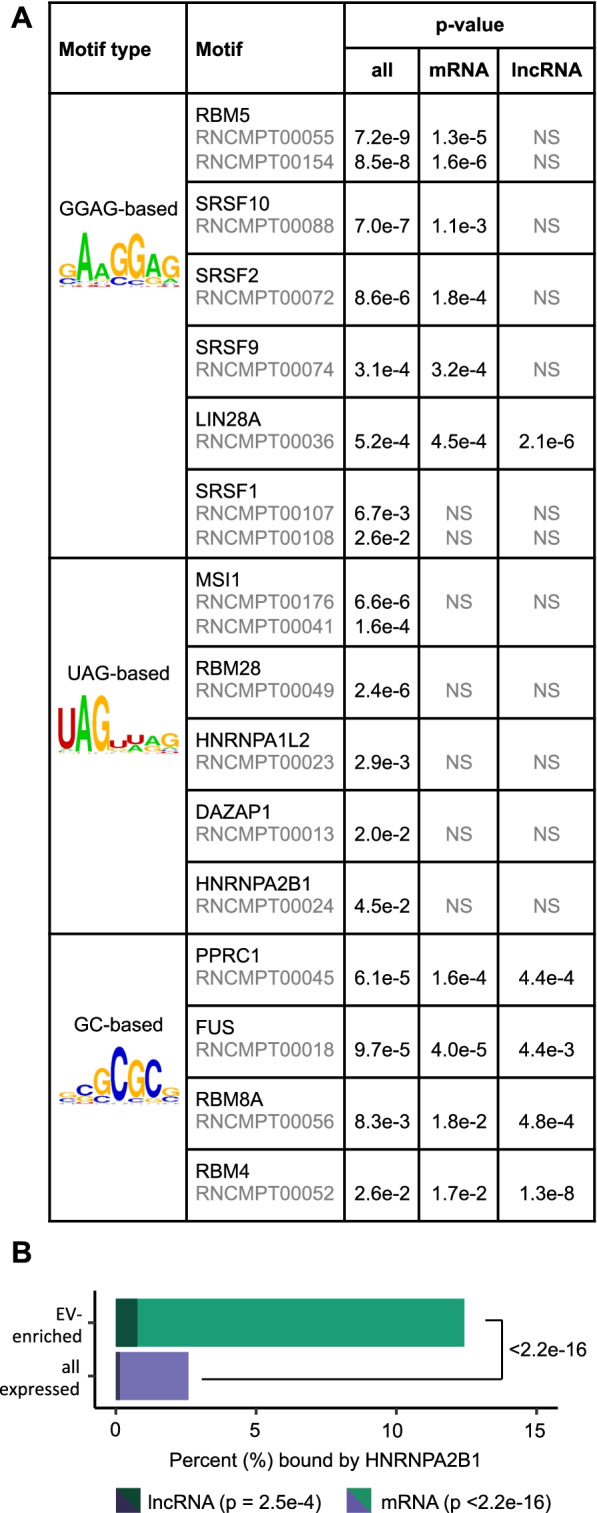
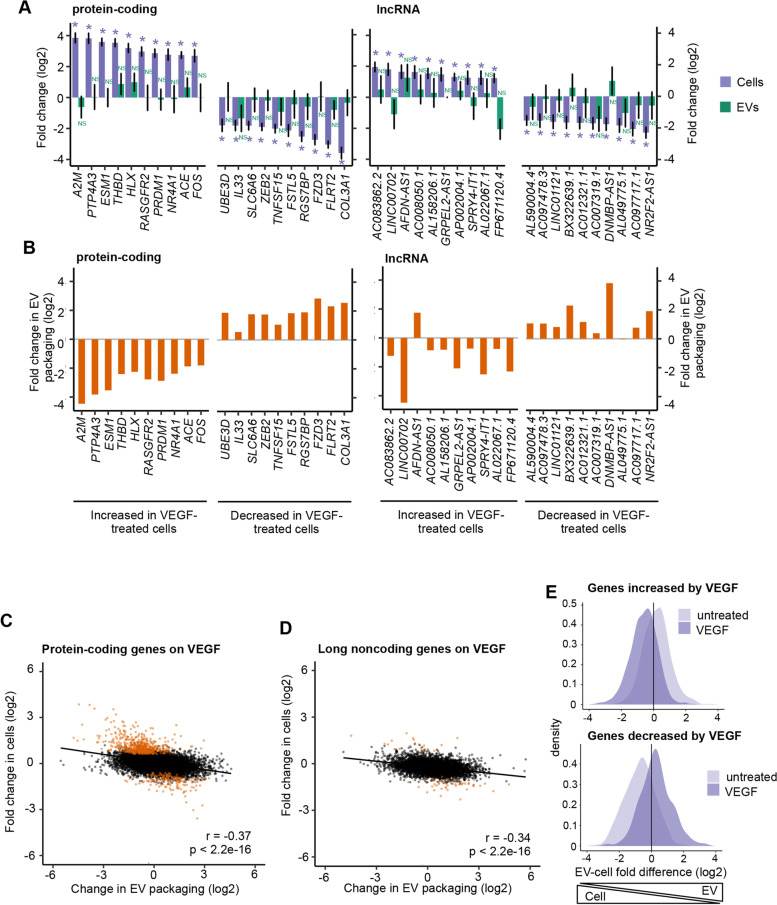
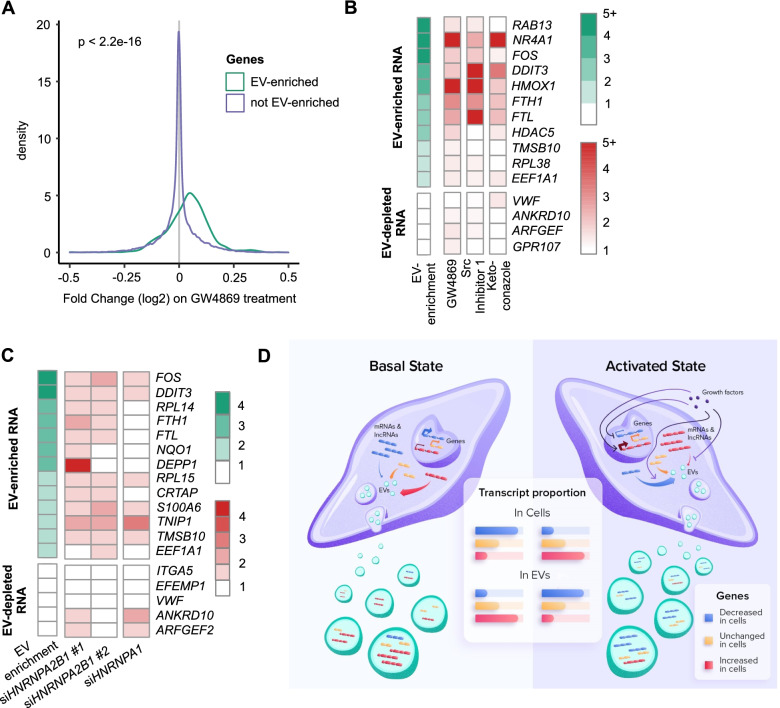
Results: In basal conditions, long RNA transcripts enriched in EVs have longer than average half-lives and distinctive stability-related sequence and structure characteristics including shorter transcript length, higher exon density, and fewer 3' UTR A/U-rich elements. EV-enriched long RNA transcripts are also enriched in HNRNPA2B1 binding motifs and are impacted by HNRNPA2B1 depletion, implicating this RNA-binding protein in the sorting of long RNA to EVs. After signaling-dependent modification of the cellular transcriptome, we observed that, unexpectedly, the rate of EV enrichment relative to cells was altered for many mRNA and lncRNA transcripts. This change in EV enrichment was negatively correlated with intracellular abundance, with transcripts whose export to EVs increased showing decreased abundance in cells and vice versa. Correspondingly, after treatment with inhibitors of EV secretion, levels of mRNA and lncRNA transcripts that are normally highly exported to EVs increased in cells, indicating a measurable impact of EV export on the long RNA transcriptome of the exporting cells. Compounds with different mechanisms of inhibition of EV secretion affected the cellular transcriptome differently, suggesting the existence of multiple EV subtypes with different long RNA profiles.

Conclusions: We present evidence for an impact of EV physiology on the characteristics of EV-producing cell transcriptomes. Our work suggests a new paradigm in which the sorting and packaging of transcripts into EVs participate, together with transcription and RNA decay, in controlling RNA homeostasis and shape the cellular long RNA abundance profile.

Keywords: Exosomes; Extracellular vesicles; Gene regulation; HNRNPA2B1; lncRNA; mRNA.


Conflict of interest statement

The authors declare that they have no competing interests.

Figures

Fig. 1
Fig. 1
Long RNA content of EVs. A Experimental overview. B Percentage of RNA-Seq reads mapped to the human genome or unmapped from 3 EV and 3 cell samples. Individual values can be found in Additional file 17. C RNA-Seq reads from 3 replicates mapped to known RNA transcripts by class of RNA transcript. rRNA reads are excluded. Individual values can be found in Additional file 17. D Circos plot of RNA-Seq reads from 3 EV and 3 cell samples mapped to the human genome. Three regions are expanded to more clearly show differences
Fig. 2
Fig. 2
Long RNA transcripts in EVs are full-length and differ from cells. A Overview of LoTEVA pipeline for EV RNA-Seq analysis. B mRNA abundance from RNA-Seq in EVs and cells. Genes indicated by name were validated by qRT-PCR. TPM = transcripts per million. TPM values are averaged across 3 replicates. C lncRNA abundance from RNA-Seq in EVs and cells. TPM = transcripts per million. TPM values are averaged across 3 replicates. D Fold difference determined by qRT-PCR from 3 independent samples for select EV-enriched and EV-depleted transcripts. Individual values can be found in Additional file 17. E RNA-Seq read coverage of mRNA transcripts in EVs and cells. N = 3. F RNA-Seq read coverage of lncRNA transcripts in EVs and cells. N = 3. G RNA-Seq read coverage (top) and RT-PCR amplicons (bottom) of EEF1A1 mRNA. NT = no template, no-RT = RNA without reverse transcriptase. H RNA-Seq read coverage (top) and RT-PCR amplicons (bottom) of lncRNA SNHG5. NT = no template, no-RT = RNA without reverse transcriptase. Uncropped images of gels can be found in Additional file 18
Fig. 3
Fig. 3
EV-enriched and EV-depleted transcripts have different characteristics. A Gene Ontology analysis of EV-enriched protein-coding genes performed with DAVID. For each GO category the ten significant (FDR < 0.05) terms with the lowest p-values are displayed. Individual values can be found in Additional file 17. B Broad categories of long noncoding RNAs enriched or depleted in EVs. Gray = long intergenic noncoding RNA, light blue = mRNA-associated lncRNA (antisense, intronic, or overlapping), navy = pseudogene. Individual values can be found in Additional file 17. C Specific gene biotypes of long noncoding RNAs enriched or depleted in EVs. Individual values can be found in Additional file 17. D Violin plot of transcript length for EV-enriched and EV-depleted genes. E Violin plot of number of exons per kilobase of transcript in EV-enriched and EV-depleted genes. F Violin plot of transcript half-life in actinomycin-D-treated HeLa cells for EV-enriched and EV-depleted transcripts. For all violin plots, medians are indicated above each violin and grey dotted lines indicate median of all expressed genes. P-values calculated by Welch two-sample t-test are indicated. All analyses were performed using 3 EV and 3 cell samples
Fig. 4
Fig. 4
EV-enriched transcripts and RBPs. A Enriched motifs from AME analysis in EV-enriched mRNA and lncRNA transcripts (padj < 0.1) relative to unchanged mRNA and lncRNA transcripts in 3 EV samples relative to 3 cell samples. RBP name, p-value and motif ID are shown. B Number of expressed and EV-enriched mRNA and lncRNA genes bound by HNRNPA2B1, as determined by HITS-CLIP. P-value determined by Fisher’s exact test. N = 16,249 expressed genes (11,825 mRNA and 4424 lncRNA), 652 EV-enriched genes (561 mRNA and 91 lncRNA). Individual values can be found in Additional file 17
Fig. 5
Fig. 5
Changes in transcript packaging are negatively correlated with changes in cellular abundance. A Log2 fold change in VEGF-treated cells vs. untreated cells and in EVs derived from VEGF-treated cells vs. EVs derived from untreated cells for the most increased and decreased protein-coding and lncRNA genes significantly changed in cells. Error bars represent standard error of log2 fold change. * = adjusted p-value < 0.1, NS = adjusted p-value > 0.1. Individual values can be found in Additional file 17. B Log2 change in packaging for the most increased and decreased protein-coding and lncRNA genes in cells. Individual values can be found in Additional file 17. C Log2 change in EV packaging and log2 fold change in cell abundance for protein-coding genes upon VEGF treatment. Orange = adjusted p-value < 0.1 in VEGF-treated vs. untreated cells. D Same as C for long noncoding genes. E Distribution of log2 fold differences of protein-coding and lncRNA genes (combined) between EVs and cells in genes increased in cells by VEGF treatment (top) or decreased in cells by VEGF treatment (bottom). Light purple = log2 fold difference distribution in untreated cells. Dark purple = log2 fold difference distribution in VEGF-treated cells. All analyses were performed using 3 EV and 3 cell samples
Fig. 6
Fig. 6
Changes in transcript packaging are negatively correlated with changes in cellular abundance. A Overview of tumor cell exposure procedure. B Log2 change in EV packaging and log2 fold change in cell abundance for protein-coding genes upon coculture. Orange = adjusted p-value < 0.1 in cocultured vs. monocultured cells. C Same as B for long noncoding genes. D Distribution of log2 fold differences of protein-coding and lncRNA genes (combined) between EVs and cells in genes increased in cells by coculture (top) or decreased in cells by coculture (bottom). Light purple = log2 fold difference distribution in monoculture cells. Dark purple = log2 fold difference distribution in cocultured cells. E GSEA analysis of gene sets enriched or depleted in cocultured vs. monocultured cells (left column) and in EVs derived from cocultured vs. monocultured cells (right column). All gene sets shown have FDR < 0.1 in cells. Individual values can be found in Additional file 17. F Depletion of MYC_TARGETS_V1 gene set in cocultured vs. monocultured cells and enrichment of the same gene set in EVs derived from cocultured vs. monocultured cells. All analyses were performed using 3 EV and 4 cell samples
Fig. 7
Fig. 7
Inhibiting EV secretion or RNA packaging affects cellular transcript levels. A Distributions of RNA-Seq log2 fold changes of genes enriched in EVs (green) and genes not enriched in EVs (purple) in cells treated with GW4869. N = 3. B Enrichment in EVs vs. cells by RNA-Seq (green scale; n = 3) and fold changes by qRT-PCR of selected genes in cells after treatment with GW4869, Src Inhibitor 1, or Ketoconazole compared to control cells treated with DMSO. Results are means from n=9, 4, and 5 independent experiments for GW4869, Src Inhibitor 1, and Ketoconazole, respectively. Individual values can be found in Additional file 17. C Enrichment in EVs vs. cells by RNA-Seq (green scale; n = 3) and fold changes by qRT-PCR of selected genes after treatment with two siRNA against HNRNPA2B1 or HNRNPA1 compared to cells treated with control siRNA. Results are means from 6, 5, and 4 experiments for siHNRNPA2B1#1, siHNRNPA2B1#2, and siHNRNPA1, respectively. Individual values can be found in Additional file 17. D Model for regulation of intracellular mRNA and lncRNA levels by packaging into EV: increased packaging of mRNA and lncRNA RNA transcripts into EVs leads to decreased abundance of those transcripts in the cell. Decreased packaging of mRNA and lncRNA transcripts into EVs leads to increased abundance of those transcripts in the cell

References

    1. Yanez-Mo M, Siljander PR, Andreu Z, Zavec AB, Borras FE, Buzas EI, Buzas K, Casal E, Cappello F, Carvalho J, et al. Biological properties of extracellular vesicles and their physiological functions. J Extracell Vesicles. 2015;4:27066. - PMC - PubMed
    1. Liang Y, Huang S, Qiao L, Peng X, Li C, Lin K, Xie G, Li J, Lin L, Yin Y, et al. Characterization of protein, long noncoding RNA and microRNA signatures in extracellular vesicles derived from resting and degranulated mast cells. J Extracell Vesicles. 2020;9(1):1697583. - PMC - PubMed
    1. Chen M, Xu R, Ji H, Greening DW, Rai A, Izumikawa K, Ishikawa H, Takahashi N, Simpson RJ. Transcriptome and long noncoding RNA sequencing of three extracellular vesicle subtypes released from the human colon cancer LIM1863 cell line. Sci Rep. 2016;6:38397. - PMC - PubMed
    1. Villarroya-Beltri C, Baixauli F, Gutierrez-Vazquez C, Sanchez-Madrid F, Mittelbrunn M. Sorting it out: regulation of exosome loading. Semin Cancer Biol. 2014;28:3–13. - PMC - PubMed
    1. Pan BT, Teng K, Wu C, Adam M, Johnstone RM. Electron microscopic evidence for externalization of the transferrin receptor in vesicular form in sheep reticulocytes. J Cell Biol. 1985;101(3):942–948. - PMC - PubMed

Publication types

MeSH terms