

Temporal distribution of Plasmodium falciparum recrudescence following artemisinin-based combination therapy: an individual participant data meta-analysis
- PMID: 35331243
- PMCID: PMC8943927
- DOI: 10.1186/s12936-021-03980-z
Temporal distribution of Plasmodium falciparum recrudescence following artemisinin-based combination therapy: an individual participant data meta-analysis
Abstract
Background: The duration of trial follow-up affects the ability to detect recrudescent infections following anti-malarial treatment. The aim of this study was to explore the proportions of recrudescent parasitaemia as ascribed by genotyping captured at various follow-up time-points in treatment efficacy trials for uncomplicated Plasmodium falciparum malaria.
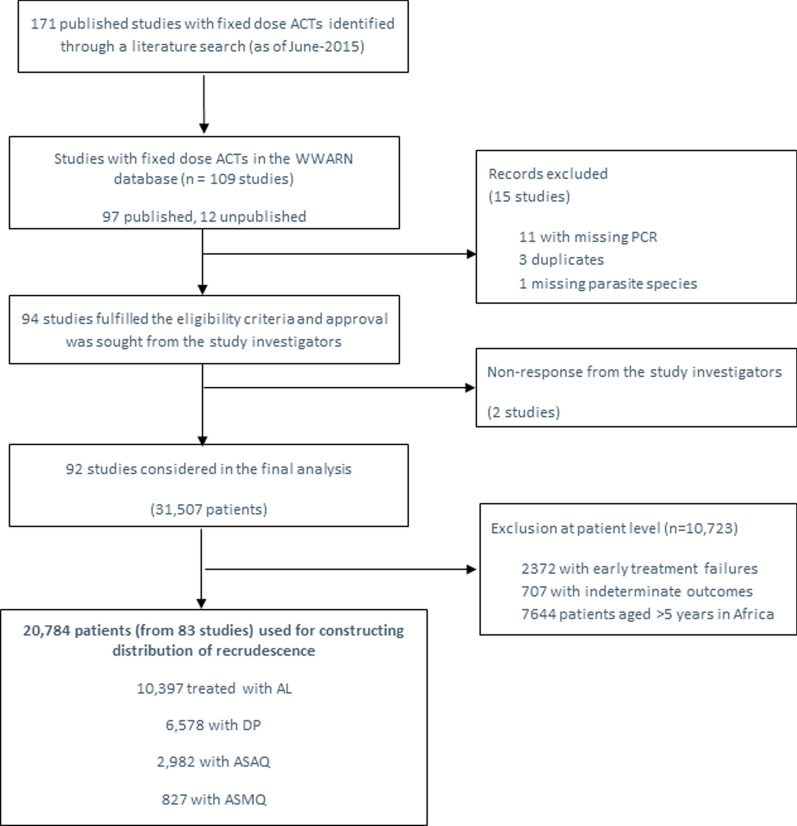
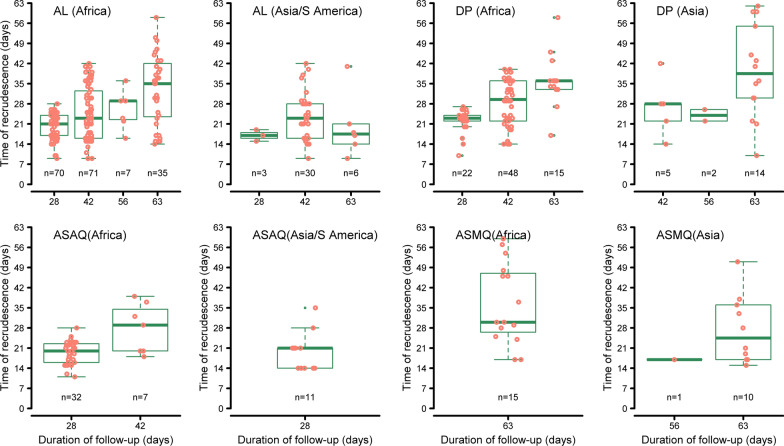
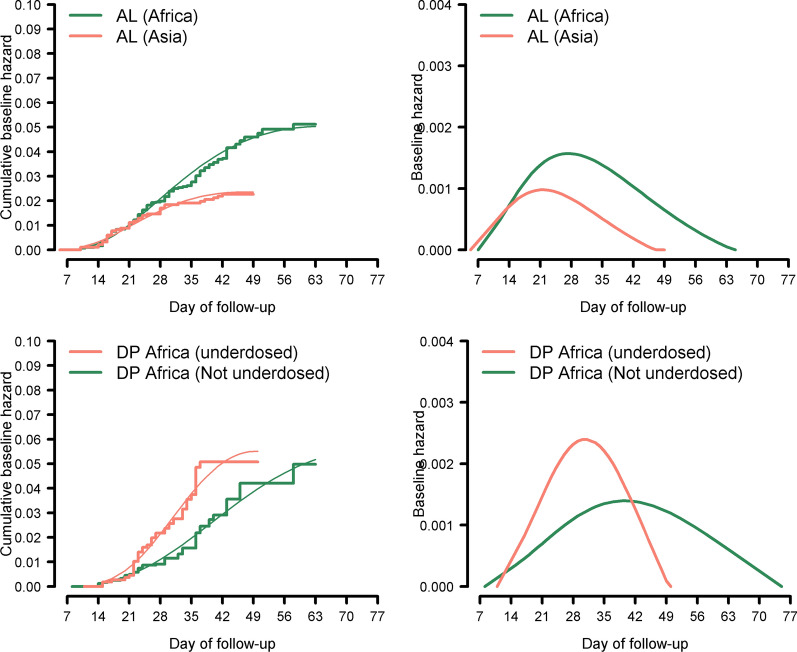
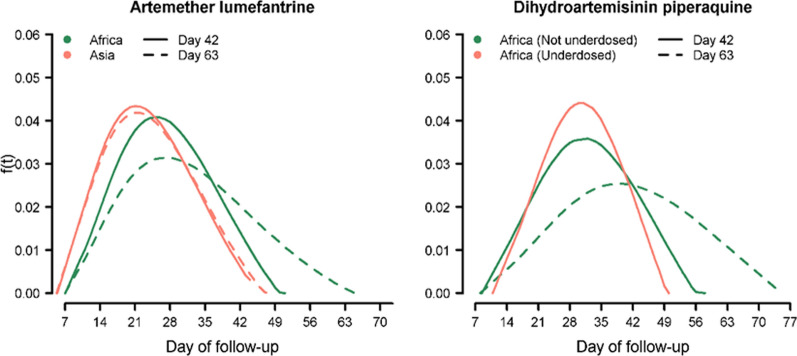
Methods: Individual patient data from 83 anti-malarial efficacy studies collated in the WorldWide Antimalarial Resistance Network (WWARN) repository with at least 28 days follow-up were available. The temporal and cumulative distributions of recrudescence were characterized using a Cox regression model with shared frailty on study-sites. Fractional polynomials were used to capture non-linear instantaneous hazard. The area under the density curve (AUC) of the constructed distribution was used to estimate the optimal follow-up period for capturing a P. falciparum malaria recrudescence. Simulation studies were conducted based on the constructed distributions to quantify the absolute overestimation in efficacy due to sub-optimal follow-up.
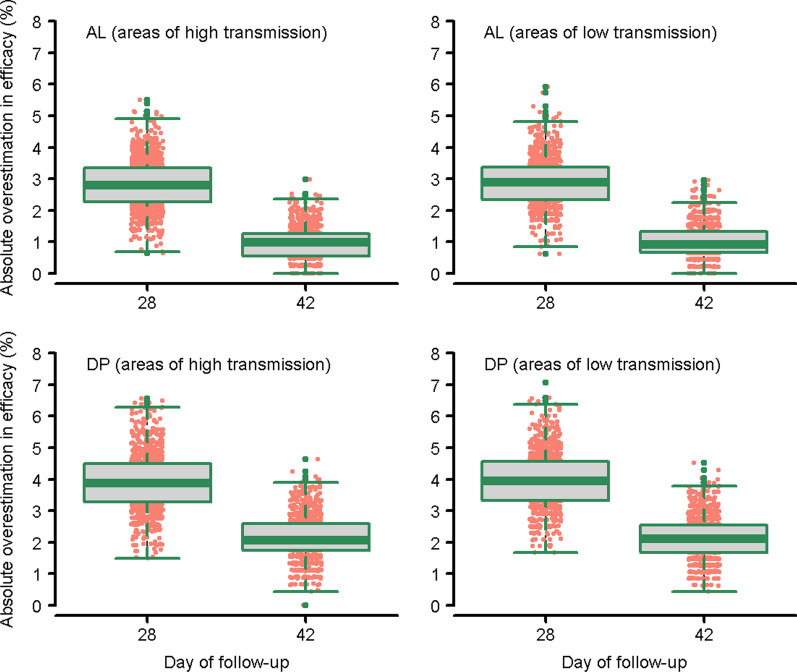
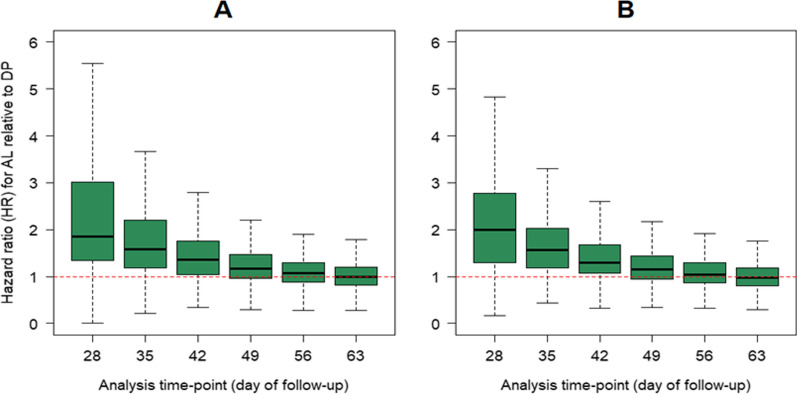
Results: Overall, 3703 recurrent infections were detected in 60 studies conducted in Africa (15,512 children aged < 5 years) and 23 studies conducted in Asia and South America (5272 patients of all ages). Using molecular genotyping, 519 (14.0%) recurrences were ascribed as recrudescent infections. A 28 day artemether-lumefantrine (AL) efficacy trial would not have detected 58% [95% confidence interval (CI) 47-74%] of recrudescences in African children and 32% [95% CI 15-45%] in patients of all ages in Asia/South America. The corresponding estimate following a 42 day dihydroartemisinin-piperaquine (DP) efficacy trial in Africa was 47% [95% CI 19-90%] in children under 5 years old treated with > 48 mg/kg total piperaquine (PIP) dose and 9% [95% CI 0-22%] in those treated with ≤ 48 mg/kg PIP dose. In absolute terms, the simulation study found that trials limited to 28 days follow-up following AL underestimated the risk of recrudescence by a median of 2.8 percentage points compared to day 63 estimates and those limited to 42 days following DP underestimated the risk of recrudescence by a median of 2.0 percentage points compared to day 42 estimates. The analysis was limited by few clinical trials following patients for longer than 42 days (9 out of 83 trials) and the imprecision of PCR genotyping which overcalls recrudescence in areas of higher transmission biasing the later distribution.
Conclusions: Restricting follow-up of clinical efficacy trials to day 28 for AL and day 42 for DP will miss a proportion of late recrudescent treatment failures but will have a modest impact in derived efficacy. The results highlight that as genotyping methods improve consideration should be given for trials with longer duration of follow-up to detect early indications of emerging drug resistance.
Keywords: Distribution; Efficacy; Follow-up; Malaria; Plasmodium falciparum; Recrudescence.
© 2022. The Author(s).
Conflict of interest statement
The findings and conclusions in this report are those of the author(s) (Jimee Hwang, Mattaeusz Plucinski, Meghna Desai, Udhayakumar Venkatachalam) and do not necessarily represent the official position of the US Centers for Disease Control and Prevention. The opinions expressed are those of the authors and do not necessarily reflect those of the Australian Defence Force, Joint Health Command or any extant Australian Defence Force policy (Michael Edstein). The opinions expressed are those of the authors and do not necessarily reflect those of the Novartis Pharmaceuticals (Cornelius Winnips). The rest of the authors declare that they have no competing interests.
Figures
References
-
- WHO. Assesment of therapeutic efficacy of antimalarial drugs for uncomplicated falciparum malaria in areas with intense transmission. Geneva, World Health Organization; 1996.
-
- White NJ. The assessment of antimalarial drug efficacy. Trends Parasitol. 2002;18:458–464. - PubMed
-
- Snounou G, Beck HP. The use of PCR genotyping in the assessment of recrudescence or reinfection after antimalarial drug treatment. Parasitol Today. 1998;14:462–467. - PubMed
-
- WHO. Monitoring Antimalarial Drug Resistance. Geneva: World Health Organization; 2001.
Publication types
MeSH terms
Substances
Grants and funding
LinkOut - more resources
Full Text Sources
