Observational Study
. 2022 Mar 24;26(1):68.
doi: 10.1186/s13054-022-03943-z.

The pathogens of secondary infection in septic patients share a similar genotype to those that predominate in the gut

Affiliations
Observational Study

The pathogens of secondary infection in septic patients share a similar genotype to those that predominate in the gut

Sucheng Mu et al. Crit Care. .

Abstract

Background: Secondary nosocomial infections, which are commonly caused by carbapenem-resistant Klebsiella pneumoniae (CRKP) and vancomycin-resistant Enterococcus faecium (VRE), often develop in septic patients. This study aimed to identify the origin of secondary systemic pathogens and reveal the underlying mechanism of infection.

Methods: In this prospective, observational case-control study, a total of 34 septic patients, 33 non-septic intensive care unit (ICU) patients and 10 healthy individuals serving as controls were enrolled. Three hundred and twelve fecal samples were collected and subjected to 16S rRNA gene amplicon sequencing. Metagenome sequencing was performed to identify the homology between dominant CRKP or VRE in the intestine and pathogens isolated from secondary infectious sites. C57/BL mice were established as pseudo germ-free animal model by pretreatment with broad-spectrum antibiotics for two weeks.

Results: The abundance and diversity of the gut microbiota in septic patients was drastically decreased one week after ICU admission, potentially leading to the enrichment of antibiotic-resistant bacteria, such as CRKP. Furthermore, secondary bloodstream and abdominal infections caused by CRKP or VRE in septic patients occurred after intestinal colonization with the predominant bacterial species. Genomic analysis showed that bacteria isolated from secondary infection had high homology with the corresponding predominant intestinal opportunistic pathogens. In addition, animal model experiments validated the hypothesis that the administration of antibiotics caused the enrichment of CRKP and VRE among the intestinal microbiota, increasing the likelihood of permeation of other tissues and potentially causing subsequent systemic infection in pseudo germ-free mice.

Conclusion: Our study indicated that the pathogens causing secondary infection in septic patients might originate from the intestinal colonization of pathogens following broad-spectrum antibiotic treatment.

Keywords: Bacterial translocation; Gut microbiota; Secondary nosocomial infection; Sepsis.


Conflict of interest statement

The authors declare no conflicts of interest.

Figures

Fig. 1
Fig. 1
Flow chart of patients enrolled
Fig. 2
Fig. 2
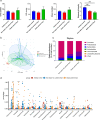
Alterations in the gut microbiota between septic and non-septic ICU patients on day 1 after ICU admission. a. Alpha diversity analysis based on number of OTUs and ACE and Chao indices and beta diversity analysis based on the Shannon diversity index among the three groups. b. Principal coordinates analysis (PCoA) using unweighted UniFrac distances showed significant differences in the microbiota composition of the three groups. c. Mean proportions of phylum compositions in the three groups. d. Proportions of genera of the three groups. *indicates comparisons with healthy controls, # indicates comparisons with septic patients on Day 1. *P < 0.05, **P < 0.01, ***P < 0.001, and #P < 0.05
Fig. 3
Fig. 3
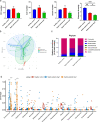
Alterations in the gut microbiota of septic patients on Days 1 and 7 after ICU admission. a. Alpha diversity analysis based on the number of OTUs and ACE and Chao indices and beta diversity analysis based on the Shannon diversity index among the three groups. b. Principal coordinate analysis (PCoA) using unweighted UniFrac distances showed significant differences in the microbiota compositions of the three groups. c. Mean proportions of phylum compositions in the three groups. d. Proportions of genera in the three groups. *indicates comparisons with healthy controls, # indicates comparisons with septic patients on Day 1. *P < 0.05, **P < 0.01, ***P < 0.001, and #P < 0.05
Fig. 4
Fig. 4
Correlation between clinical indicators and the gut microbiota composition at the genus level in septic patients. The red color represents a positive correlation, and the blue color represents a negative correlation. The deeper the color is, the higher the R value. *P < 0.05 and **P < 0.01
Fig. 5
Fig. 5
a. Time points of intestinal and secondary infections. The bar chart represents the microbiome composition at the genus level at different time points for individual patients. The triangle indicates the time of Klebsiella or Enterococcus intestinal predominance, and the bar indicates the secondary infection time. In Patient A, the intestinal Klebsiella predominance time was Day 5, and the secondary bloodstream infection time was Day 32. In Patient B, the intestinal Klebsiella predominance time was Day 3, and the systemic bloodstream infection time was Day 26. In Patient C, the intestinal Klebsiella predominance time was Day 3, and the secondary bloodstream infection time was Day 6. In Patient D, the intestinal Klebsiella predominance time was Day 1, and the secondary bloodstream infection time was Day 2. In Patient E, the intestinal Klebsiella predominance time was Day 1, and the secondary bloodstream infection time was Day 47. In Patient E, the intestinal Enterococcus predominance time was Day 5, and the secondary abdominal infection time was Day 24. b. Comparison of the intestinal metagenomic sequences and cultured bacteria sequences from patients. Using the concatenated draft genome of cultured bacteria from each patient as a reference, the intestinal metagenomic sequences were mapped to the reference, and SNPs are illustrated in the first (outer) circle. The second circle represents the region of the reference genome covered by the metagenome sequences (red). The third and fourth circles (innermost) show the genome comparison result for one randomly downloaded complete genome from NCBI with the reference draft genome (blue), with the third circle representing SNPs and the fourth circle representing coverage. The gaps in the circles indicate that this region was not covered by a metagenomic sequence (the second circle) or other known genomes (the fourth circle)
Fig. 6
Fig. 6
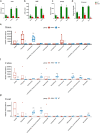
General alterations in the gut microbiota in different intestinal segments after antibiotic administration. a–d. Alpha diversity analysis based on the number of OTUs and ACE and Chao indices and beta diversity analysis based on the Shannon diversity index in different intestinal segments between AMNV-treated and WT mice. e–g. Proportions of genera in different intestinal segments of AMNV-treated and WT mice. *indicates comparisons with AMNV-treated mice. *P < 0.05 and **P < 0.01.

References

    1. Deutschman CS, Tracey KJ. Sepsis: current dogma and new perspectives. Immunity. 2014;40(4):463–475. - PubMed
    1. Martin GS, Mannino DM, Eaton S, Moss M. The epidemiology of sepsis in the United States from 1979 through 2000. N Engl J Med. 2003;348(16):1546–1554. - PubMed
    1. Haak BW, Wiersinga WJ. The role of the gut microbiota in sepsis. Lancet Gastroenterol Hepatol. 2017;2(2):135–143. - PubMed
    1. Zaborin A, Smith D, Garfield K, Quensen J, Shakhsheer B, Kade M, Tirrell M, Tiedje J, Gilbert JA, Zaborina O et al: Membership and behavior of ultra-low-diversity pathogen communities present in the gut of humans during prolonged critical illness. mBio 2014, 5(5):e01361–01314. - PMC - PubMed
    1. Kamada N, Seo SU, Chen GY, Núñez G. Role of the gut microbiota in immunity and inflammatory disease. Nat Rev Immunol. 2013;13(5):321–335. - PubMed

Publication types

Substances