

Optimal resource allocation with spatiotemporal transmission discovery for effective disease control
- PMID: 35331329
- PMCID: PMC8947954
- DOI: 10.1186/s40249-022-00957-1
Optimal resource allocation with spatiotemporal transmission discovery for effective disease control
Abstract
Background: The new waves of COVID-19 outbreaks caused by the SARS-CoV-2 Omicron variant are developing rapidly and getting out of control around the world, especially in highly populated regions. The healthcare capacity (especially the testing resources, vaccination coverage, and hospital capacity) is becoming extremely insufficient as the demand will far exceed the supply. To address this time-critical issue, we need to answer a key question: How can we effectively infer the daily transmission risks in different districts using machine learning methods and thus lay out the corresponding resource prioritization strategies, so as to alleviate the impact of the Omicron outbreaks?
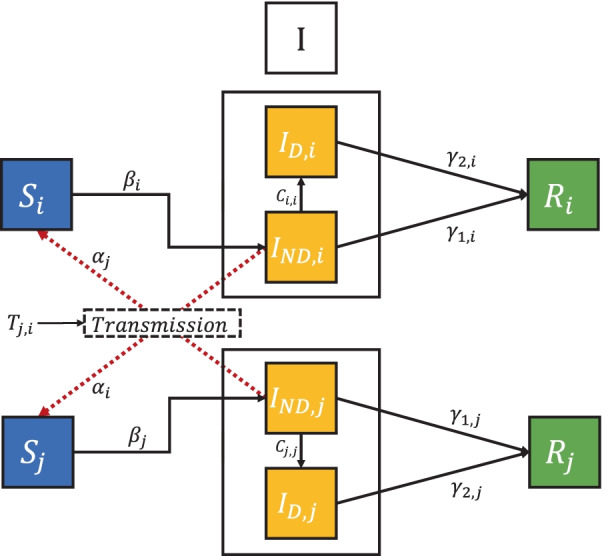
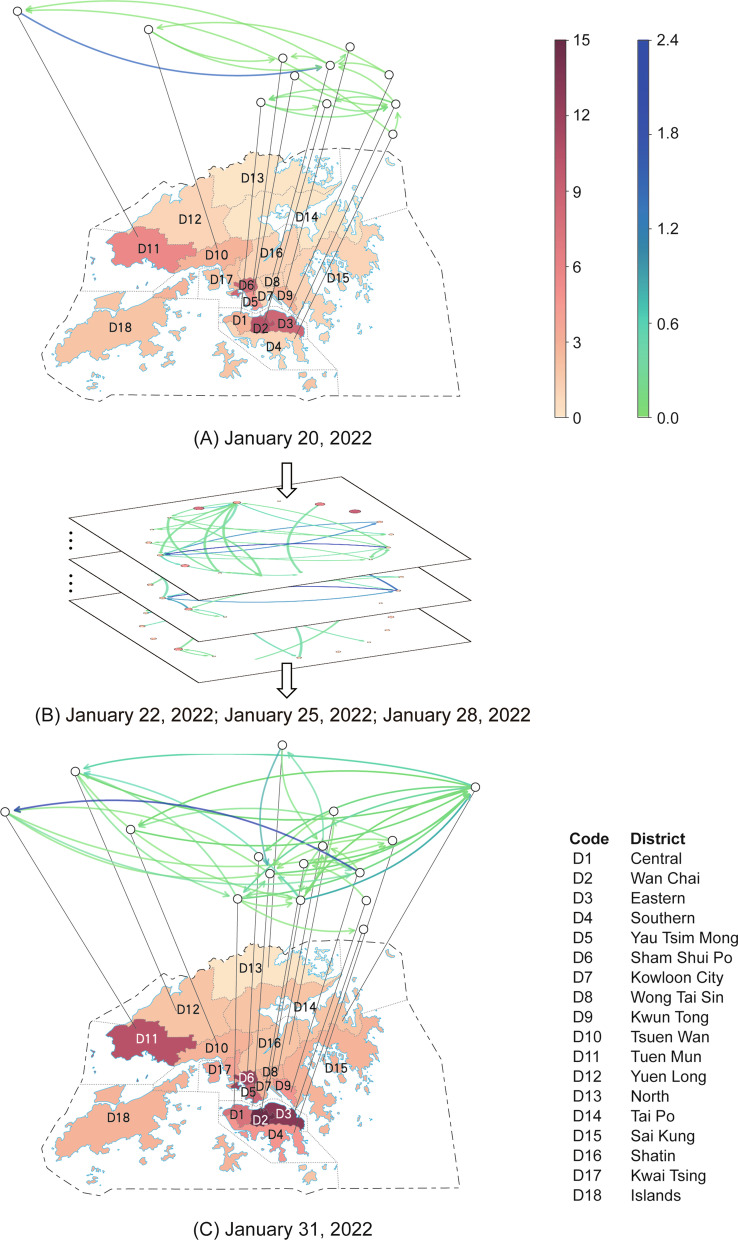
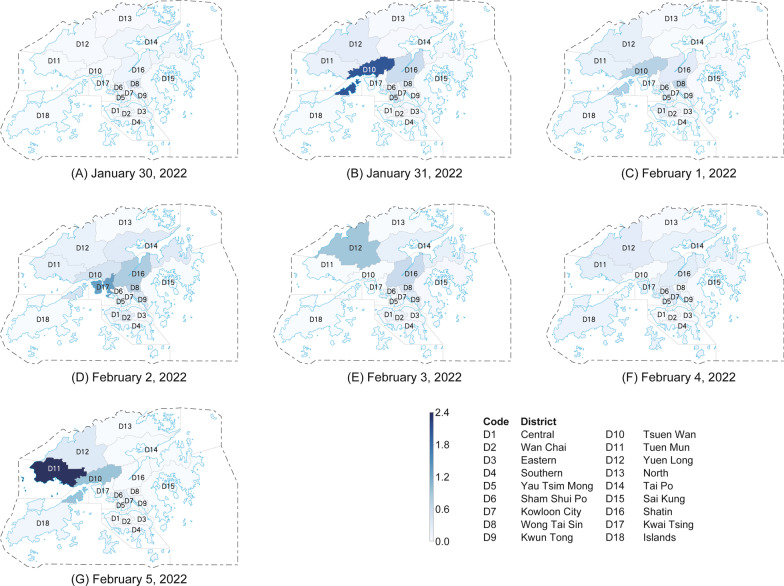
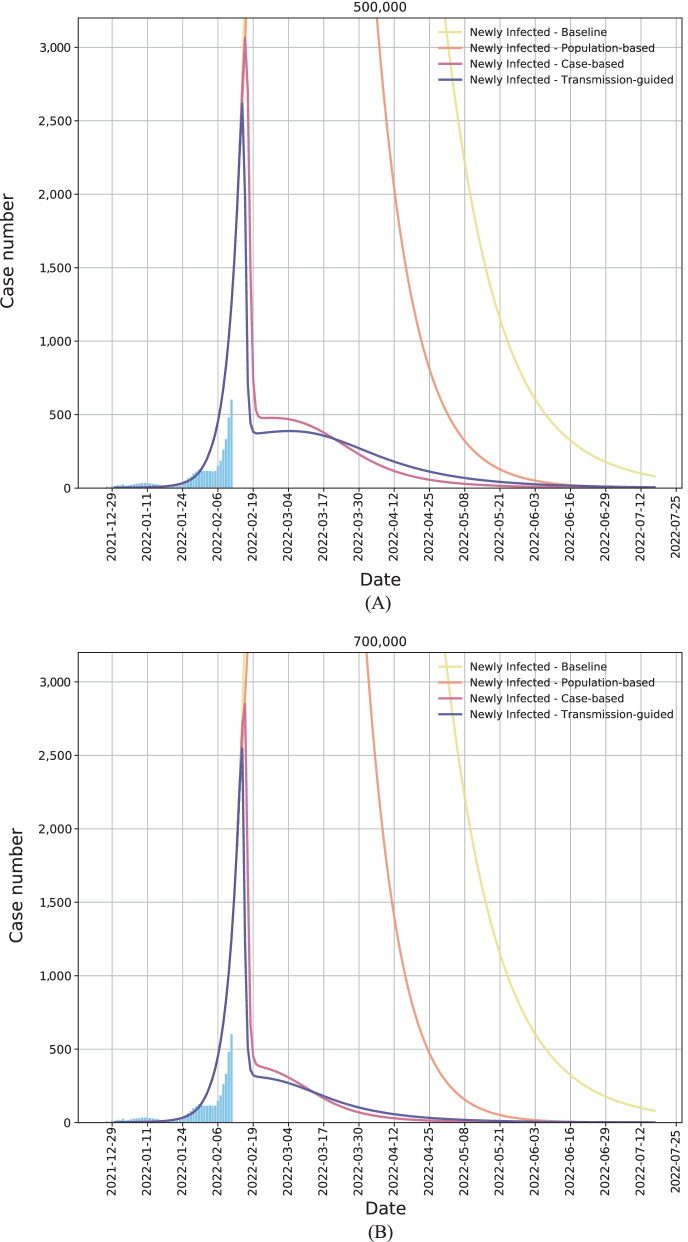
Methods: We propose a computational method for future risk mapping and optimal resource allocation based on the quantitative characterization of spatiotemporal transmission patterns of the Omicron variant. We collect the publicly available data from the official website of the Hong Kong Special Administrative Region (HKSAR) Government and the study period in this paper is from December 27, 2021 to July 17, 2022 (including a period for future prediction). First, we construct the spatiotemporal transmission intensity matrices across different districts based on infection case records. With the constructed cross-district transmission matrices, we forecast the future risks of various locations daily by means of the Gaussian process. Finally, we develop a transmission-guided resource prioritization strategy that enables effective control of Omicron outbreaks under limited capacity.
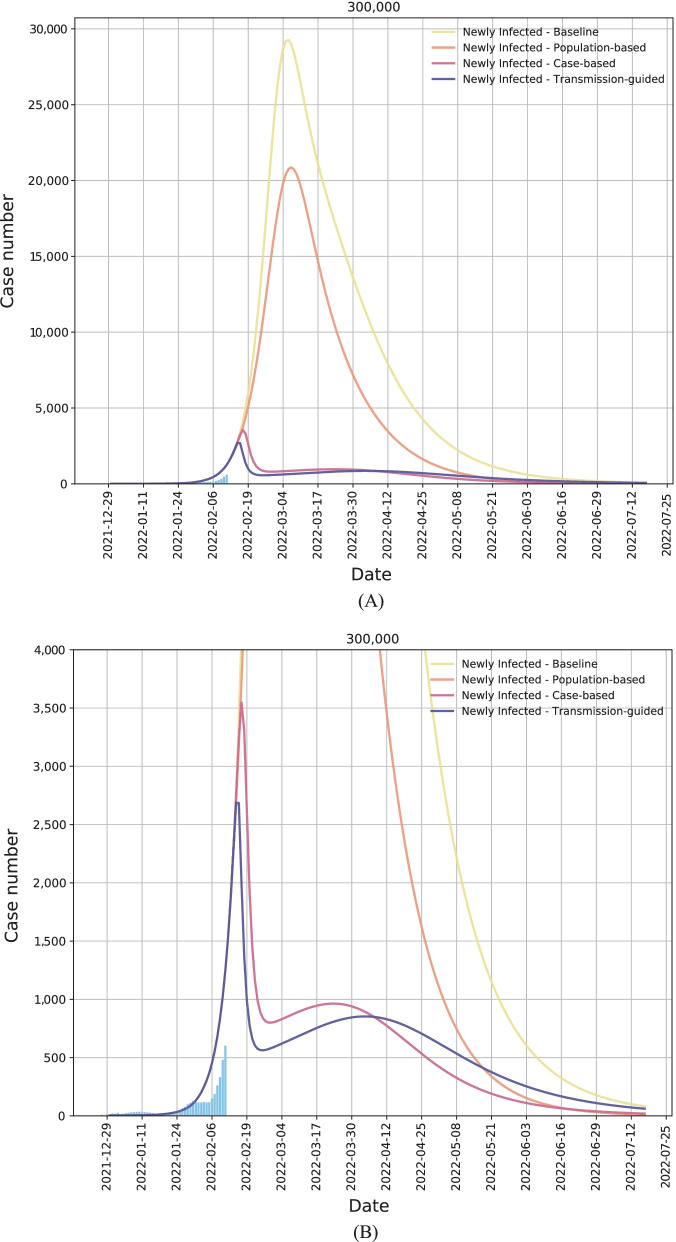
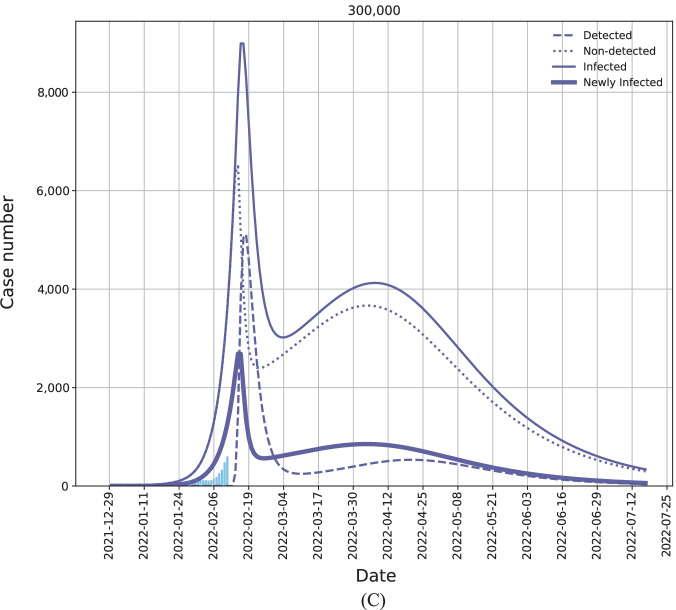
Results: We conduct a comprehensive investigation of risk mapping and resource allocation in Hong Kong, China. The maps of the district-level transmission risks clearly demonstrate the irregular and spatiotemporal varying patterns of the risks, making it difficult for the public health authority to foresee the outbreaks and plan the responses accordingly. With the guidance of the inferred transmission risks, the developed prioritization strategy enables the optimal testing resource allocation for integrative case management (including case detection, quarantine, and further treatment), i.e., with the 300,000 testing capacity per day; it could reduce the infection peak by 87.1% compared with the population-based allocation strategy (case number reduces from 20,860 to 2689) and by 24.2% compared with the case-based strategy (case number reduces from 3547 to 2689), significantly alleviating the burden of the healthcare system.
Conclusions: Computationally characterizing spatiotemporal transmission patterns allows for the effective risk mapping and resource prioritization; such adaptive strategies are of critical importance in achieving timely outbreak control under insufficient capacity. The proposed method can help guide public-health responses not only to the Omicron outbreaks but also to the potential future outbreaks caused by other new variants. Moreover, the investigation conducted in Hong Kong, China provides useful suggestions on how to achieve effective disease control with insufficient capacity in other highly populated countries and regions.
Keywords: COVID-19; Densely populated regions; Effective disease control; Integrative case management; Omicron outbreak; Optimal resource allocation; Spatiotemporal transmission risk.
© 2022. The Author(s).
Conflict of interest statement
The authors declare no competing interests.
Figures
Similar articles
-
Uncovering transmission patterns of COVID-19 outbreaks: A region-wide comprehensive retrospective study in Hong Kong.EClinicalMedicine. 2021 Jun;36:100929. doi: 10.1016/j.eclinm.2021.100929. Epub 2021 Jun 6. EClinicalMedicine. 2021. PMID: 34124628 Free PMC article.
-
TransCode: Uncovering COVID-19 transmission patterns via deep learning.Infect Dis Poverty. 2023 Feb 28;12(1):14. doi: 10.1186/s40249-023-01052-9. Infect Dis Poverty. 2023. PMID: 36855184 Free PMC article.
-
The rapid and efficient strategy for SARS-CoV-2 Omicron transmission control: analysis of outbreaks at the city level.Infect Dis Poverty. 2022 Nov 24;11(1):114. doi: 10.1186/s40249-022-01043-2. Infect Dis Poverty. 2022. PMID: 36434701 Free PMC article.
-
Evolution and Control of COVID-19 Epidemic in Hong Kong.Viruses. 2022 Nov 14;14(11):2519. doi: 10.3390/v14112519. Viruses. 2022. PMID: 36423128 Free PMC article. Review.
-
Optimal resource allocation model for COVID-19: a systematic review and meta-analysis.BMC Infect Dis. 2024 Feb 14;24(1):200. doi: 10.1186/s12879-024-09007-7. BMC Infect Dis. 2024. PMID: 38355468 Free PMC article.
Cited by
-
One Health: enabler of effective prevention, control and elimination of emerging and re-emerging infectious diseases.Infect Dis Poverty. 2025 Jul 31;14(1):77. doi: 10.1186/s40249-025-01337-1. Infect Dis Poverty. 2025. PMID: 40745334 Free PMC article. Review.
-
Bovine anaplasmosis in Zimbabwe: spatio-temporal distribution and environmental drivers.Vet Q. 2024 Dec;44(1):1-16. doi: 10.1080/01652176.2024.2306210. Epub 2024 Jan 27. Vet Q. 2024. PMID: 38279663 Free PMC article.
-
The application of artificial intelligence in health financing: a scoping review.Cost Eff Resour Alloc. 2023 Nov 6;21(1):83. doi: 10.1186/s12962-023-00492-2. Cost Eff Resour Alloc. 2023. PMID: 37932778 Free PMC article.
-
Evaluating the Demand for Nucleic Acid Testing in Different Scenarios of COVID-19 Transmission: A Simulation Study.Infect Dis Ther. 2024 Apr;13(4):813-826. doi: 10.1007/s40121-024-00954-x. Epub 2024 Mar 18. Infect Dis Ther. 2024. PMID: 38498107 Free PMC article.
-
Mobile Sensing in the COVID-19 Era: A Review.Health Data Sci. 2022 Aug 8;2022:9830476. doi: 10.34133/2022/9830476. eCollection 2022. Health Data Sci. 2022. PMID: 36408201 Free PMC article. Review.
References
-
- Omicron in Scotland—Evidence Paper. https://www.gov.scot/binaries/content/documents/govscot/publications/res.... Accessed 8 March 2022.
-
- Omicron Four Times More Transmissible Than Delta in New Study. https://www.bloomberg.com/news/articles/2021-12-09/omicron-four-times-mo.... Accessed 8 March 2022.
MeSH terms
Supplementary concepts
Grants and funding
LinkOut - more resources
Full Text Sources
Medical
Miscellaneous
