Review
. 2022 Apr;142(4):993-1001.e1.
doi: 10.1016/j.jid.2021.12.014.

Research Techniques Made Simple: Spatial Transcriptomics

Affiliations
Review

Research Techniques Made Simple: Spatial Transcriptomics

Arianna J Piñeiro et al. J Invest Dermatol. 2022 Apr.

Abstract

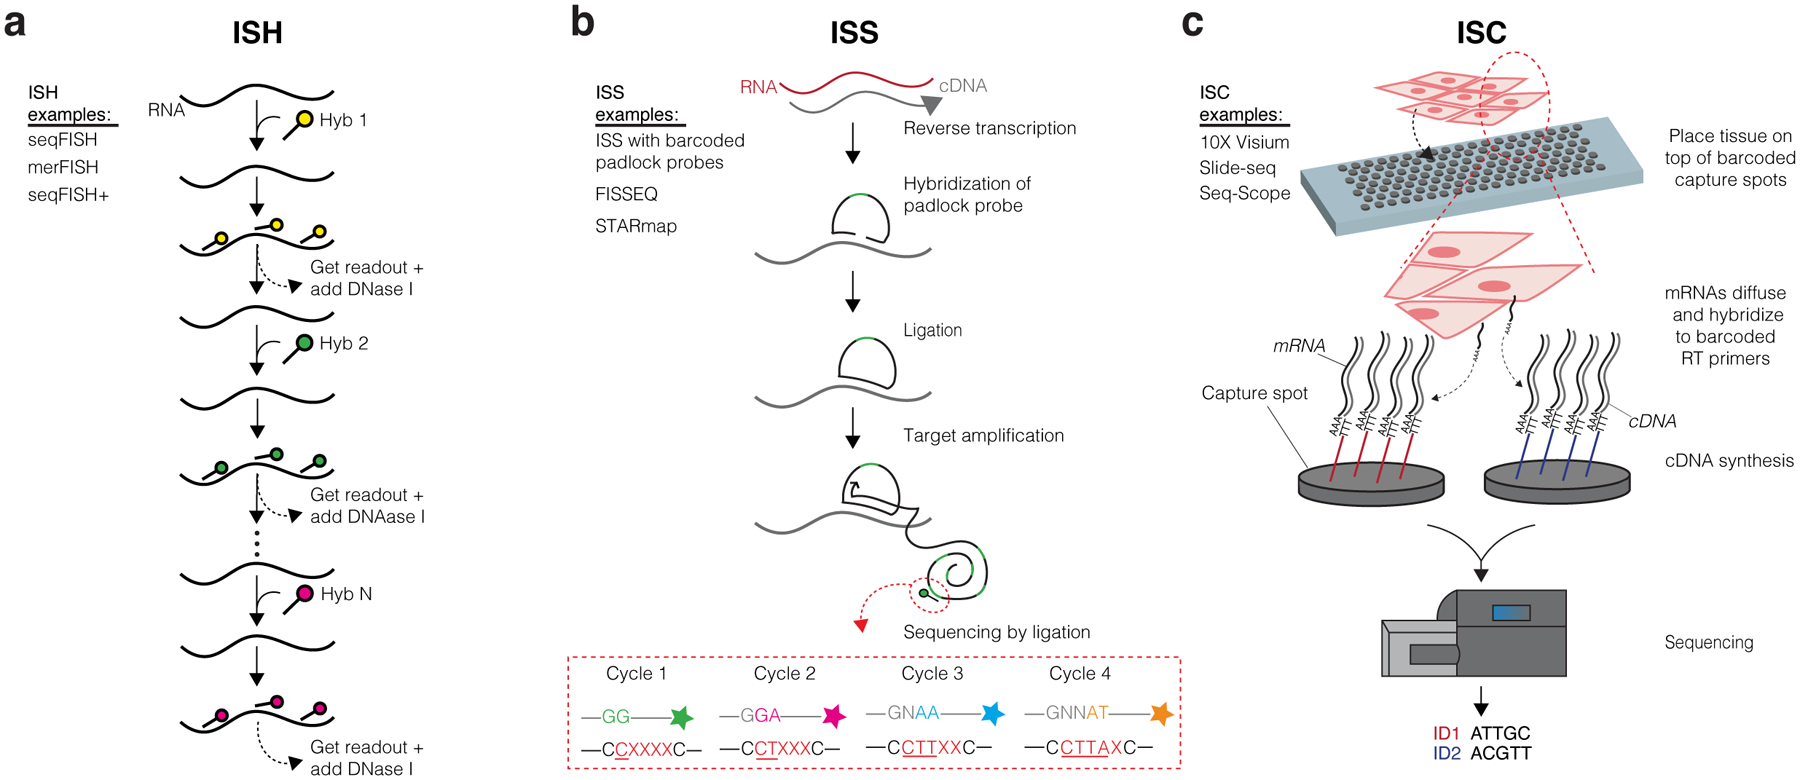
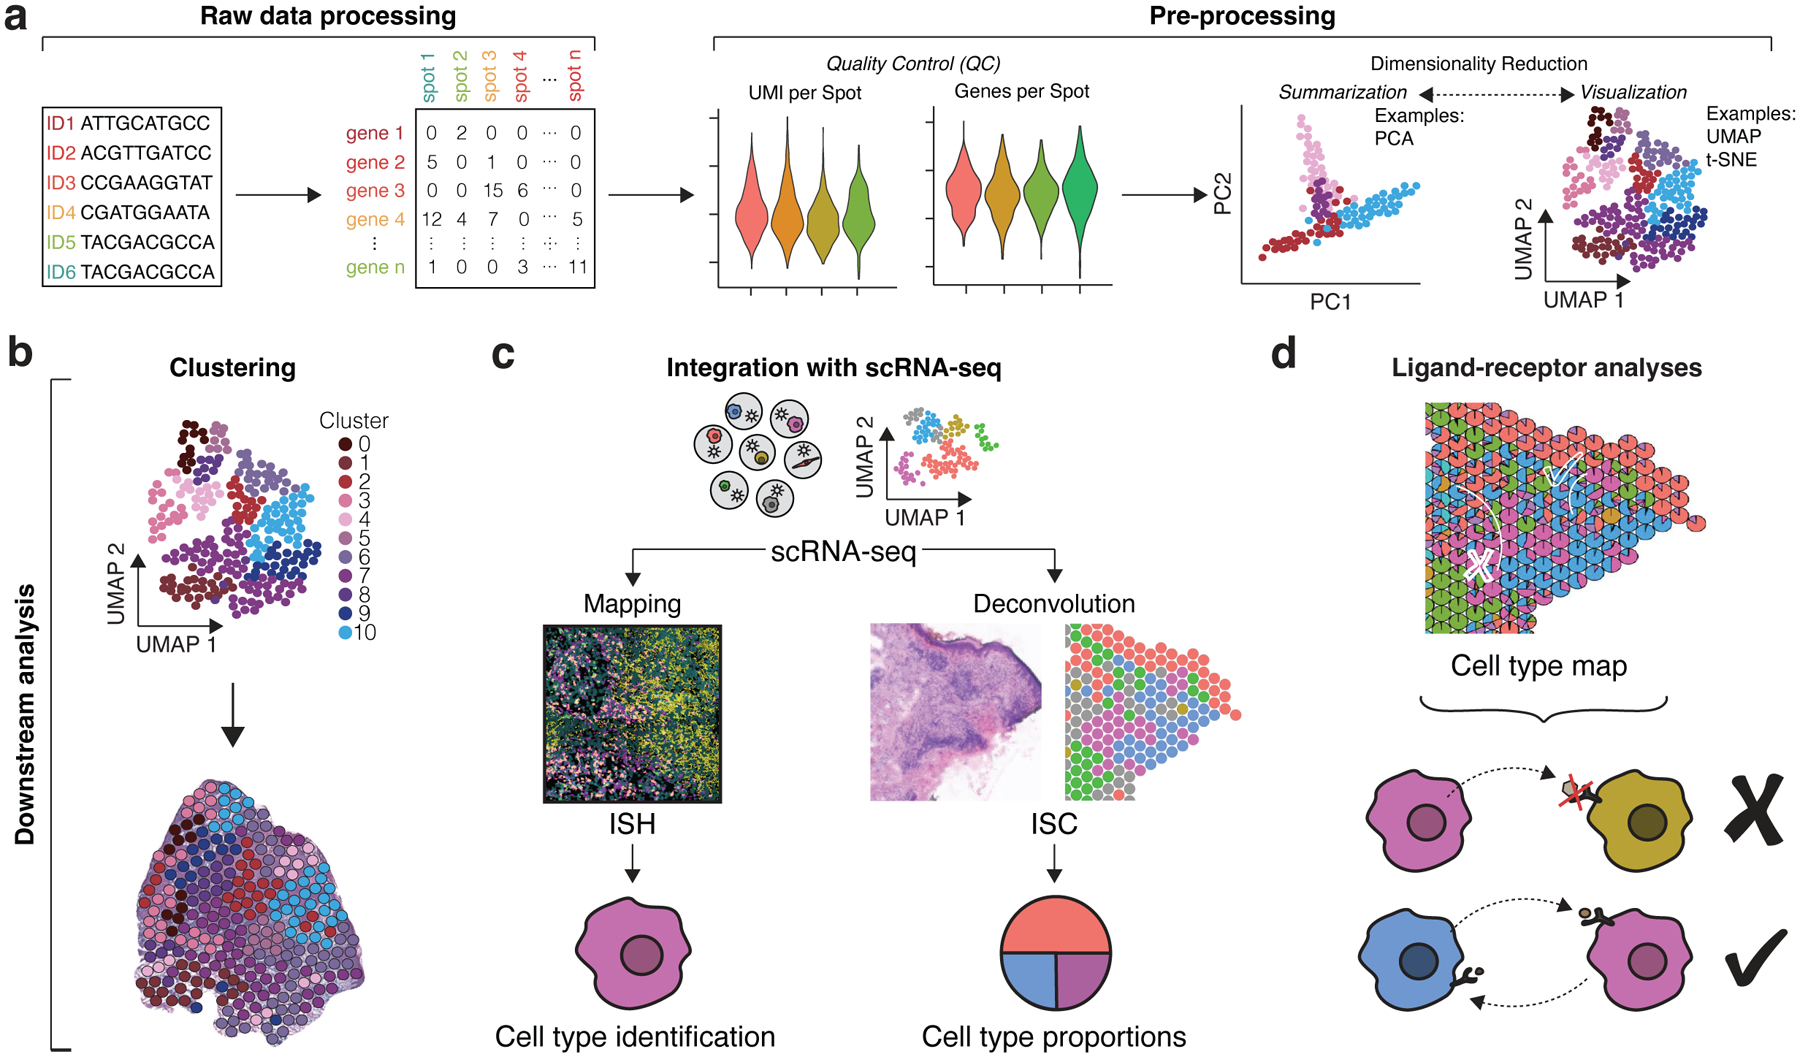
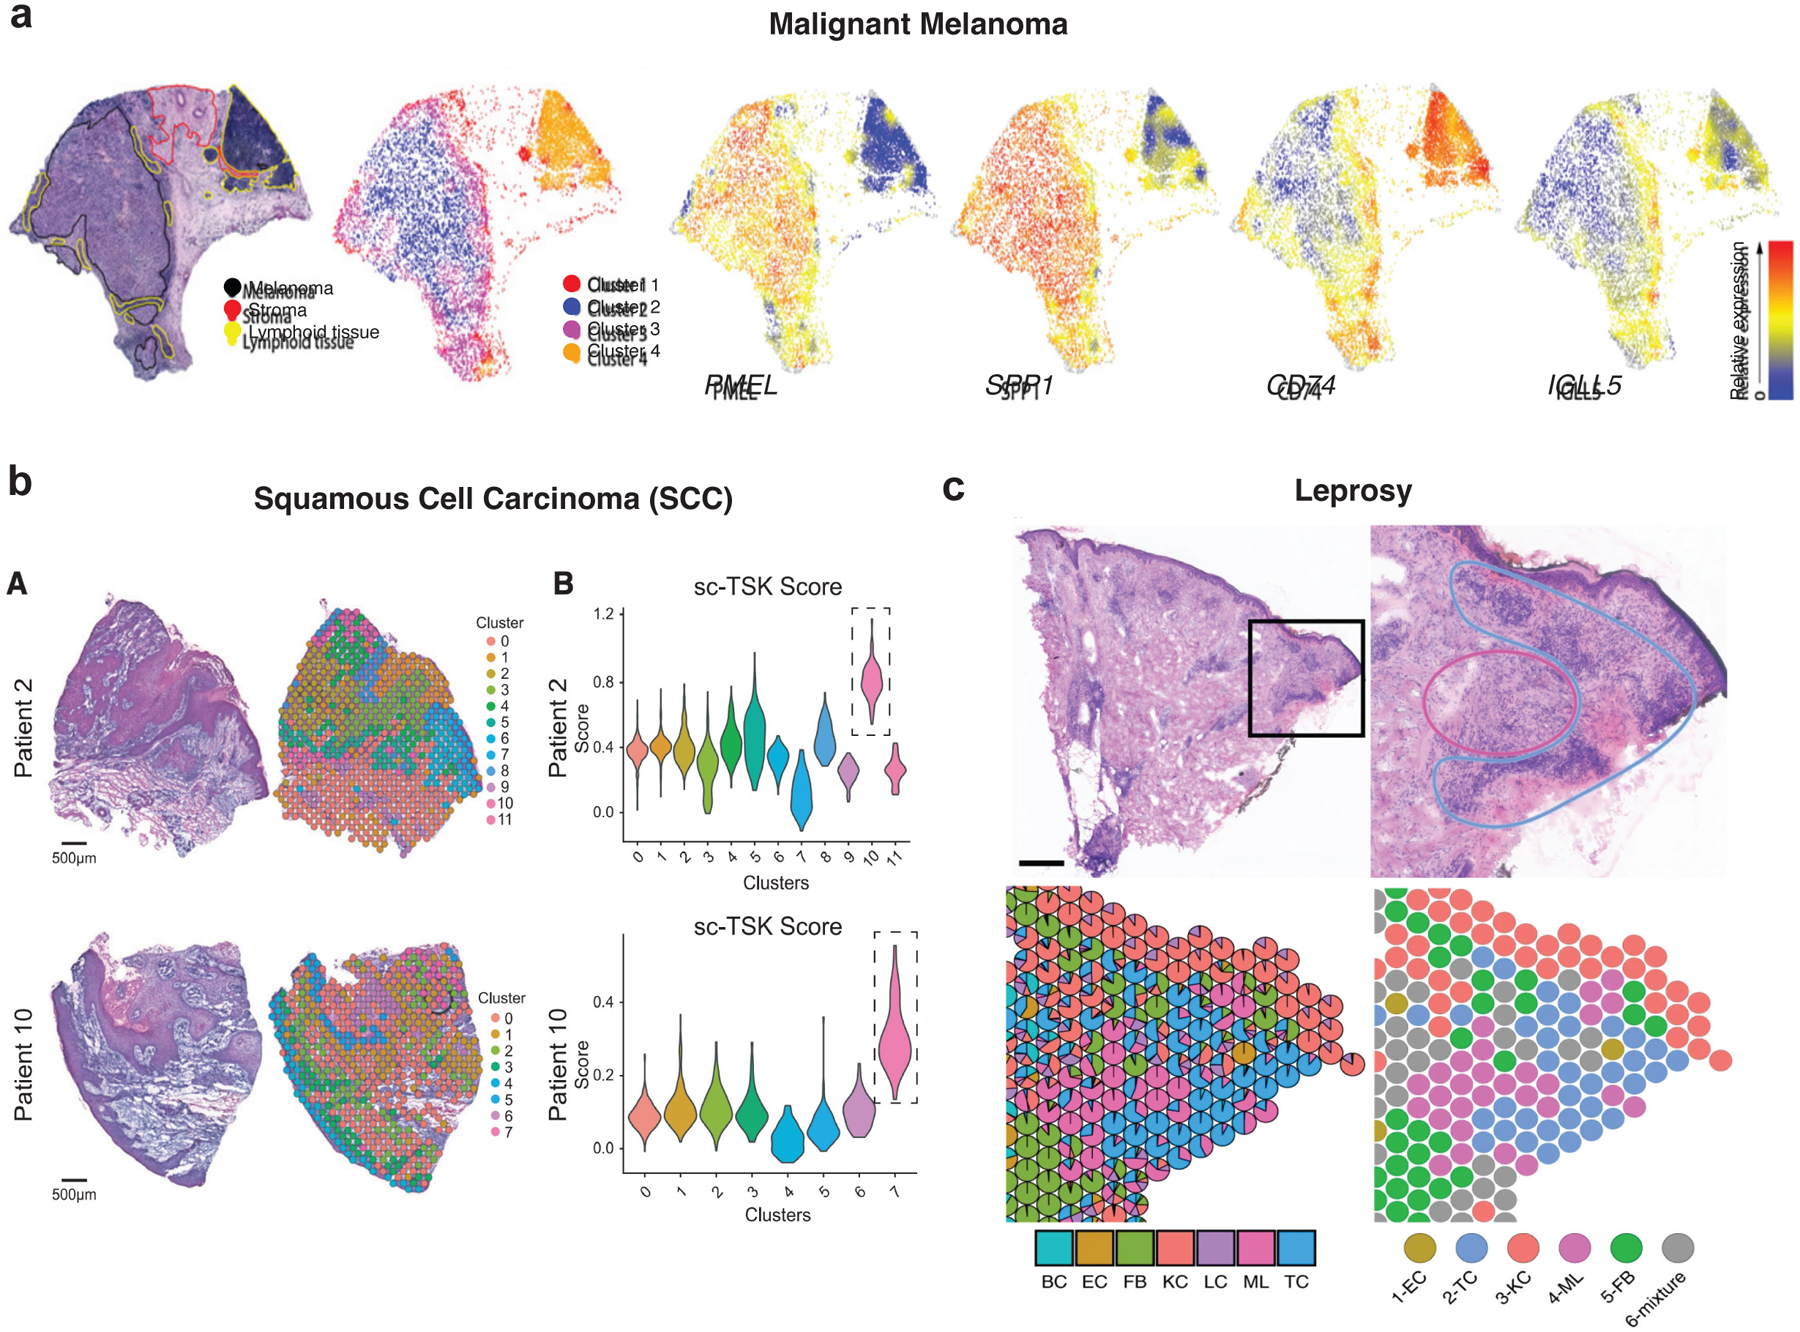
Transcriptome profiling of tissues and single cells facilitates interrogation of gene expression changes within diverse biological contexts. However, spatial information is often lost during tissue homogenization or dissociation. Recent advances in transcriptome profiling preserve the in situ spatial contexts of RNA molecules and together comprise a group of techniques known as spatial transcriptomics (ST), enabling localization of cell types and their associated gene expression within intact tissues. In this paper, we review ST methods; summarize data analysis approaches, including integration with single-cell transcriptomics data; and discuss their applications in dermatologic research. These tools offer a promising avenue toward improving our understanding of niche patterning and cell‒cell interactions within heterogeneous tissues that encompass skin homeostasis and disease.


Conflict of interest statement

Conflict of Interest

The authors declare no conflicts of interest.

Figures

Figure 1.
Figure 1.. Overview of ST Technologies.
(a) In situ hybridization (ISH) methods detect specific target genes via use of fluorophore-labeled probes. Signals from probes targeting short sequences of transcripts are propagated by consecutive rounds of hybridization, imaging, and probe stripping. The steps depicted specifically follow seqFISH methods. (b) In situ sequencing (ISS) methods typically involve the hybridization and ligation of a barcoded padlock probe complementary to the RNA or cDNA of a target gene. Multiple rounds of target amplification and sequencing by ligation then allow for spatial resolution of the distinct target gene. The steps depicted specifically follow the ISS with barcoded padlock probes method. (c) In situ capturing (ISC) methods use capture spots containing an array of RT primers with distinct positional barcodes and poly-T sequences to capture mRNA transcripts. Reverse transcription produces cDNAs that are extracted and sequenced using next generation sequencing. Positional barcodes are mapped to specific locations on the tissue and enable spatial visualization of the transcriptome. The steps depicted specifically follow 10X Visium methods.
Figure 2.
Figure 2.. Data Analysis Workflows.
(a) For ISC, raw sequencing data is processed into count matrices consisting of genes and capture spots (this step varies depending on ST technique as ISH/ISS involve converting fluorescent imaging signal into similar count matrices). Pre-processing of matrices involves obtaining quality control metrics such as distributions of UMIs per spot (counts per spot) and genes per spot as well as data normalization. Dimensionality reduction methods include summarization methods (PCA) and visualization methods (UMAP and t-SNE), which both seek to reduce gene expression data into fewer dimensions for more informative analysis. (b) Clustering groups similar spot transcriptomes, which can be transposed over the original tissue images for general interpretation. (c) Mapping and deconvolution combine scRNA-seq data with spatial transcriptomics data to localize cell subpopulations. Mapping typically uses ISH data to localize scRNA-seq profiles and predict specific cell types within the tissue. Deconvolution typically uses ISC data to infer cell type proportions per capture spot. (d) Cell type maps generated from mapping and deconvolution can be applied for ligand-receptor analyses. The proximity of cell types can help infer cell-cell communication events. (c) and (d) were adapted with permission from Ma et al., Nature Immunology 2021.
Figure 3.
Figure 3.. ST Applications in Dermatologic Research.
(a) ISC from lymph node biopsy of melanoma. Left, H&E staining with pathologic annotation and clustering. Lymphoid tissue occupies two clusters. Right, Spatial heatmaps of select highly-expressed and variable genes. Adapted with permission from Thrane et al., Cancer Research 2018. (b) Left, H&E staining and clustering of ISC spots in squamous cell carcinoma (SCC). Right, Violin plots of TSK scores of individual spots derived from scRNA-seq data (sc-TSK score) for each cluster. One spatial cluster within each sample demonstrates highest sc-TSK score (dotted boxes), highlighting areas occupied by this subpopulation. Reprinted from Ji et al., Cell 2020 under the CC BY 4.0 (https://creativecommons.org/licenses/by/4.0/legalcode). (c) Leprosy granuloma architecture and antimicrobial ecosystem. Top, H&E staining of a T-lep biopsy; bottom, cell type composition map showing myeloid cells in the granuloma center, while T cells and fibroblasts occupy the periphery. Scale bar: 0.5 mm. BC, B cell; EC, endothelial cell; FB, fibroblast; KC, keratinocyte; LC, Langerhans cell; ML, myeloid cell; TC, T cell. Reprinted with permission from Ma et al., Nature Immunology 2021.

Similar articles

Cited by

References

    1. Asp M, Bergenstråhle J, Lundeberg J. Spatially Resolved Transcriptomes—Next Generation Tools for Tissue Exploration. BioEssays. 2020;42(10):1–16 - PubMed
    1. Bergenstråhle L, He B, Bergenstråhle J, Andersson A, Lundeberg J, Zou J, et al. Super-resolved spatial transcriptomics by deep data fusion. bioRxiv. 2020;2020.02.28.963413 Available from: https://www.biorxiv.org/content/10.1101/2020.02.28.963413v1.full.pdf+html - DOI - PubMed
    1. Biancalani T, Scalia G, Buffoni L, Avasthi R, Lu Z, Sanger A, et al. Deep learning and alignment of spatially resolved single-cell transcriptomes with Tangram. Nat. Methods 2021; - PMC - PubMed
    1. Van Den Brink SC, Sage F, Vértesy Á, Spanjaard B, Peterson-Maduro J, Baron CS, et al. Single-cell sequencing reveals dissociation-induced gene expression in tissue subpopulations. Nat. Methods 2017;14(10):935–6 - PubMed
    1. Cang Z, Nie Q. Inferring spatial and signaling relationships between cells from single cell transcriptomic data. Nat. Commun Springer US; 2020;11(1):1–13 Available from: 10.1038/s41467-020-15968-5 - DOI - PMC - PubMed

Publication types

LinkOut - more resources