. 2022 May 4;42(18):3749-3767.
doi: 10.1523/JNEUROSCI.1506-21.2022. Epub 2022 Mar 24.

Tracing Modification to Cortical Circuits in Human and Nonhuman Primates from High-Resolution Tractography, Transcription, and Temporal Dimensions

Affiliations

Tracing Modification to Cortical Circuits in Human and Nonhuman Primates from High-Resolution Tractography, Transcription, and Temporal Dimensions

Christine J Charvet et al. J Neurosci. .

Abstract

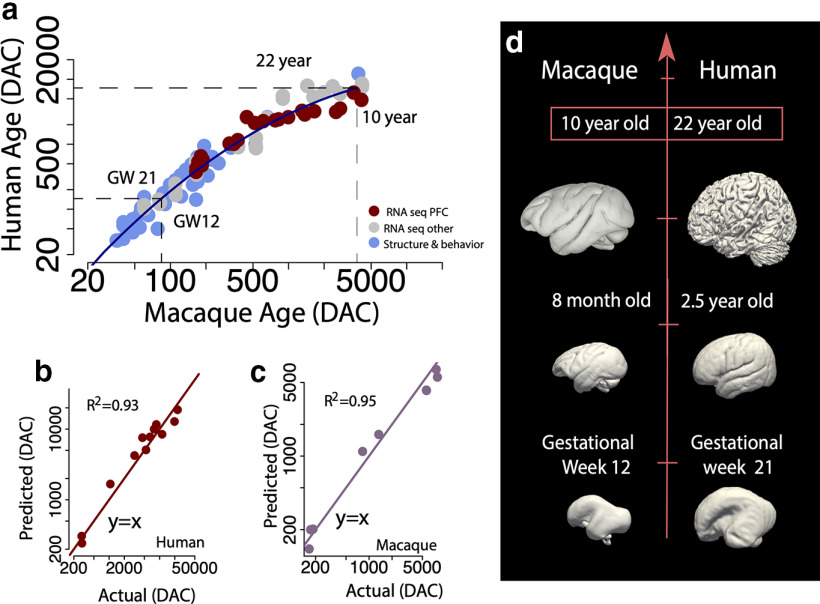
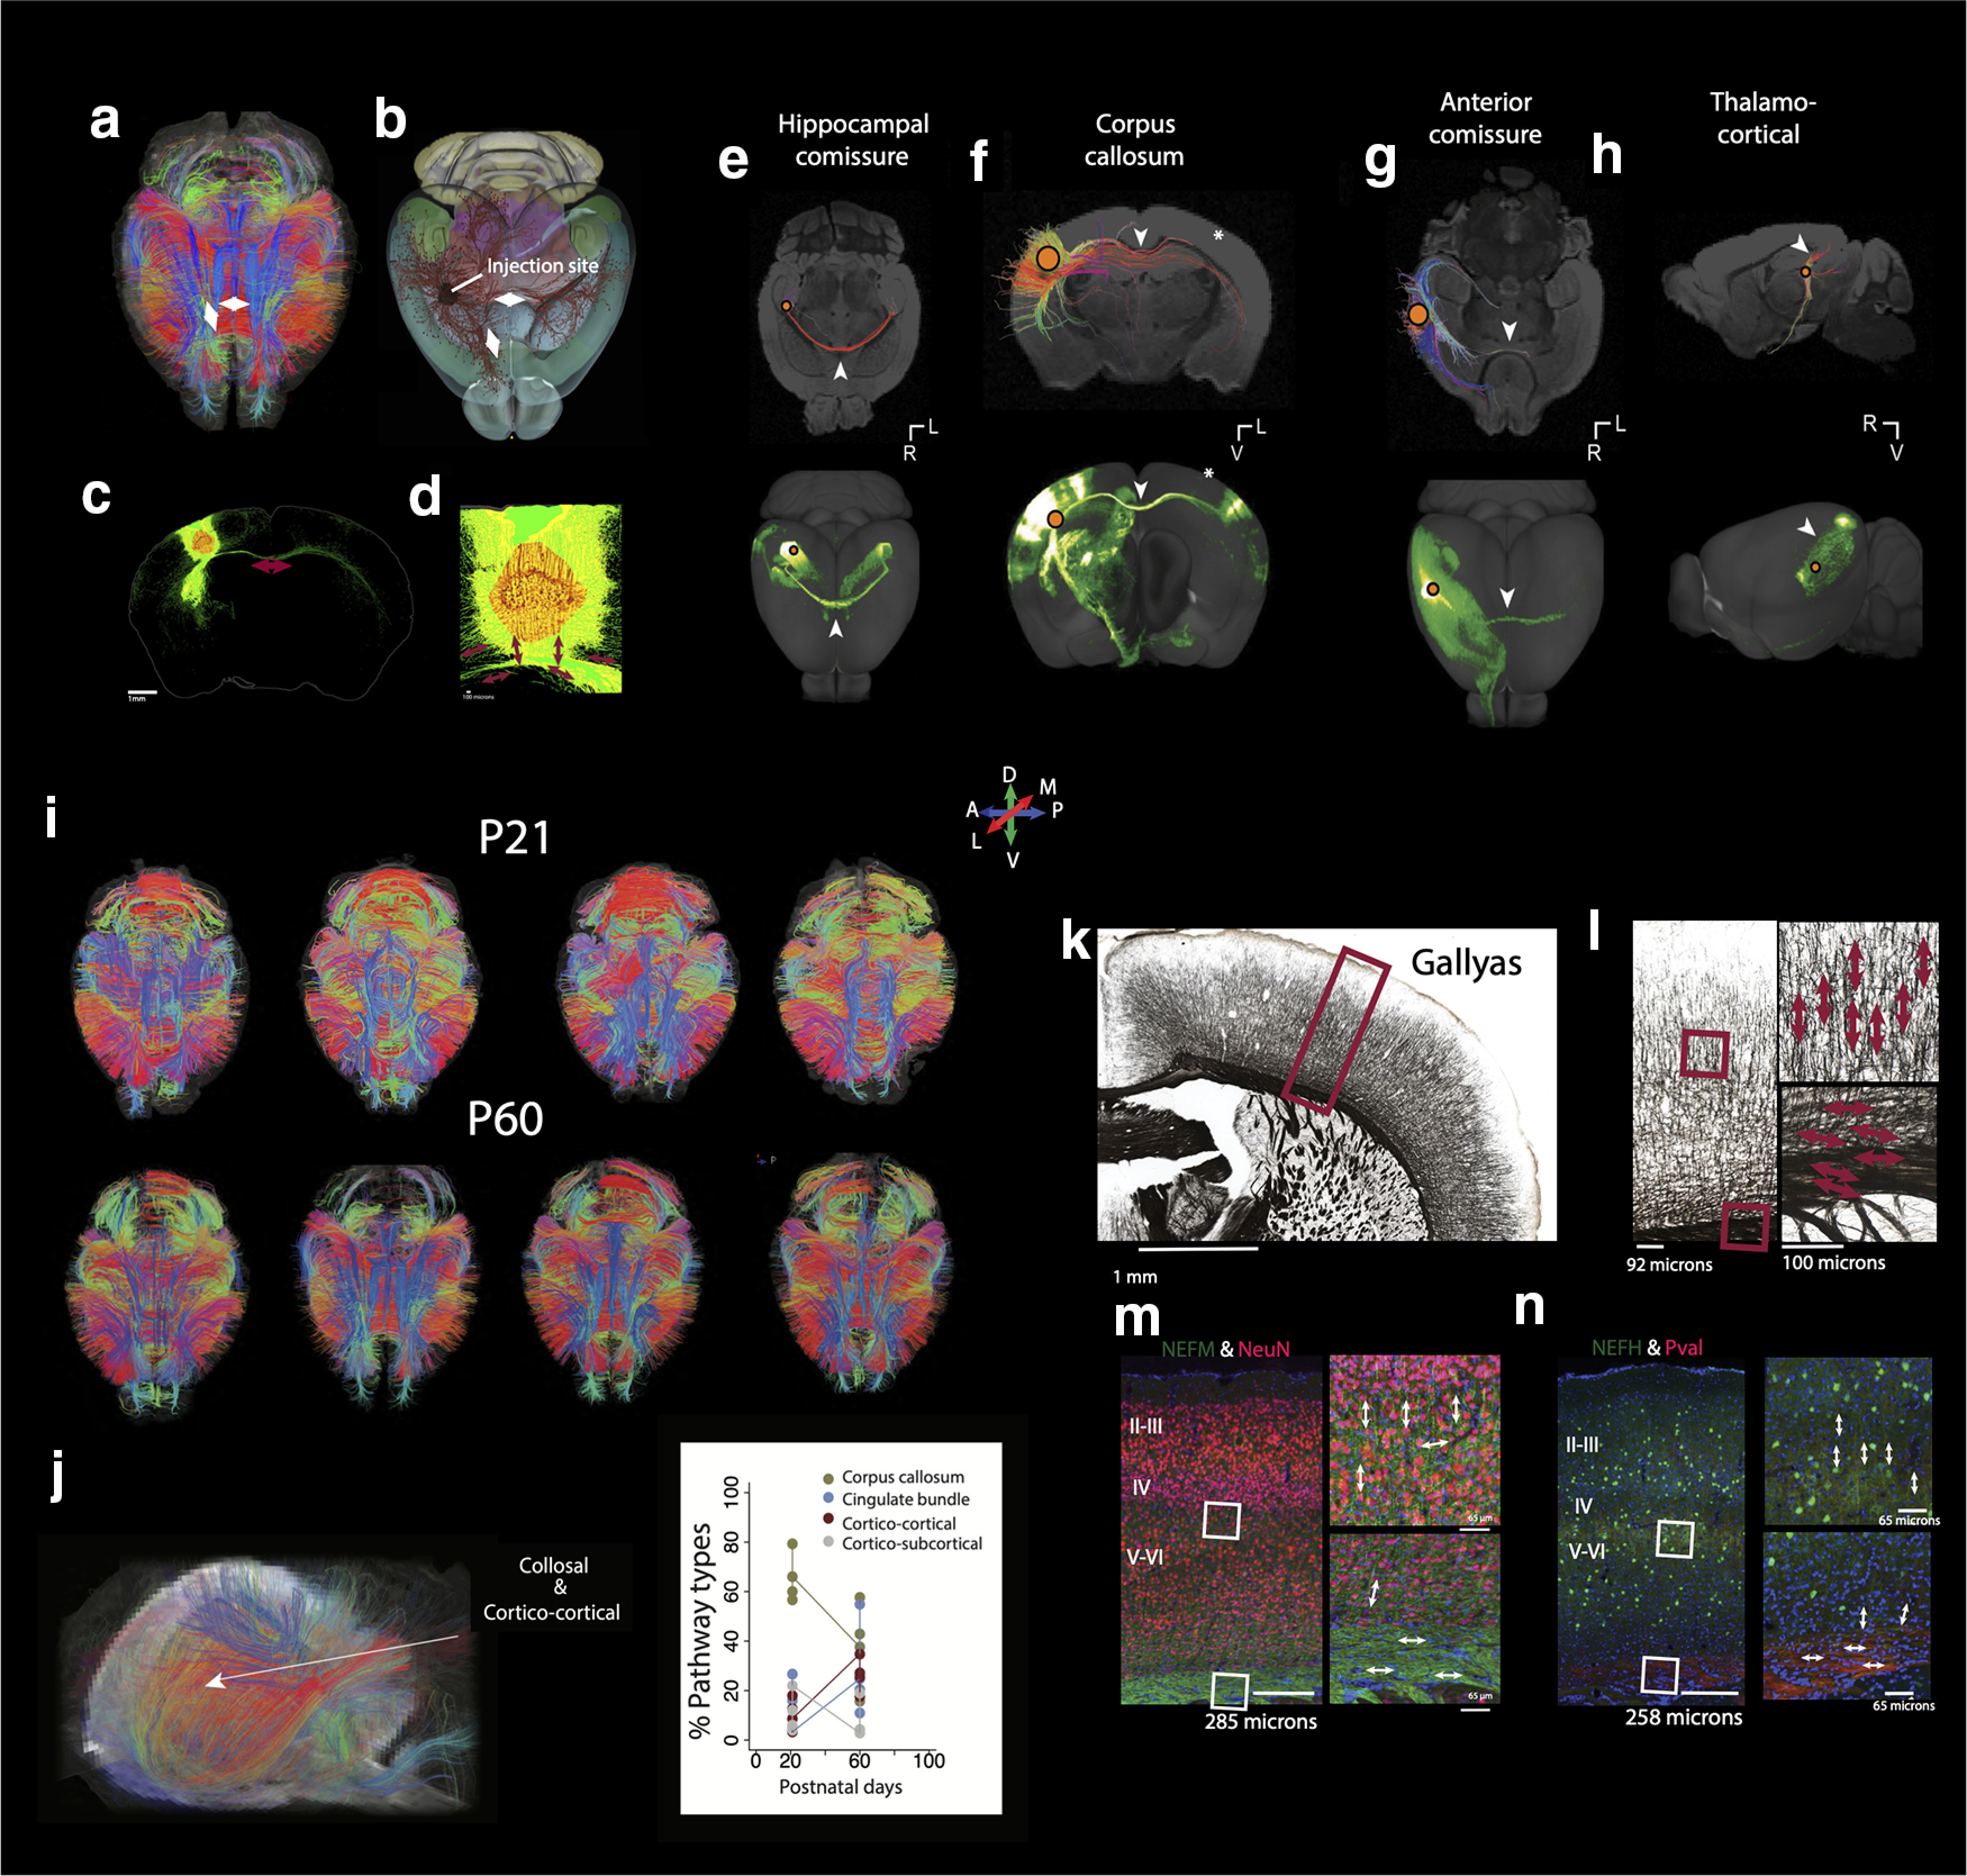
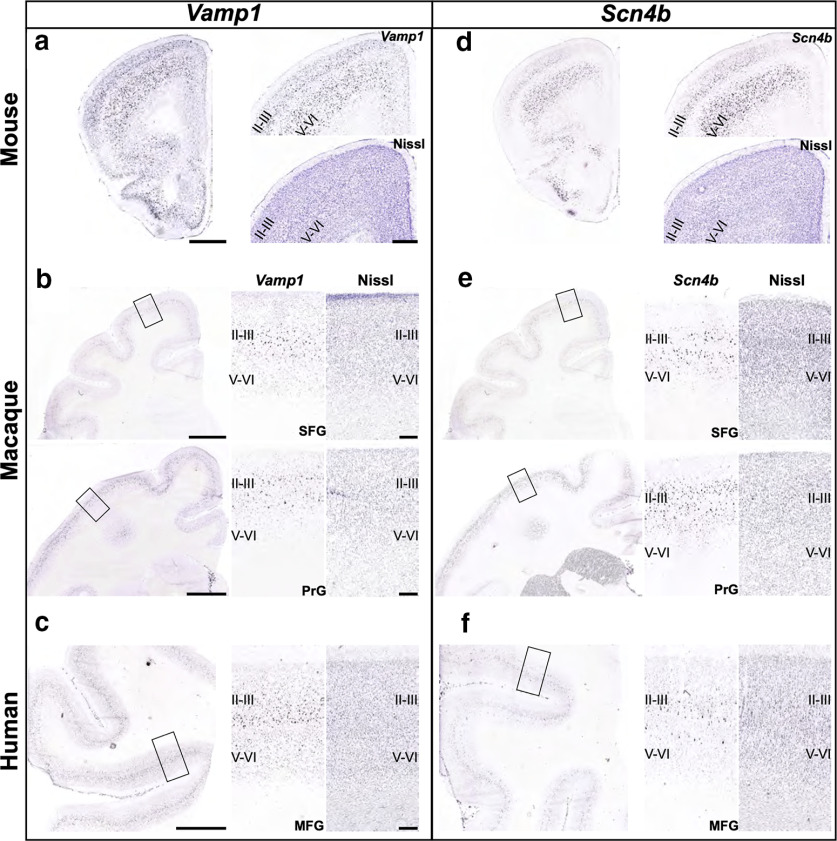
The neural circuits that support human cognition are a topic of enduring interest. Yet, there are limited tools available to map brain circuits in the human and nonhuman primate brain. We harnessed high-resolution diffusion MR tractography, anatomic, and transcriptomic data from individuals of either sex to investigate the evolution and development of frontal cortex circuitry. We applied machine learning to RNA sequencing data to find corresponding ages between humans and macaques and to compare the development of circuits across species. We transcriptionally defined neural circuits by testing for associations between gene expression and white matter maturation. We then considered transcriptional and structural growth to test whether frontal cortex circuit maturation is unusually extended in humans relative to other species. We also considered gene expression and high-resolution diffusion MR tractography of adult brains to test for cross-species variation in frontal cortex circuits. We found that frontal cortex circuitry development is extended in primates, and concomitant with an expansion in corticocortical pathways compared with mice in adulthood. Importantly, we found that these parameters varied relatively little across humans and studied primates. These data identify a surprising collection of conserved features in frontal cortex circuits across humans and Old World monkeys. Our work demonstrates that integrating transcriptional and structural data across temporal dimensions is a robust approach to trace the evolution of brain pathways in primates.SIGNIFICANCE STATEMENT Diffusion MR tractography is an exciting method to explore pathways, but there are uncertainties in the accuracy of reconstructed tracts. We broaden the repertoire of toolkits to enhance our ability to trace human brain pathways from diffusion MR tractography. Our integrative approach finds corresponding ages across species and transcriptionally defines neural circuits. We used this information to test for variation in circuit maturation across species and found a surprising constellation of similar features in frontal cortex neural circuits across humans and primates. Integrating across scales of biological organization expands the repertoire of tools available to study pathways in primates, which opens new avenues to study pathways in health and diseases of the human brain.

Keywords: cortex; development; evolution.


Figures

Figure 1.
Figure 1.
a, We identified corresponding ages between humans and macaques from abrupt and gradual changes in structural and transcriptional variation. We extracted corresponding time points by training a glmnet model to predict age from RNA sequencing data in humans and subsequently predicted ages from normalized gene expression in macaques. Ages are expressed in days after conception (DAC), unless otherwise noted. b, c, Models trained to predict age in each species have a high accuracy as evidenced by the strong correlation between predicted and observed values in humans (b) as in macaques (c). d, With these data, we identified corresponding ages across fetal and postnatal time points across humans and macaques. For example, a macaque at gestational week 12 (GW12) is equivalent to a human at GW21, and a 10-year-old macaque is equivalent to a 22-year-old human. We then addressed whether the development of FC circuits is protracted in humans relative to macaques after controlling for variation in developmental schedules. Smooth surfaces of MR scans are from multiple sources (Shi et al., 2011; Rohlfing et al., 2012; Miller et al., 2014; Bakker et al., 2015; Ding et al., 2016; Reveley et al., 2017; Liu et al., 2020; Extended Data Tables 1-1, 1-2). The ages in d do not correspond exactly to the labeled age.
Figure 2.
Figure 2.
ac, We tested whether trajectories in SE gene expression are extended in humans relative to macaques after cross-species age alignment. We mapped age in macaques to that of humans, and we tested whether the temporal trajectories of SE genes in the FC are significantly different relative to other cortical areas in humans and macaque. a, Correlation coefficients from the FC are not significantly different from other cortical areas. b, c, SE gene expression of NEFH and VAMP1 in the dorsolateral frontal cortex of humans and macaques overlap extensively in the two species. dh, We also used LRP markers to test for variation in the development of FC circuitry relative to other cortical areas (dh) in humans and macaques. f, We fit a smooth spline through normalized gene expression versus age in humans and macaques as exemplified in the primary motor cortex (M1C). We then extracted normalized gene expression from smooth splines at corresponding ages across humans and macaques (n = 10). Two example genes (NRGN, RGS4) are shown (f). g, h, We correlated the expression of LRP markers across humans and macaques for each cortical area and tested for differences in correlation coefficients (g) and significance tests (h). No significant differences in correlation coefficients are observed between the FC and other cortical areas. We find conservation in the developmental time course of LRP marker expression in the human FC relative to macaques (Extended Data Table 2-1). i, k, We also evaluated PCA, read numbers, age ranges, and replicates across RNA sequencing datasets Liu et al. (2016; i), Zhu et al. (2018; j), and the BrainSpan Atlas of the Developing Human Brain (Li et al., 2018; k). PCAs on log10-transformed RPKM samples cluster primarily by species with no obvious outliers. i, j, Age ranges and number of reads overlap across datasets. Scatter plots of log10-transformed RPKM values from biological replicates show that variance in expression decreases with increasing expression. A1, Primary auditory cortex; DFC, dorsolateral frontal cortex; IPC, inferior parietal cortex; ITC, inferior temporal cortex; MFC, medial frontal cortex; OFC, orbitofrontal cortex; S1C, primary somatosensory cortex; STC, superior temporal cortex; ITC, inferior temporal cortex; VFC, ventral frontal cortex; V1, primary visual cortex.
Figure 3.
Figure 3.
Temporal variations in SE gene expression in humans and macaques are very similar in the two species once cross-species age alignment, Data are from Zhu et al. (2018). a, We extracted normalized gene expression at corresponding time points across cortical areas and correlated normalized gene expression across species. Here, age in macaques is translated to humans according to Figure 1. b, Significance tests overlap extensively across areas, which indicate that temporal profiles in SE genes are very similar in humans and macaques. c, Indeed, temporal profiles in SE gene expression (e.g., NEFH, VAMP1, CRYM) from the orbitofrontal cortex (OFC), ventral frontal cortex (VFC), and primary visual cortex (V1) appear highly similar in humans and macaques. Together, these data show a lack of evidence for protracted development in FC circuits in humans relative to macaques. d, In situ hybridization images show the expression of select genes, including myelin basic protein (MBP), NEFH, and VAMP1, increases postnatally in humans. MBP, NEFH, and VAMP1 expression is weak shortly after birth, but increases postnatally. Arrows point to large pyramidal neurons. These qualitative observations align with our computational analyses, which also show that the expression of these genes increases postnatally. In situ hybridization images are from the Allen Brain Institute. Images of NEFH and MBP expression are from the frontal cortex. VAMP1 expression is from the visual cortex. Abbreviations are the same as in Figure 2.
Figure 4.
Figure 4.
We compared the timeline in frontal and prefrontal cortex white matter growth across humans and macaques. a, b, The PFC white matter was defined as the white matter anterior to the corpus callosum as highlighted on a macaque template (Bakker et al., 2015; Calabrese et al., 2015). The red horizontal line illustrates the posterior boundary of the PFC white matter. c, We extracted epochs from growth trajectories in the PFC and FC white matter in humans and macaques and found that these time points align with other data points. d–g, We fit nonlinear regressions to capture the age at which the growth of the FC (d, e) and PFC (f, g) white matter ceases and when these volumes reach percentages of adult volumes. For example, PFC growth cessation occurs at ∼1.7 years of age in humans and 1 year of age in macaques. The choice of epochs was based on the age ranges from which volumetric data were available. h, We applied the same nonlinear regression on other data (Knickmeyer et al., 2010) to assess the range of variation in the timetable of PFCw growth across datasets. We first fit a smooth spline with the prefrontal cortex white matter (PFCw) volume versus age for males and another one for females. We subsequently fit another smooth spline through these data to average values across males and females. in, To test how sampling impacts the age of growth cessation, we subsampled the number of individuals and applied a nonlinear regression on the log-transformed PFCw volumes versus age expressed in days after conception in macaques and humans. We extracted the age in which PFCw growth cessation (i, l), the percentage of variance accounted for by the model (j, m), and significance tests (i.e., p values; k, n). e, The 95% confidence intervals show that the macaque PFCw ceases to grow between ∼0.6 and ∼1.3 years of age. j, k, m, n, These nonlinear regressions systematically account for a high percentage of the variance (approximately >70%; j, m) and are statistically significant (p < 0.05; k, n). These analyses show a lack of evidence for protracted FC development in humans (Extended Data Table 4-1, Table 4-2).
Figure 5.
Figure 5.
Some examples of the diffusion MR tractography of human brains in lateral, dorsal, and ventral views. The scans used in the study show consistency across individuals and imaging protocols. a–g, Whole brains (ad) and a left hemisphere (eg), some of which are also housed by the Allen Brain Institute, were scanned on a 3 T Siemens Tim Trio scanner at the Massachusetts General Hospital Athinoula A. Martinos Center for Biomedical Imaging (c, d). See Extended Data Table 5-1 for scan details. A 1-mm-thick horizontal slice filter set through the human brains show fibers coursing across the brain such as the cingulate bundle and the arcuate fasciculus. These data show consistent high resolution in fiber tracking, and consistency across individuals and scanning protocols. c, d, Two of the brains used from the Allen Brain Atlas. These scans vary in their resolution (isotropic: 1.2 and 0.9 mm, respectively). eg, A left hemisphere shown at different minimum length thresholds (e, 0 mm; f, 20 mm; and g, 50 mm). g, We visualized pathways at different thresholds to reveal fibers of various lengths coursing through the white matter such as the arcuate fasciculus. The color coding of tractography was based on a standard red-green-blue (RGB) code based on average fiber direction. A, Anterior; P, posterior; R, rostral; C, caudal; M, medial; L, lateral; D, dorsal; V, ventral.
Figure 6.
Figure 6.
Brain tractography shows pathways coursing through the brain of Old World monkeys used in the present study. a–g, Those include several macaques such as a rhesus macaque (ac, scanned with 120 directions; d, scanned with 60 directions), a crab-eating macaque (e), a toque macaque (f), and a Sykes monkey (g). The tractography is consistent across individuals. Slices set through the prefrontal cortex (c) and larger areas through the FC (c, h–k) capture fibers emerging from and terminating within the FC. These settings show that the FC is composed by a preponderance of pathways emerging and terminating within the FC. A minimum-length threshold (15 mm) was set for visualizations purposes only. Brain masks are overlaid on these pathways. The color coding of tractography is based on a standard red-green-blue (RGB) code based on fiber direction. A, Anterior; P, posterior; R, rostral; C, caudal; M, medial; L, lateral; D, dorsal; V, ventral.
Figure 7.
Figure 7.
a–i, k–n, We compared diffusion MR tractography of mouse brains (a) with tract-tracers (b–h), at different ages (P21 and P60; i), and histologic data (k–n) to evaluate the accuracy of the tractography. ROIs were used to capture well known pathways coursing through the white matter (b–d, primary somatosensory pathway; e, hippocampal commissure; f, corpus callosum; g, anterior commissure; h, thalamocortical fibers from the lateral geniculate nucleus to the primary visual cortex; white arrowheads). Tract-tracers injected in the primary somatosensory area (upper limb) show fibers radially aligned within the gray matter (a, b, white arrows). Fiber orientation determined from tract-tracers and tractography are concordant across methods within the white matter, but sharp turns at the gray matter–white matter boundary are associated with reduced accuracy of diffusion MR tractography (e, f). For example, an ROI set to capture the corpus callosum accurately tracks fibers coursing contralaterally but does not accurately trace fibers penetrating the gray matter (f, white star). We refrained from using end points within the gray matter as a basis for classification because of the potentially reduced accuracy of the tractography at the gray matter–white matter boundary. i, j, The tractography (i) and relative proportion of pathway types (j) are very similar across mice at P21 and P60 (j). k, l, Gallyas stains show myelinated axons course radially within the gray matter but course preferentially along the medial axis to the lateral axis in the white matter (red boxes, close-up views). m, n, Antibodies against neurofilament medium polypeptide (NEFM) and neurofilament heavy polypeptide (NEFH), which label neurons of small (m) and large (n) calibers, respectively, support these observations. NEFH+ and NEFM+ neurons are oriented radially within the gray matter but course across the medial to lateral axis in the white matter; white boxes highlight the close-up views shown in m and n of NeuN- and Pval-labeled neurons. These observations suggest that axons of either large- or small-caliber axons make a sharp turn at the gray matter–white matter boundary. Sharp turns at the gray matter–white matter boundary are associated with reduced accuracy of diffusion MR tractography. Tract-tracer data are from the Allen Brain Institute Mouse Connectivity Database (Extended Data Table 7-1).
Figure 8.
Figure 8.
a–k, We tested how tractography reconstruction, image resolution, and sampling impacts the tractography across mice (a-d), humans (e–k), and macaques (g–k). We considered how DTI and HARDI (a, b) impact pathway types in mice. We randomly selected voxels through the white matter, and we quantified the percentage of pathway types reconstructed with DTI and HARDI. a, b, Dorsal views show tracts reconstructed with HARDI (a) and DTI are similar (b). c, The relative percentages of pathway types reconstructed from DTI and HARDI from P60 mice strongly correlate (R2 = 0.89, p < 0.01, n = 16). d, We randomly subsampled voxels and computed the relative percentages of pathways coursing through the mouse FC and found that the relative number of pathway types is relatively invariant with respect to sample size. We considered how image resolution (900 µm vs 1.2 mm) impacts the pathway proportions in humans (e, f) and how direction number (60 vs 120) impacts pathway types in macaques (g, h). Pathway proportions vary little with sample size in humans (f) and macaques (h). The percentages of corticocortical (i), cortico–subcortical (j), and collosal pathways (k) are similar in humans and macaques regardless of sampled voxels used to classify pathways. Horizontal dashed lines and associated values show the relative mean pathway types per scanning parameters with varying sample size in humans and macaques. The percentages of pathway types are robust to variation in resolution and sampling. A minimum length threshold was set to 7.2 mm for humans, 5.8 mm for macaques, and 2 mm in mice for visualization purposes. This human brain is made available by the Allen Brain Institute (Ding et al., 2016). Ninety percent of the fibers are skipped to better visualize pathways in macaques. A, Anterior; P, posterior; M, medial; L, lateral; D, dorsal; V, ventral.
Figure 9.
Figure 9.
a–i, Tractography of macaque (a–c), human (d–f), and mouse brains (g–i). Pathways identified from randomly selected voxels include collosal fibers (b, e, h), U fibers (f), and long-range cortically projecting pathways (c, i). Fibers preferentially terminate within gyri in macaques and humans. j–s, We investigated how brain structure associates with biases in the termination of fibers in macaques. We evaluated fiber terminations on FA images of macaque brain scans. jm, Dashed lines at the intersection between the gray matter (GM) and white matter (WM) of FA images show that FA is particularly low (dark) at the gray matter–white matter boundary. FA varies across the cortex, with high FA within gyri (i.e, high likelihood of fiber crossing) and low FA toward sulci (low likelihood of fiber crossing). Spheres capturing fibers through the white matter show that fibers preferably penetrate the cortex within gyri. n–s, Close-up views through select cortical areas show that fibers preferentially penetrate the gray matter at areas of high FA (os, blue arrowheads) rather than low FA (red arrowheads). These observations suggest that fibers penetrating gyri may be overrepresented at the expense of those closer to sulci because of increased uncertainty in tracking fibers penetrating sulci. It is because of these kinds of uncertainties in the tractography that the classification of pathways is not constrained by their precise termination of fibers within the gray matter but is focused instead on their orientation within the white matter. FA images and tractography are from the study by Calabrese et al. (2015). a, b, Brain pathways for macaques (a) and humans (b) are partially transparent.
Figure 10.
Figure 10.
a–f, j–s, Analysis of pathways with tractography (a–f), and cytoarchitecture (j–s) reveal modifications in adult FC circuits across humans, macaques, and mice. a–f, The diffusion MR scans identify pathways coursing through the brain. c, Brain tractography in humans with variable minimum length thresholds (0, 20, and 40 mm) reveal different pathways across the cortex. In particular, there appears to be a preponderance of short fibers within the FC, as evidenced by a lack of tracts within the anterior cortex (white arrowheads) when 20 or 40 mm minimum length thresholds are set. d, Horizontal slices (1 mm wide) show pathways coursing across the white matter, some of which span the FC (e.g., cingulate cortex, arcuate fasciculus; arrowheads). e, f, Diffusion MR scans of macaque (e) and mouse (f) brains were also used to classify pathway types. g–j, Percentage of pathway types in the FC white matter of humans, macaques, and mice show that the relative percentage of corticocortical pathways is significantly greater in humans and macaques compared with mice (*p < 0.05). h, i, No significant differences in pathway type are detected between humans and macaques whether we consider the PFC (h), or the rest of the FC (i). j–k, The relative thickness of layer II–III, as defined by CALB1 expression and Nissl stains, is significantly greater in the primate FC compared with mice but not between humans and macaques. This is true whether we consider the anterior cingulate cortex (AC) or the superior frontal gyrus (SFG). Details of these data are in Extended Data Tables 10-1, 10-2, 10-3, and 10-4. lo, PCAs were used to test whether transcriptional profiles of LRP or SE genes differ between humans and macaques. A PCA of orthologously expressed genes (m) shows that samples cluster by species but PCAs of expressed SE genes (n) and LRP markers (o) show that macaque samples cluster with those of humans and chimpanzees. These observations support the notion that transcriptional profiles of LRP neurons are highly similar between humans and macaques. p–s, CRYM (an SE gene) expression is higher in supragranular layers of humans and macaque SFG compared with mice (arrowheads). s, The expression of CRYM is significantly higher in primate supragranular layers compared with the FC of mice, but no significant differences were observed between humans and macaques. This is true whether we compare the mouse FC with the anterior cingulate cortex (AC), the SFG, or the precentral gyrus (PG) of macaques and humans. Humans and macaques share a constellation of conserved features in FC neural circuits.
Figure 11.
Figure 11.
We identified 250 LRP markers by systematically testing for variation in transcription and myelination across cortical areas. a, We considered gene expression across multiple areas and datasets as highlighted on a schematic of a human brain (Liu et al., 2016; Zhu et al., 2018). b, c, We used a single-cell RNA sequencing dataset where clusters of cell populations are defined with tSNE (t-distributed stochastic neighbor embedding) distributed stochastic neighbor embedding (Bakken et al., 2020) to filter candidate genes by cell type. c, LRP markers include genes that are expressed by layer II–III neurons but not those expressed by non-neuronal cells. d, We extracted MWF values from equations of different lobes. eg, We fit a smooth spline through the log10(RPKM) values versus age expressed in days after conception (DAC) to extrapolate normalized gene expression. We tested for associations between myelination and gene expression across areas and datasets. Two examples of association are shown in e (for the PFC) and f (for the MFC) using the data (Liu et al., 2016; Li et al., 2018). We selected significant and positive (slope, >0) associations after correcting for multiple testing (BY test, p < 0.05). g, LRP markers (e.g., NEFH, NRGN, RGS4, CAMK2A) are expressed by pyramidal neurons (arrows) in the frontal cortex and other cortical areas. Boxes indicate regions shown in higher-power views. AC, Anterior cingulate, T, temporal; A1, primary auditory cortex; DFC, dorsolateral frontal cortex; IPC, inferior parietal cortex; ITC, inferior temporal cortex; MFC, medial frontal cortex; M1C, primary motor cortex; OFC, orbitofrontal cortex; S1C, primary somatosensory cortex STC, superior temporal cortex; VFC, ventral frontal cortex; V1, primary visual cortex. Details of these data and results from these analyses are in Extended Data Tables 11-1, 11-2, and 11-3.
Figure 12.
Figure 12.
Expression of the SE genes Vamp1 and Scn4b in the FC of mice, macaques, and humans. In situ hybridization and corresponding Nissl stains are from the Allen Institute for Brain Science. a–f, Vamp1 (ac) and Scn4b (df) expressions in coronal sections through the FC of a mouse at P56 (a, d), a macaque at 48 m (male; b, e), and an adult human (46-year-old male control; c, f). Vamp1 (a) and Scn4b (d) expressions in the mouse FC cortex region are shown, along with enlarged views and corresponding Nissl images. Both genes appear to be widely expressed throughout layers, including layers II–III. In macaques, the ISH signal was variable (n = 3). However, staining was observed in a region anterior to and within the motor cortex. Sections through these regions in the macaque, along with enlarged detail views, show VAMP1 (b) and SCN4B (e) expression in layers II–IV of the superior frontal gyrus (SFG) and precentral gyrus (PrG). The ISH signal was also variable in humans in the dorsolateral PFC (DL-PFC). A section through the middle frontal gyrus (MFG) in the DL-PFC shows that (c) VAMP1 and (f) SCN4B are expressed in layers II–III, similar to what is observed in macaques. In macaques and humans, VAMP1 and SCN4B appear preferentially expressed in layers II–III. In contrast, these genes are more widely expressed across layers in mice. All in situ hybridization and Nissl images were obtained from the Allen Institute for Brain Science. Scale bars: a, 1 mm and 500 µm; b, 5 mm and 500 µm; c, 5 mm and 500 µm.
Figure 13.
Figure 13.
Expression of CALB1 in cortical layers II–III of the FC across mice, macaques, and humans. a, Coronal sections through a P56 mouse cortex show that Calb1 is restricted to layers II–III. The enlarged detailed views show a region of the primary and secondary motor cortex. The anterior forceps of the corpus callosum (fa) is also shown. b, c, Calb1 expression in the FC of macaques (n = 3; b) and humans (n = 15; c) is similar and shows the expansion of cortical layers II–III in the two species. b, Sections through two regions of the FC (blue lines, schematic) of a macaque (48-m, male) show Calb1 expression and enlarged detailed views, with corresponding Nissl images, of several gyri: a, c, anterior cingulate gyrus (ACG); b, middle frontal gyrus (MFG); d, lateral orbital gyrus (LOrG). c, Sections and enlarged detailed views (with corresponding Nissl images) of three regions of the FC in a human (28-year-old male control; blue boxes, schematic) showing Calb1 expression in the following gyri: e, superior frontal gyrus (SFG); f, MFG; g, cingulate gyrus (CgG); and h, inferior frontal gyrus (IFG). All in situ hybridization and Nissl images were obtained from the Allen Institute for Brain Science. Schematics modified from the National Institutes of Health blueprint nonhuman primate (NHP) Atlas and the Allen Human Brain Atlas. Scale bars: a, 1 mm and 500 µm; b, 1 mm and 500 µm; c, 5 mm and 500 µm.
Figure 14.
Figure 14.
Variation in CRYM expression in the supragranular layers across the mouse, human, and macaque FC. CRYM in situ hybridization and Nissl data and modified atlas schematics are from the Allen Institute for Brain Science. a, In the mouse (P56, male), Crym is not expressed in the supragranular layers (II–III) of the cortex. Enlarged detailed views show the primary and secondary motor areas of the cortex. For these views, a corresponding Nissl image is also shown. b, By contrast, strong CRYM expression is observed in these cortical layers in humans (n = 4), as observed in sections of several gyri at different rostral–caudal levels of the FC (31-year-old male control). Enlarged detailed views show CRYM expression and corresponding Nissl staining in the superior frontal gyrus (SFG) and middle frontal gyrus (MFG), and the SFG and PrG (precentral gyrus) in a rostral and caudal region of the FC, respectively. Overall, CRYM expression is similar across the four human specimens analyzed. c, CRYM is also expressed in the supragranular layers in macaques (n = 3), similar to humans, although its expression is variable across cortical regions. In the specimen shown (48-m, male), for example, CRYM expression in the SFG and MFG in a rostral region of the FC appears to be weaker than in similar gyri in more caudal regions. This variation is consistent across the three specimens analyzed. CgG, Cingulate gyrus; fro, frontal operculum; fa, anterior forceps of the corpus callosum; MFG (blue in schematic); PrG (dark green); SFG (light green); STG, superior temporal gyrus. For others, we used legends available at the Allen Brain Map (https://portal.brain-map.org/). The following anatomic reference atlases were used: the Allen Mouse Brain Atlas, the National Institutes of Health Blueprint Non-Human Primate (NHP) Atlas, and the Allen Human Brain Atlas. Scale bars: a, 1 mm and 500 µm; b, 5 mm and 500 µm; c, 5 mm and 500 µm.
Figure 15.
Figure 15.
NEFH expression is greater in cortical layers II–III in the macaque compared with the mouse. Histological information from macaques (a) and mice (b–d) shows NEFH expression is greater in cortical layers II–III in the macaque (a) compared with mice (d–e). The expression of NEFH is of particular interest because it is expressed by large neurons thought to project over long distances. Spatial variation in NEFH expression can be used to make inferences about modifications to connectivity patterns. Somas of large layers II–III neurons are expected to project cross-cortically, whereas somas of neurons located in layers V–VI are expected to project subcortically. Accordingly, an increase in NEFH expression in layers II–III suggests an amplification of long-range cross-cortically projecting neurons. a, In macaques, NEFH expression is relatively high in layers II–III and V–VI across the frontal cortex. This is in contrast to mice, which have relatively thin layers II–III. d, e, We used Calb1 as a marker for layers II–III; the expression of Calb1 spans layers II–III in mice. NEFH mRNA (d) and protein expression (e) is high in layers V–VI but extremely low in layers II–III in mice. d–g, Close-up views through the mouse FC in d and e also show that NEFH mRNA (f) and protein (g) expression in layers II–III are particularly low in mice. In contrast, macaques show relatively stronger expression of NEFH protein in layers II–III across multiple frontal cortical areas (h–k) except for the cingulate gyrus (j). These qualitative observations demonstrate major modifications in frontal cortex circuits between macaques and mice. The increased NEFH expression in layers II–III of macaques relative to mice suggests an expansion in cross-cortically projecting FC neurons may have emerged early in primate evolution.

References

    1. Bakken T, et al. (2020) Evolution of cellular diversity in primary motor cortex of human, marmoset monkey, and mouse. BioRxiv. doi: 10.1101/2020.03.31.016972. 10.1101/2020.03.31.016972 - DOI
    1. Bakker R, Tiesinga P, Kötter R (2015) The scalable brain atlas: instant web-based access to public brain atlases and related content. Neuroinformatics 13:353–366. 10.1007/s12021-014-9258-x - DOI - PMC - PubMed
    1. Barbas H (1986) Pattern in the laminar origin of corticocortical connections. J Comp Neurol 252:415–422. 10.1002/cne.902520310 - DOI - PubMed
    1. Barbas H, Rempel-Clower N (1997) Cortical structure predicts the pattern of corticocortical connections. Cereb Cortex 7:635–646. 10.1093/cercor/7.7.635 - DOI - PubMed
    1. Bozek K, Wei Y, Yan Z, Liu X, Xiong J, Sugimoto M, Tomita M, Pääbo S, Pieszek R, Sherwood CC, Hof PR, Ely JJ, Steinhauser D, Willmitzer L, Bangsbo J, Hansson O, Call J, Giavalisco P, Khaitovich P (2014) Exceptional evolutionary divergence of human muscle and brain metabolomes parallels human cognitive and physical uniqueness. PLoS Biol 12:e1001871. 10.1371/journal.pbio.1001871 - DOI - PMC - PubMed

Publication types

LinkOut - more resources