. 2022 Apr;32(4):656-670.
doi: 10.1101/gr.275515.121. Epub 2022 Mar 24.

A hidden layer of structural variation in transposable elements reveals potential genetic modifiers in human disease-risk loci

Affiliations

A hidden layer of structural variation in transposable elements reveals potential genetic modifiers in human disease-risk loci

Elisabeth J van Bree et al. Genome Res. 2022 Apr.

Abstract

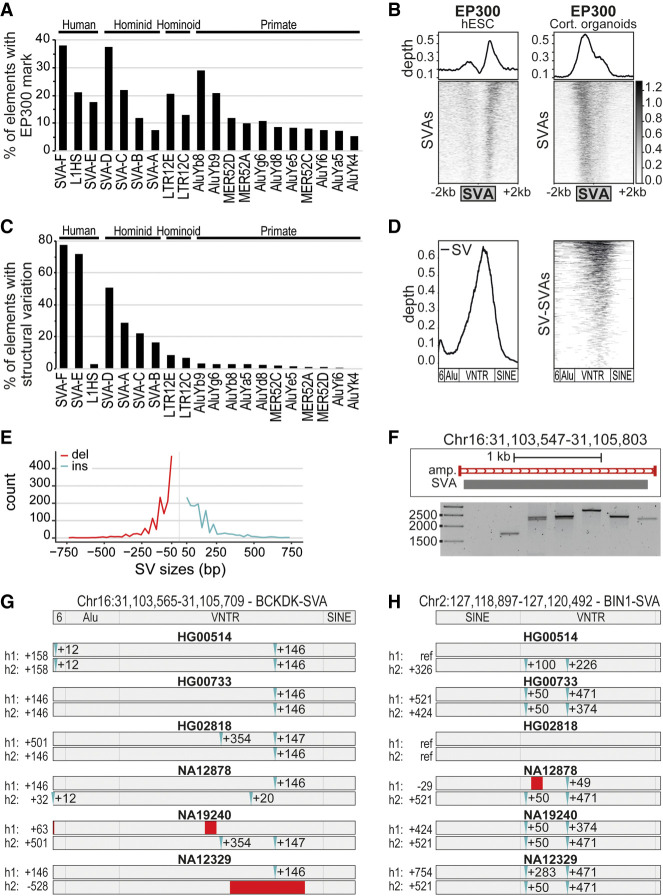
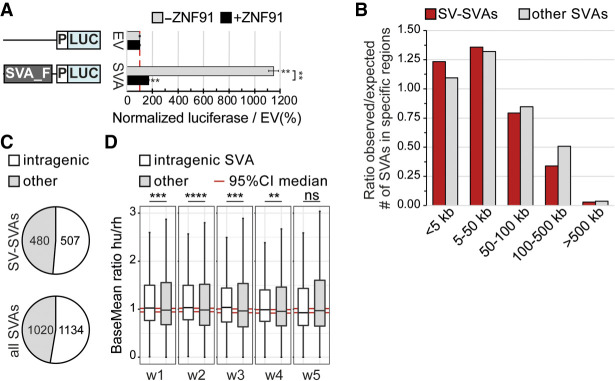
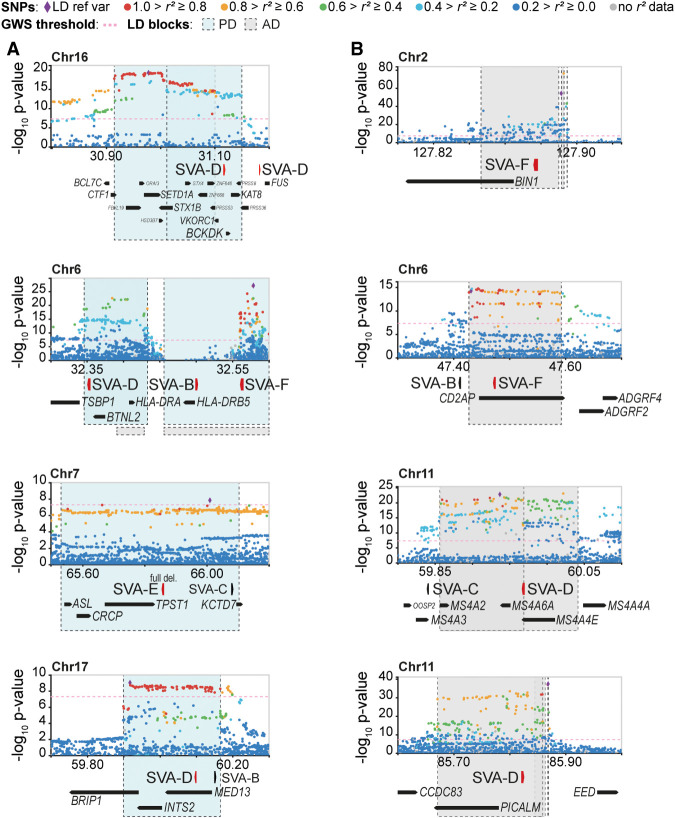
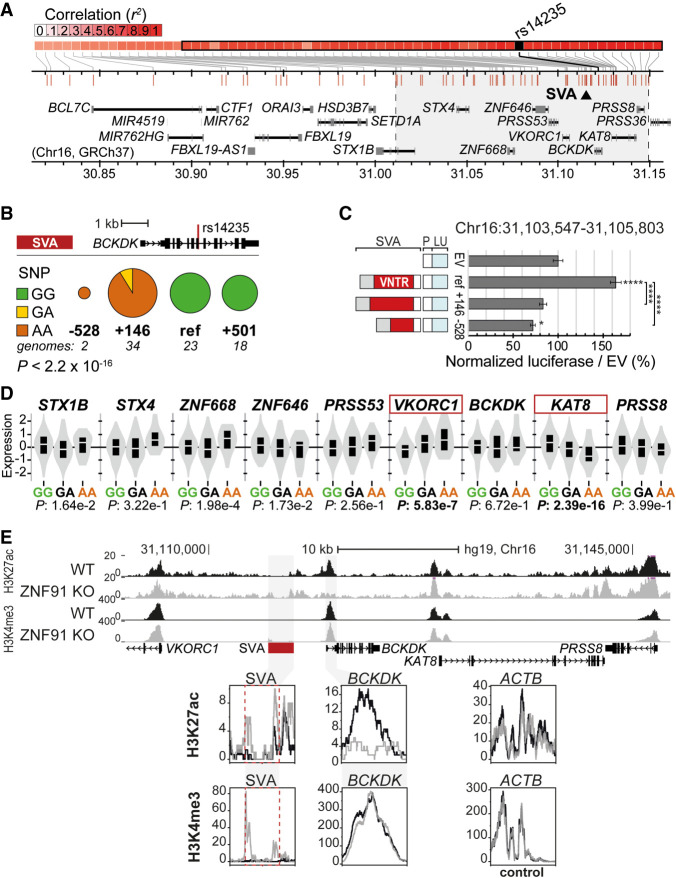
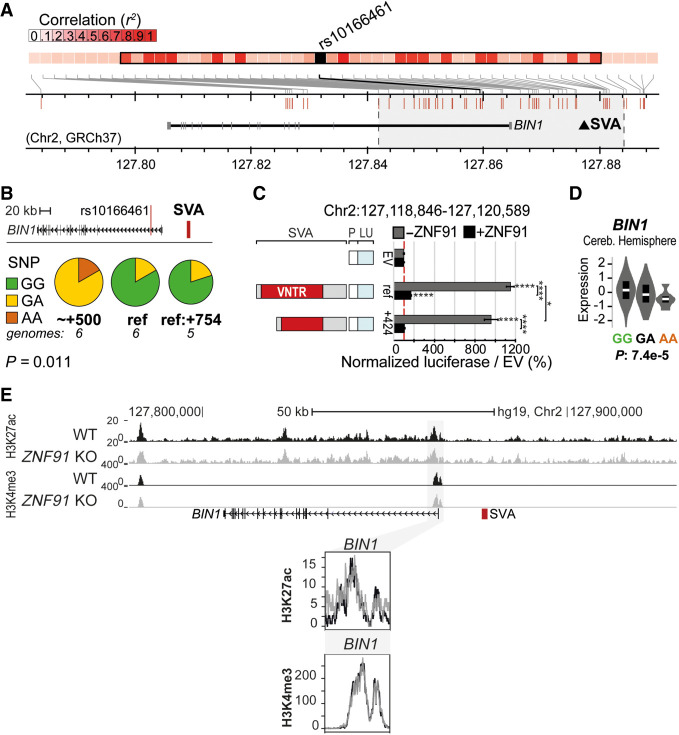
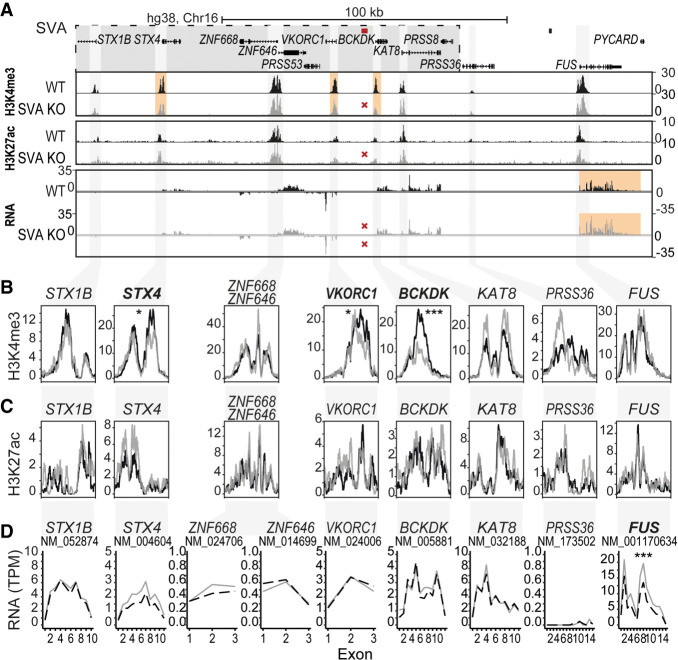
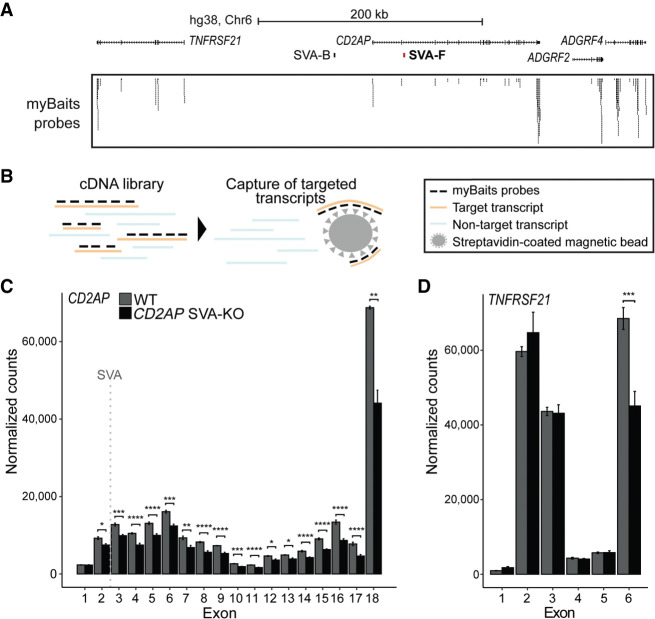
Genome-wide association studies (GWAS) have been highly informative in discovering disease-associated loci but are not designed to capture all structural variations in the human genome. Using long-read sequencing data, we discovered widespread structural variation within SINE-VNTR-Alu (SVA) elements, a class of great ape-specific transposable elements with gene-regulatory roles, which represents a major source of structural variability in the human population. We highlight the presence of structurally variable SVAs (SV-SVAs) in neurological disease-associated loci, and we further associate SV-SVAs to disease-associated SNPs and differential gene expression using luciferase assays and expression quantitative trait loci data. Finally, we genetically deleted SV-SVAs in the BIN1 and CD2AP Alzheimer's disease-associated risk loci and in the BCKDK Parkinson's disease-associated risk locus and assessed multiple aspects of their gene-regulatory influence in a human neuronal context. Together, this study reveals a novel layer of genetic variation in transposable elements that may contribute to identification of the structural variants that are the actual drivers of disease associations of GWAS loci.


Figures

Figure 1.
Figure 1.
SVAs are a major contributor to inter-individual structural variation. (A) Percentage of transposable elements with EP300 enhancer mark in cortical organoids; the top 20 enriched elements are shown. (B) Coverage heatmaps at full-length SVAs (GRCh37) in hESCs and cortical organoids for EP300 (hESCs: average of two replicates; cortical organoids: average of two biological and two technical replicates). Bottom gray box: average size SVAs. (C) Percentage of “full-length” TEs per class with structural variation based on Audano et al. (2019), grouped by the species they originated in. (D) Relative abundance of structural variation (left) and corresponding coverage heatmap (right) showing that most structural variation resides in the VNTR region of SVAs. Approximate SVA structure is shown below. (E) Distribution of structural variation (SV) sizes for insertions (ins) and deletions (del) in SVAs. (F) Example of structural variants for SVA in PCR-amplified region Chr 16: 31,103,547–31,105,803 (GRCh38 assembly). PCR-amplified region shown in red. (G,H) Schematic overview of SV-SVAs in phased assemblies of Ebert et al. (2021) of listed genomes for specified regions with approximate size shown. Estimated location of insertions (blue) and deletions (red) compared to reference genome.
Figure 2.
Figure 2.
SV-SVAs reside in gene-regulatory regions. (A) Luciferase activity of construct without (EV) and with an SVA element (SVA_F) upstream of a minimal promoter (P) in mESCs. N3n9, two-sided t-test with Bonferroni correction, (**) P < 0.01. Error bars: SEM. (B) Distribution of SV-SVAs (red) and non-SV-SVAs (gray) per distance to TSS. Only SVAs > 1 kb are shown. (C) Number of SV-SVAs and non-SV-SVAs that are intragenic is comparable (χ2(1, N = 2154) = 1.10, P = 0.29). Only SVAs > 1000 bp are shown. (D) Box plots showing base mean expression ratio (human/rhesus) for transcripts with an intragenic SVA in humans (white; 1151) and without (gray; 23,296) in ESC-derived cortical organoids of 1- to 5-wk old. Red line shows 95% CI of 10,000× bootstrapped median of transcripts without an SVA with sample size of 1151. Wilcoxon rank-sum test: (****) P < 0.0001, (***) P < 0.001, (**) P < 0.01, ns = not significant.
Figure 3.
Figure 3.
SV-SVAs reside in Parkinson's and Alzheimer's disease–associated LD blocks. (A,B) Regional SNP association plots with SV-SVAs (red) shown in LD blocks of PD (blue) (A) and AD (gray) (B). The associated SNPs (AD; de Rojas et al. 2021, PD; Nalls et al. 2019) are plotted with their respective meta-analysis genome-wide significant P-values (GWS [Genome-wide significance], P < 5 × 10⁻⁸; as −log10 values) and are distinguished by linkage disequilibrium (r2) of nearby SNPs on a blue to red scale, from r2 = 0 to 1, based on pairwise r2 values from the 1000 Genomes Phase3 (ALL) reference panel. Gene annotations: NCBI RefSeq Select database. Assembly GRCh37, scale in Mb.
Figure 4.
Figure 4.
Structurally variable SVA near BCKDK links to a disease-associated SNP and has the potential to differentially regulate nearby genes. (A) Overview of LD block for rs14235, with area r2> 0.8 highlighted in gray. Approximate location of SVA marked with black triangle. (B) rs14235 genotyping analysis for individuals homozygotic for BCKDK-SVA variants −600 (n = 2), ref (n = 23), +150 (n = 34), and +500 (n = 18). (Ancestral allele) G; (risk allele) A. Fisher's exact test: P < 2.2 × 10⁻¹⁶. (C) Schematic overview of luciferase constructs (P = minimal promoter, LU = luciferase gene) with BCKDK-SVA variants (Chr 16: 31,103,547–31,105,803 GRCh38), with corresponding luciferase activity in transfected mESCs. N3n9, except BCKDK-SVA ref (n = 8). One-way ANOVA with Tukey's multiple comparison, (****) P < 0.0001, (*) P < 0.05. Error bars: SEM. (D) Analysis of eQTL data in cortex for rs14235 for genes within the LD block with r2 > 0.8. Normalized expression is shown. Genes considered significant are shown in a red box. (E) KO of the SVA repressor ZNF91 lowers H3K27ac at the promoter of BCKDK and increases H3K4me3 methylation at the SVA near BCKDK in hESCs. ACTB shown as control enhancer region. (Top) Overview of locus, (bottom) magnification of regions of interest.
Figure 5.
Figure 5.
Structurally variable SVA near BIN1 links to a disease-associated SNP and has the potential to differentially regulate nearby genes. (A) Overview of LD block for rs10166461, with area r2 > 0.8 highlighted in gray. Approximate location of SVA marked with black triangle. (B) rs10166461 genotyping analysis for individuals homozygotic for BIN1-SVA variants ref (n = 6) and +424 or +521 (∼+500, n = 6) and heterozygotic for ref and +754 (n = 5). Ancestral allele = G, risk allele = A. Fisher's exact test: P = 0.0108. (C) Schematic overview of luciferase constructs (P = minimal promoter, LU = luciferase gene) with BIN1-SVA variants, with corresponding luciferase activity in transfected mESCs with and without ZNF91. Two-way ANOVA with Tukey's multiple comparison. (****) P < 0.0001, (*) P < 0.05. Error bars: SEM. (D) Analysis of eQTL data in cerebellar hemisphere for rs10166461 and BIN1. (E) KO of the SVA repressor ZNF91 does not influence H3K27ac and H3K4me3 at the promoter of BIN1 in hESCs. (Top) Overview of locus, (bottom) magnification of regions of interest.
Figure 6.
Figure 6.
SVA deletion alters the epigenome and nearby gene expression. (A) Overview of locus. LD block shown in gray box, location of SVA removed by CRISPR-Cas9 KO shown in red. (BD) Magnification of genes within a 200 kb region of deleted SVA. (B) H3K4me3 ChIP-seq, the mean of three replicates is shown. (C) H3K27ac ChIP-seq, the mean of three replicates is shown. (D) Mean expression of three replicates shown per exon for transcripts. Adjusted P-value of DESeq2 is shown for the whole transcript and ChIP peaks. (***) P < 0.001, (*) P < 0.05. Genes reaching statistical significance are indicated in bold.
Figure 7.
Figure 7.
Intronic SVA deletion alters exon expression of CD2AP gene. (A) Overview of CD2AP locus. Location of SVA removed by CRISPR-Cas9 KO shown in red. Probes from myBaits targeting CD2AP exons. (B) Schematic of capture of targeted transcripts with myBaits probes. (C,D) Normalized mean expression of three replicates shown per exon of CD2AP and the nearby highly expressed gene TNFRSF21. Location of SVA indicated with dashed gray line. Adjusted P-value from DESeq2 shown for each exon. (****) P < 0.0001, (***) P < 0.001, (**) P < 0.01, (*) P < 0.05.

References

    1. Afgan E, Baker D, Batut B, van den Beek M, Bouvier D, Čech M, Chilton J, Clements D, Coraor N, Grüning BA, et al. 2018. The Galaxy platform for accessible, reproducible and collaborative biomedical analyses: 2018 update. Nucleic Acids Res 46: W537–W544. 10.1093/nar/gky379 - DOI - PMC - PubMed
    1. Altschul SF, Gish W, Miller W, Myers EW, Lipman DJ. 1990. Basic local alignment search tool. J Mol Biol 215: 403–410. 10.1016/S0022-2836(05)80360-2 - DOI - PubMed
    1. Arnold M, Raffler J, Pfeufer A, Suhre K, Kastenmüller G. 2015. SNiPA: an interactive, genetic variant-centered annotation browser. Bioinformatics 31: 1334–1336. 10.1093/bioinformatics/btu779 - DOI - PMC - PubMed
    1. Audano PA, Sulovari A, Graves-Lindsay TA, Cantsilieris S, Sorensen M, Welch AE, Dougherty ML, Nelson BJ, Shah A, Dutcher SK, et al. 2019. Characterizing the major structural variant alleles of the human genome. Cell 176: 663–675.e19. 10.1016/j.cell.2018.12.019 - DOI - PMC - PubMed
    1. Backman JD, Li AH, Marcketta A, Sun D, Mbatchou J, Kessler MD, Benner C, Liu D, Locke AE, Balasubramanian S, et al. 2021. Exome sequencing and analysis of 454,787 UK Biobank participants. Nature 599: 628–634. 10.1038/s41586-021-04103-z - DOI - PMC - PubMed

Publication types

Substances