. 2022 Mar 24;14(6):2805-2818.
doi: 10.18632/aging.203976. Epub 2022 Mar 24.

Altered regional brain white matter in dry eye patients: a brain imaging study

Affiliations

Altered regional brain white matter in dry eye patients: a brain imaging study

Yun-Qing Luo et al. Aging (Albany NY). .

Erratum in

Abstract

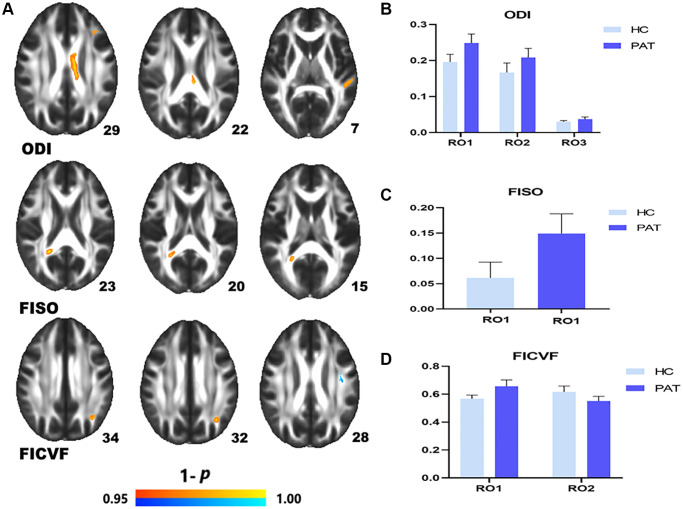
This study aimed to investigate the regional changes of brain white matter (WM) in DE patients using diffusion tensor imaging (DTI) and neurite orientation dispersion and density imaging (NODDI). A total of 25 dry eye patients (PAT) and 25 healthy controls (HC) were recruited. All subjects underwent DTI and NODDI, fractional anisotropy (FA), mean diffusivity (MD), radial diffusivity (RD), isotropic volume fraction (FISO), intra-cellular volume fraction (FICVF), and orientation dispersion index (ODI) were obtained respectively. Then complete Hospital Anxiety and Depression Scale (HADS), anxiety score (AS) or depression scores (DS) were obtained. Receiver operating characteristic (ROC) curve analysis was used to evaluate the reliability of DTI and NODDI in distinguishing the two groups. DTI revealed that PAT had lower FA in both the left superior longitudinal fasciculus (LSLF) and the corpus callosum (CC), and higher MD in the LSLF, the right posterior limb of the internal capsule and the right posterior thalamic radiation. PAT had significant AD changes in regions including the genu of the CC, the right posterior limb of internal capsule, and the right splenium of the CC. From NODDI, PAT showed increased ODI in the LSLF and increased FISO in the right splenium of the CC. FICVF showed a significant decrease in the LSLF while increased in the left anterior corona radiata and the CC. Furthermore, the average values of MD and FICVF were significantly correlated with DS and AS. Hence the results of this study suggest that there are regional changes in WM in DE patients which may contribute to further understanding of the pathological mechanism of DE.

Keywords: density imaging; diffusion tensor imaging; dry eye; neurite orientation dispersion; white matter.


Conflict of interest statement

CONFLICTS OF INTEREST: The authors declare no conflicts of interest related to this study.

Figures

Figure 1
Figure 1
Comparison of DTI value of HC and PAT group. Mean DTI values between PAT and HC groups (AC). (A) ROI1-left superior longitudinal fasciculus; ROI2-body of corpus callosum. (B) ROI1-left superior longitudinal fasciculus; ROI2-right posterior limb of internal capsule. ROI3-right posterior thalamic radiation. (C) ROI1-genu of corpus callosum; ROI2-right posterior limb of internal capsule; ROI3-right splenium of corpus callosum. Significant difference in mean DTI value between HC and PAT group. (D) The red area indicates that the value of PAT is higher than HC and blue areas indicate lower values. Abbreviations: FA: fractional anisotropy; MD: mean diffusivity; AD: axial diffusivity; HC: healthy controls; PAT: patient; ROI: region of interest.
Figure 2
Figure 2
Comparison of NODDI value of HC and PAT group. Mean NODDI values between PAT and HC groups (AC). (A) ROI1-left anterior corona radiata; ROI2-body of corpus callosum; ROI3-left superior longitudinal fasciculus. (B) Right splenium of corpus callosum. (C) ROI1-left posterior corona radiata; ROI2-left superior longitudinal fasciculus. Significant difference in mean NODDI value between HC and PAT group (D) The red area indicates that the value of PAT is higher than HC and blue areas indicate lower values. Abbreviations: ODI: orientation dispersion index; FISO: isotropic volume fraction; FICVF: intra-cellular volume fraction; HC: healthy controls; PAT: patient; ROI: region of interest.
Figure 3
Figure 3
ROC curve analysis of the mean DTI and NODDI values for altered brain regions. (A) The area under the ROC curve were 0.976, (p < 0.0001; 95% CI: 0.941–1.000) for left superior longitudinal fasciculus (FA); body of corpus callosum (FA) 0.960, (p < 0.0001; 95% CI: 0.908–1.000). (B) The area under the ROC curve were 0.994 (p < 0.0001; 95% CI: 0.979–1.000) for left superior longitudinal fasciculus (MD); right posterior limb of internal capsule (MD) 0.891, (p < 0.0001; 95% CI: 0.804–0.979); right posterior thalamic radiation (MD) 0.918, (p < 0.0001; 95% CI: 0.841–0.994); genu of corpus callosum (AD) 0.888, (p < 0.0001; 95% CI: 0.794–0.982); right posterior limb of internal capsule (AD) 0.880, (p < 0.0001; 95% CI: 0.784–0.976); right splenium of corpus callosum (AD) 0.900, (p < 0.0001; 95% CI: 0.816–0.984). (C) The area under the ROC curve were 0.941, (p < 0.0001; 95% CI: 0.879–1.000) for left anterior corona radiata; body of corpus callosum 0.867, (p < 0.0001; 95% CI: 0.765–0.969); left superior longitudinal fasciculus (ODI) 0.874, (p < 0.0001; 95% CI: 0.780–0.967); right splenium of corpus callosum 0.968, (p < 0.0001; 95% CI: 0.916–1.000); left posterior corona radiata 0.971, (p < 0.0001; 95% CI: 0.934–1.000). (D) The area under the ROC curve were 0.880 (p < 0.0001; 95% CI: 0.790–0.970) for left superior longitudinal fasciculus (FICVF). Abbreviations: FA: fractional anisotropy; MD: mean diffusivity; AD: axial diffusivity; RD: radial diffusivity; ODI: orientation dispersion index; FISO: isotropic volume fraction; FICVF: intra-cellular volume fraction; AUC: area under the curve; ROC: receiver operating characteristic.
Figure 4
Figure 4
Correlations between the DTI values, NODDI values and AS, DS. (A) The value of AS and DS in two groups. (BG) In There was a positive correlation with the values of MD and DS, AS. And the mean value of FICVF was negatively correlated with DS and AS. Abbreviations: DS: depression score; AS: anxiety score; MD: mean diffusivity; FICVF: intra-cellular volume fraction; HC: Healthy controls; PAT: patient.
Figure 5
Figure 5
The mean DTI and NODOI values of altered brain regions. (A) Compared with the HCs, the DTI values of the following regions were decreased to various extents: 2- left superior longitudinal fasciculus (FA) (t = −6.78), 4- body of corpus callosum (FA) (t = −6.25). Compared with the HCs, the DTI values of the following regions were increased to various extents: 1- left superior longitudinal fasciculus (MD) (t =7.61), 7- right posterior limb of internal capsule (MD) (t = 5.31), 8- right posterior thalamic radiation (MD) (t = 4.94), 3- genu of corpus callosum (AD) (t = 6.37), 6- right posterior limb of internal capsule (AD) (t = 5.36), 5- right splenium of corpus callosum (AD) (t = 5.47). (B) Compared with the HCs, the NODOI values of the following regions were increased to various extents: 2- left anterior corona radiata (t = 5.17), 6- body of corpus callosum (t = 4.18), 5- left superior longitudinal fasciculus (ODI) (t = 4.54), 1- right splenium of corpus callosum (t = 6.86), 3- left posterior corona radiata (t = 5.03). Compared with the HCs, the NODOI values of the following regions were decreased to various extents: 4- left superior longitudinal fasciculus (FICVF) (t = −4.56). Abbreviations: HCs: healthy controls; DTI: diffusion tensor imaging; FA: fractional anisotropy; MD: mean diffusivity; AD: axial diffusivity; ODI: orientation dispersion index; FISO: isotropic volume fraction; FICVF: intracellular volume fraction.
Figure 6
Figure 6
Correlation between DTI and NODDI values and emotional disorder. Compared with HC group, the values of DTI and NODDI in some brain white matter regions were significantly different in PAT group, and patients with dry eye were more prone to depression and anxiety. Abbreviations: HC: healthy controls; PAT: patient controls.

Similar articles

Cited by

References

    1. Jones MB, McElwain DL, Fulford GR, Collins MJ, Roberts AP. The effect of the lipid layer on tear film behaviour. Bull Math Biol. 2006; 68:1355–81. 10.1007/s11538-006-9105-9 - DOI - PubMed
    1. Tan CH, Labbé A, Liang Q, Qiao L, Baudouin C, Wan X, Wang N. Dynamic change of optical quality in patients with dry eye disease. Invest Ophthalmol Vis Sci. 2015; 56:2848–54. 10.1167/iovs.14-15757 - DOI - PubMed
    1. Kalangara JP, Galor A, Levitt RC, Felix ER, Alegret R, Sarantopoulos CD. Burning Eye Syndrome: Do Neuropathic Pain Mechanisms Underlie Chronic Dry Eye? Pain Med. 2016; 17:746–55. 10.1093/pm/pnv070 - DOI - PMC - PubMed
    1. Levitt AE, Galor A, Chowdhury AR, Felix ER, Sarantopoulos CD, Zhuang GY, Patin D, Maixner W, Smith SB, Martin ER, Levitt RC. Evidence that Dry Eye Represents a Chronic Overlapping Pain Condition. Mol Pain. 2017; 13:1744806917729306. 10.1177/1744806917729306 - DOI - PMC - PubMed
    1. Semba CP, Gadek TR. Development of lifitegrast: a novel T-cell inhibitor for the treatment of dry eye disease. Clin Ophthalmol. 2016; 10:1083–94. 10.2147/OPTH.S110557 - DOI - PMC - PubMed

MeSH terms