. 2022 Mar 24;13(1):1585.
doi: 10.1038/s41467-022-29065-2.

Ultrasound-controllable engineered bacteria for cancer immunotherapy

Affiliations

Ultrasound-controllable engineered bacteria for cancer immunotherapy

Mohamad H Abedi et al. Nat Commun. .

Abstract

Rapid advances in synthetic biology are driving the development of genetically engineered microbes as therapeutic agents for a multitude of human diseases, including cancer. The immunosuppressive microenvironment of solid tumors, in particular, creates a favorable niche for systemically administered bacteria to engraft and release therapeutic payloads. However, such payloads can be harmful if released outside the tumor in healthy tissues where the bacteria also engraft in smaller numbers. To address this limitation, we engineer therapeutic bacteria to be controlled by focused ultrasound, a form of energy that can be applied noninvasively to specific anatomical sites such as solid tumors. This control is provided by a temperature-actuated genetic state switch that produces lasting therapeutic output in response to briefly applied focused ultrasound hyperthermia. Using a combination of rational design and high-throughput screening we optimize the switching circuits of engineered cells and connect their activity to the release of immune checkpoint inhibitors. In a clinically relevant cancer model, ultrasound-activated therapeutic microbes successfully turn on in situ and induce a marked suppression of tumor growth. This technology provides a critical tool for the spatiotemporal targeting of potent bacterial therapeutics in a variety of biological and clinical scenarios.


Conflict of interest statement

The authors declare no competing interests.

Figures
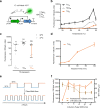
Fig. 1
Fig. 1. Evaluating temperature-sensitive transcriptional repressors in E. coli Nissle 1917.
a Illustration of the genetic circuit used to characterize the behavior of temperature-sensitive repressors in E. coli Nissle 1917. b Optical density (OD600)-normalized fluorescence as a function of induction temperature for a fixed duration of 1 h, measured 24 h after induction. Error bars represent ±SEM. To confirm that the resulting data is not driven by temperature driven changes to OD, wildtype EcN were similarly analyzed and displayed no temperature dependent fold change. Additionally, total cell count by flow cytometry was also used as a proxy for cell number and generated similar results to the ones collected by normalizing through OD as a proxy for cell count (Supplementary Fig. 1). c OD-normalized fluorescence 24 h after a 1-hour induction at 37 °C or 42 °C for the constructs shown in (b). Measurements with values below the bottom of the y-axis appear below the axis. Bars indicate the mean. Vertical lines indicate the difference between the 42 °C and 37 °C conditions. Numbers indicate fold-change. d OD-normalized fluorescence as a function of induction duration. Cells were stimulated at 42 °C and fluorescence measured 24 h later. e Illustration of the pulsatile heating scheme used to optimize thermal induction and cell viability. f OD-normalized fluorescence as a function of pulse duration for the TcI42 circuit. All samples were stimulated for a total of 1 h at 42 °C and 1 h at 37 °C and evaluated 24 h later. Viable cell counts at various pulse durations plotted to reflect cell viability. Where not seen, error bars (±SEM) are smaller than the symbol. n = [5, 5, 6, 4] biologically independent replicates for panels [b, c, d, f]. All source data are provided as a Source Data file.
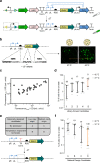
Fig. 2
Fig. 2. Construction and optimization of a temperature responsive state switch.
a Illustration of the genetic circuit constructed to establish a temperature responsive state switch. TetR is the tetracycline resistance cassette. b Illustration of the sites targeted in a high throughput screen to optimize circuit switching. A representative fluorescence image of replica plates used to screen for circuit variants. Plates were incubated at the indicated temperature for one hour and further incubated at 37 °C until colonies grew large enough for analysis. The orange circle indicates an example colony selected for further assay. c Circuit variants from the screen in (b) characterized for their fluorescence at 37 °C and 42 °C. d Percent conversion to the on-state 24 h after a 1-hour thermal stimulation at 42 °C or 37 °C for five of the circuit variants from (c). Bars indicate the mean. Vertical lines indicate the difference between the 42 °C and 37 °C conditions. Numbers indicate fold-change. e Summary of rational modifications made to reduce leakage in the circuit at 37 °C. f Percent induction 24 h after a 1-hour of thermal induction at 42 °C compared to baseline incubation at 37 °C for four circuit variants described in e. Measurements with values below the bottom of the y-axis appear below the axis. Bars indicate the mean. Vertical lines indicate the difference between the 42 °C and 37 °C conditions. Numbers indicate fold-change. n = [4, 5] biologically independent replicates for panel [d, f]. All source data are provided as a Source Data file.
Fig. 3
Fig. 3. Thermally activated sustained release of a therapeutic payload.
a Temperature responsive state switch modified to release αCTLA-4 or αPD-L1 nanobodies. The circuit includes an Axe-Txe stability cassette. b Percent activation 24 h after a 1-hour of thermal induction at 37 °C, 42 °C or 43 °C for the circuit described in (a). Error bars represent (±SEM). c Western blot against hexahistidine-tagged αCTLA-4 nanobodies. Cells were induced for 1 h at 37 °C, 42 °C or 43 °C, then expanded in 5 ml of media for 24 h at 37 °C before collecting the media and assaying for the release of αCTLA-4 nanobodies. The original western blot image is shown in Supplementary Fig. 2. Similar staining was done to confirm αPD-L1 release. n = 8 biologically independent replicates for (b). All source data are provided as a Source Data file.
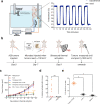
Fig. 4
Fig. 4. Ultrasound-activated bacterial immunotherapy reduces tumor growth in vivo.
a Illustration of the automated setup used to deliver FUS hyperthermia to tumors (left) and representative time course of tumor temperature from a mouse treated with alternating 5-min steps between 37 °C and 43 °C. b Diagram illustrating the experiment performed to assess the activation of microbial antitumor immunotherapy in vivo. Mice were injected with a 1:1 mixture of EcN cells carrying the αCTLA-4 or αPD-L1 circuits, or wildtype EcN. EcN cells were washed and adjusted to 0.625 OD600 before injecting 100 μL per mouse intravenously. Ultrasound was applied for a total of 1 h at 43 °C with 50% duty cycle and 5-min pulse duration. c Tumor sizes measured over two weeks in mice treated with wildtype EcN, therapeutic microbes in the absence of FUS, therapeutic microbes and FUS treatment, or FUS treatment alone. Asterisk represents statistical significance calculated with two-way ANOVA analysis where the therapy was compared to each of the controls with a Dunnett’s multiple comparisons test (one-sided). * plotted, p = [0.004(**), 0.0384(*), 0.0083(**)] when compared to [Wildtype, Therapeutic, FUS]; **** plotted, p = [<0.0001 for all]. d Percent activation of therapeutic EcN isolated from FUS-treated (nine mice) and non-FUS-treated (five mice) tumors two weeks after FUS treatment. ** plotted represents a p value of 0.0085 when measured with a one-tailed Mann Whitney test. One of the FUS-activated tumors disappeared after treatment and bacterial activation inside it could not be quantified. Results in (c, d) were collected from four independent experiments conducted on separate days with new cells transformed for each. Where not seen, error bars (±SEM) are smaller than the symbol. Eight mice were analyzed for the [therapeutic EcN, FUS] groups, ten mice for the wildtype group, four for the therapeutic EcN (pre-activated), and six mice for the PD-L1 mAb + CTLA-4 mAb group. Ten mice were analyzed for the therapeutic condition, where three failed to activate. Data from nine therapeutic mice is displayed in panel (d) since in the tenth the tumor disappeared and couldn’t be analyzed. e Background activation in bystander tissues following FUS activation of tumors. Percent activation of therapeutic EcN isolated from FUS-treated tumors and bystander organs (liver, spleen). *p = 0.0143 (tumor vs liver) and 0.0143 (tumor vs spleen). Statistical analysis was done with a Mann Whitney test (one-sided). Four mice were analyzed in panel (e). All source data are provided as a Source Data file.

References

    1. Zhou S, Gravekamp C, Bermudes D, Liu K. Tumour-targeting bacteria engineered to fight cancer. Nat. Rev. Cancer. 2018;18:727–743. - PMC - PubMed
    1. Weber EW, Maus MV, Mackall CL. The emerging landscape of immune cell therapies. Cell. 2020;181:46–62. - PMC - PubMed
    1. Yu JX, Upadhaya S, Tatake R, Barkalow F, Hubbard-Lucey VM. Cancer cell therapies: the clinical trial landscape. Nat. Rev. Drug Discov. 2020;19:583–584. - PubMed
    1. Fucà G, Reppel L, Landoni E, Savoldo B, Dotti G. Enhancing chimeric antigen receptor T-cell efficacy in solid tumors. Clin. Cancer Res. 2020;26:2444–2451. - PMC - PubMed
    1. Anderson KG, Stromnes IM, Greenberg PD. Obstacles posed by the tumor microenvironment to T cell activity: a case for synergistic therapies. Cancer Cell. 2017;31:311–325. - PMC - PubMed

Publication types